


Building robust software requires more than just writing code. It demands clear communication and precise architectural planning. When developing a login system, the flow of data between components is critical. A single misstep in authentication logic can lead to security vulnerabilities or poor user experiences. This is where visual modeling becomes indispensable.
Sequence diagrams provide a window into the temporal behavior of a system. They map out interactions over time, showing who talks to whom and what data is exchanged. In this guide, we will dissect a real-world scenario: modeling a secure login mechanism. We will explore the actors, the lifelines, the messages, and the decision points that define a successful authentication flow.
📐 Understanding the Foundation: What is a Sequence Diagram?
A sequence diagram is a type of interaction diagram in the Unified Modeling Language (UML). It emphasizes the time ordering of messages. Unlike a class diagram that shows static structure, this dynamic view reveals how objects collaborate to achieve a specific goal.
For a login system, this visualization helps developers identify bottlenecks. It clarifies where hashing occurs and where session tokens are issued. It also highlights potential failure points, such as network timeouts or invalid credentials.
Key Components:
- Lifelines: Vertical lines representing objects or participants (e.g., User, API Gateway).
- Messages: Arrows showing data flow between lifelines.
- Activation Bars: Rectangles on lifelines indicating when an object is performing an action.
- Combined Fragments: Boxes labeled
altoroptrepresenting conditional logic like if/else statements.
🏗️ Defining the System Architecture
Before drawing lines, we must define the participants. A modern login system typically involves several layers. We will model a scenario where a client application communicates with a backend service to authenticate a user.
The Actors and Objects:
| Entity | Role | Responsibility |
|---|---|---|
| Client Application | Interface | Collects credentials and displays status. |
| Load Balancer | Router | Distributes incoming requests to available servers. |
| API Gateway | Entry Point | Handles authentication, rate limiting, and logging. |
| Auth Service | Logic Core | Verifies credentials and issues tokens. |
| User Database | Storage | Stores hashed passwords and user metadata. |
By isolating these components, we ensure that the diagram remains readable. Each vertical line represents a distinct responsibility, making it easier to trace the path of a login request.
🔑 The Happy Path: Successful Authentication
Let us begin with the standard flow. This is the scenario where everything works as intended. The user enters valid credentials, and the system grants access.
Step 1: Credential Submission
The process starts on the client side. The user inputs their username and password into the form. The client application serializes this data into a request payload. Typically, this is an HTTP POST request.
- Action: Client sends
POST /api/login. - Data: Username and encrypted password.
- Destination: API Gateway.
Step 2: Gateway Validation
Upon receipt, the API Gateway performs initial checks. This includes verifying that the request format is correct and checking for rate limiting. If the user has attempted too many logins recently, the request is rejected here.
- Check: Is the IP address blocked?
- Check: Is the API key valid?
- Result: Forward request to Auth Service.
Step 3: Database Lookup
The Auth Service receives the request. It queries the User Database to retrieve the record associated with the provided username. It is crucial to note that the database does not store plain text passwords.
- Query:
SELECT * FROM users WHERE username = ?. - Output: User record including the password hash and salt.
- Security: The database connection must be encrypted.
Step 4: Verification
The Auth Service takes the submitted password and hashes it using the same algorithm (e.g., bcrypt or Argon2) and salt stored in the database. It then compares the generated hash with the stored hash.
- Process: Hash input = Hash stored?
- Outcome: If true, proceed. If false, abort.
Step 5: Token Issuance
Once verified, the system generates a session token. This token acts as a proof of identity for subsequent requests. It contains user claims and has an expiration time.
- Generation: Create JWT (JSON Web Token).
- Storage: Optionally store token ID in Redis for revocation.
- Response: Return token and user profile to Client.
⚠️ Handling Edge Cases and Errors
A robust diagram must account for failure. In real-world systems, errors occur frequently. We use combined fragments to represent these alternative paths.
Invalid Credentials
When the hash comparison fails, the system must respond securely. It should not reveal whether the username exists or if the password is wrong. This prevents enumeration attacks.
- Message:
401 Unauthorized. - Content: Generic error message (“Invalid credentials”).
- Logging: Log the attempt for security auditing.
Rate Limiting
To prevent brute-force attacks, the API Gateway enforces limits. If a user exceeds the threshold within a time window, further requests are blocked.
- Condition: Attempts > Max Allowed?
- Response:
429 Too Many Requests. - Action: Temporarily lock account or IP.
Network Timeouts
Communication between the Auth Service and the Database can fail. The diagram should show a timeout message returning to the Client.
- Condition: Database response > Timeout Threshold?
- Response:
503 Service Unavailable. - Action: Retry logic or user notification.
🛡️ Security Considerations in Modeling
Modeling a login system is not just about functionality; it is about security posture. Every interaction in the diagram represents a potential attack vector.
Transport Layer Security:
- All arrows in the diagram should imply HTTPS.
- Credentials must never be logged in plain text.
- Session tokens must be transmitted over secure channels only.
Token Management:
- Short-lived access tokens reduce the window of opportunity for attackers.
- Refresh tokens allow users to stay logged in without re-entering credentials.
- Revocation lists allow immediate invalidation of compromised tokens.
Input Validation:
- The Client Application must validate input length and format before sending.
- The API Gateway must sanitize inputs to prevent injection attacks.
🔄 Advanced Flows: Refresh and Logout
A login system does not end with the initial handshake. Sessions expire, and users need to logout. These flows require additional lifelines and messages.
Token Refresh
When an access token expires, the user should not be forced to log in again immediately. The client uses the refresh token to obtain a new access token.
- Trigger: Access token expiration.
- Request: POST
/api/refresh. - Validation: Check refresh token validity and expiration.
- Response: New access token.
Logout
Logout is not just deleting local storage. It involves invalidating the session on the server side to prevent reuse.
- Request: DELETE
/api/logout. - Action: Remove token from Redis or Blacklist.
- Response: Clear client storage and redirect to login.
📝 Best Practices for Diagramming
Creating these diagrams is an iterative process. To ensure they remain useful artifacts, follow these guidelines.
Keep It Readable
- Avoid overlapping lines. Use orthogonal routing.
- Limit the number of participants to those essential for the scenario.
- Use abbreviations only if they are standard within your team.
Focus on the Flow
- Do not clutter the diagram with internal logic (e.g., specific SQL queries).
- Show the interaction, not the implementation details.
- Use notes to clarify complex business rules.
Version Control
- Treat diagrams like code. Store them in your repository.
- Update the diagram whenever the architecture changes.
- Review diagrams during code reviews to ensure alignment.
🚧 Common Pitfalls to Avoid
Even experienced architects make mistakes when modeling interactions. Awareness of common errors can save significant debugging time later.
Ignoring Asynchronous Messages
Some operations, like sending an email confirmation, happen after the main response. These should be shown as asynchronous arrows (open arrowhead).
Missing Error Handling
Only showing the happy path gives a false sense of security. Always map out the failure conditions for every external call.
Overloading Lifelines
Do not put every possible function on a single lifeline. Split responsibilities. For example, separate the Auth Service from the Notification Service.
Skipping Security Layers
Do not draw a direct line from Client to Database. This implies a direct connection that bypasses the API Gateway and Auth Service. Always represent the intermediaries.
🛠️ Maintenance and Evolution
Software is not static. Requirements change, and new features are added. Your sequence diagrams must evolve alongside the codebase.
Regular Audits
Set a schedule to review your diagrams. Are the lifelines still accurate? Have new microservices been introduced?
Documentation Sync
Ensure that API documentation matches the diagram. If the diagram shows a specific endpoint, the documentation must reflect that exact path and payload.
Onboarding Tool
Use these diagrams to train new team members. They provide a high-level view of the system without requiring a deep dive into code.
🔍 Analyzing the Diagram for Performance
Beyond logic, sequence diagrams help identify performance bottlenecks. By looking at the depth of the call chain, you can estimate latency.
- Deep Chains: Too many sequential calls increase latency. Consider parallel processing.
- Database Calls: Multiple queries in a single request can slow down the system. Use batch operations.
- External APIs: Calls to third-party services introduce network overhead. Cache results where possible.
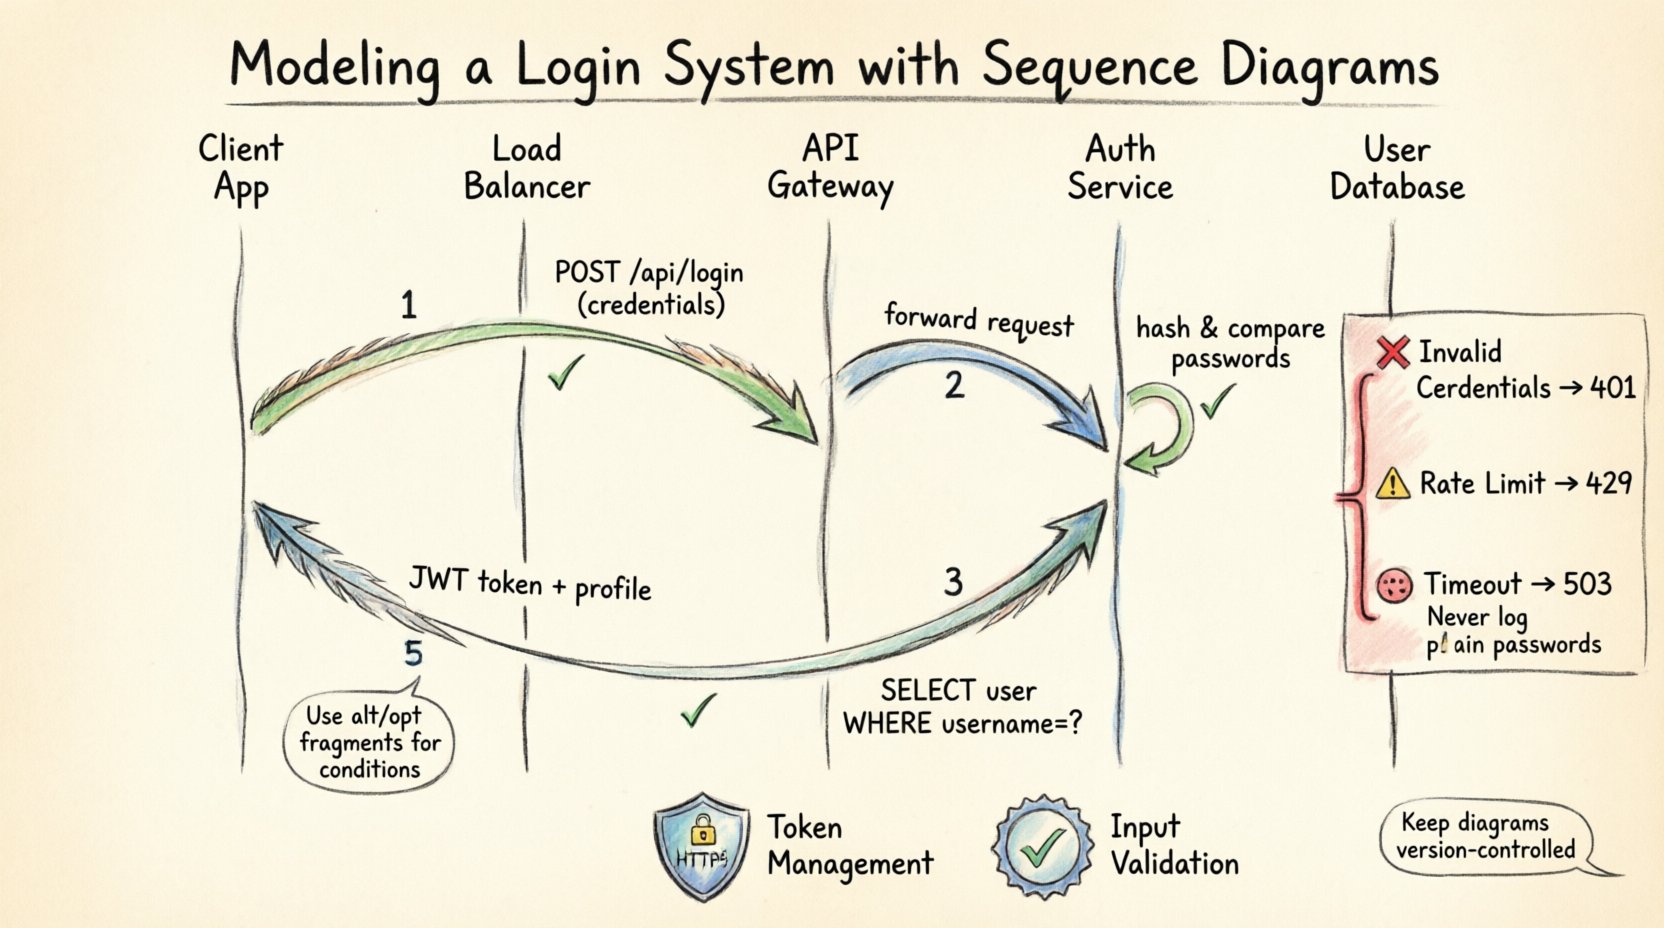
📊 Summary of Interactions
To consolidate the information, here is a summary of the critical messages exchanged during the login lifecycle.
| Step | Sender | Receiver | Message Type | Purpose |
|---|---|---|---|---|
| 1 | Client | API Gateway | HTTP POST | Submit Credentials |
| 2 | API Gateway | Auth Service | Internal RPC | Forward Request |
| 3 | Auth Service | Database | SQL Query | Retrieve User |
| 4 | Auth Service | Auth Service | Function Call | Verify Hash |
| 5 | Auth Service | Client | HTTP Response | Return Token |
🧩 Final Thoughts on System Design
Modeling a login system with sequence diagrams is a disciplined approach to software engineering. It forces clarity and exposes complexity before a single line of code is written. By visualizing the flow, teams can align on security requirements and performance expectations.
The value lies in the conversation the diagram sparks. It is a tool for collaboration, ensuring that developers, testers, and stakeholders share a common understanding of the system. As technology evolves, the principles of clear communication remain constant. Invest time in these diagrams, and the resulting code will be more maintainable and secure.
Remember, a diagram is a living document. It should grow and change as your system does. Keep it updated, keep it accurate, and use it to guide your architecture decisions. This practice builds a foundation for scalable and resilient software systems.

