


Introduction
In today’s fast-paced project environments, clarity, precision, and adaptability are non-negotiable. Whether you’re launching a new software product, coordinating a marketing campaign, or managing infrastructure development, understanding when tasks happen, how they connect, and what could delay your timeline is critical to success. Enter the PERT Chart—a time-tested project management visualization tool that transforms complex workflows into actionable, visual roadmaps.
Originally developed by the U.S. Navy in 1957 for the Polaris submarine program, PERT (Program Evaluation and Review Technique) has evolved from a military scheduling tool into a universal framework used across industries—from software development to event planning. Today, with the integration of AI-powered generation, creating professional PERT charts is faster, smarter, and more accessible than ever.
This comprehensive guide walks you through PERT chart fundamentals using a real-world case study approach. You’ll learn not only what PERT charts are and why they matter, but exactly how to build one—from manual drafting to AI-assisted creation—while exploring enhanced features like swimlanes, critical path analysis, and dynamic task management. By the end, you’ll have a practical, repeatable framework for planning any complex project with confidence.

What is a PERT Chart?
A PERT chart is a project management tool used to schedule, organize, and coordinate tasks within a project. It is basically a method to analyze the tasks involved in completing a given project, especially the time needed to complete each task, and to identify the minimum time needed to complete the total project.
The main objective of PERT is to facilitate decision making and to reduce both the time and cost required to complete a project. PERT is intended for very large-scale, one-time, non-routine, complex projects with a high degree of inter-task dependency, projects which require a series of activities, some of which must be performed sequentially and others that can be performed in parallel with other activities.
PERT in project management has been around for a while, but it in fact was developed in the U.S. Navy. In 1957, its Special Projects Office created the PERT chart to assist in its Polaris nuclear submarine project. Since then, it’s found a home in all manner of industries, even the 1968 Winter Olympics in Grenoble.
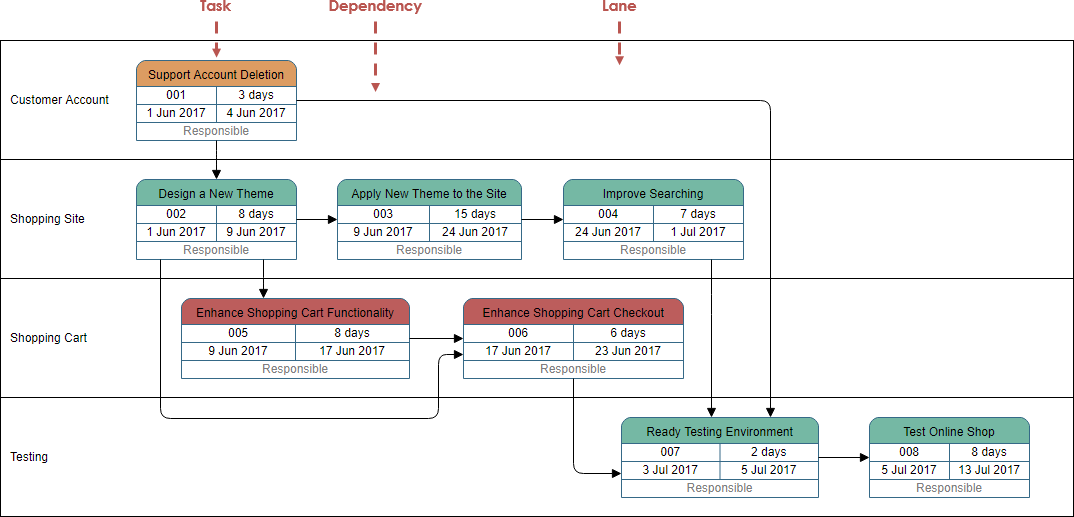
PERT Chart Notations
Task
In Visual Paradigm, a Task has:
-
Task Name
-
Task ID
-
Duration
-
Start Date and End Date
Dependency
Links connect project tasks to indicate the time dependency relationship among them, that is, when the preceding task is completed, the succeeding task can start.
Enhanced PERT Chart Features
Visual Paradigm enhanced the basic PERT chart notation by adding two powerful project management features:
-
Lanes – for partitioning tasks based on categories like the party who is responsible for what (tasks) in the PERT Chart.
-
Automated Task Assignment and Management – for assigning tasks in the PERT Chart to the Visual Paradigm’s Task Manager – Tasifier.
Lane
A lane allows you to arrange your Pert Chart into horizontal zones separated by lines. Each zone represents the responsibilities of the particular class, worker or any concepts which the group of tasks it is responsible for.
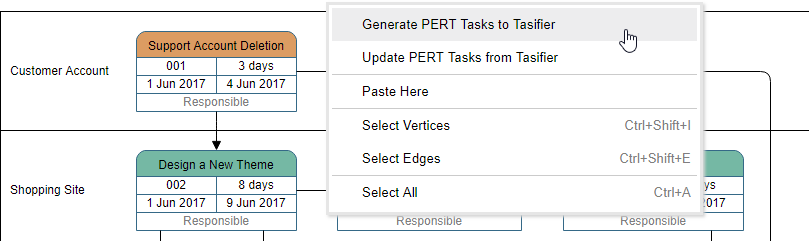
Assign PERT Tasks to Tasifier
In addition to the functions of an ordinary PERT Chart, the Enhanced PERT Chart tool embedded four major features for integrating with different processes with Tasifier, the Task Management tool:
-
Selection of Responsible person (associate the task who responsible for)
-
Task to Task Manager (Visual Paradigm Tasifier)
When to Draw a PERT Chart
Project managers can use PERT charts to solve the following problems:
-
Plan a realistic timetable for project completion.
-
Identify critical path – since the path leads to the minimum time the project requires, any delays to these tasks will impact the completion of the overall project.
-
Identify tasks that can be carried out concurrently.
-
Identify tasks that need to be compressed if the overall project time needs to be reduced.
-
Identify slack time where certain tasks are not as time-critical to the overall deadline.
Case Study: Planning a Website Launch Project with PERT Charts
Let’s walk through a practical, step-by-step case study to demonstrate how PERT charts work in real-world scenarios.
🎯 Project Scenario
Goal: Launch a new company website within 10 weeks
Team: Project Manager, UX Designer, Frontend Developer, Content Writer, QA Tester
Key Deliverables: Design mockups, HTML/CSS implementation, content creation, testing, deployment
Step 1: Identify Activities and Milestones
First, break down the project into discrete, actionable tasks:
| Task ID | Task Name | Duration (Days) | Dependencies |
|---|---|---|---|
| A | Define project scope & requirements | 3 | – |
| B | Create wireframes & design mockups | 5 | A |
| C | Write website content | 4 | A |
| D | Develop frontend (HTML/CSS) | 7 | B |
| E | Integrate content into frontend | 3 | C, D |
| F | Conduct QA testing | 4 | E |
| G | Fix bugs & finalize | 2 | F |
| H | Deploy to production | 1 | G |
Step 2: Determine Proper Sequence
Map dependencies visually:
-
Tasks B and C can run in parallel after A
-
Task D depends on B; Task E depends on both C and D
-
Final deployment (H) requires all prior tasks to complete
Step 3: Construct the PERT Diagram
Using the task list above, build your network diagram:
Step 4: Estimate Time Using Three-Point Analysis (Optional but Recommended)
For greater accuracy, apply PERT’s signature time estimation formula:
Expected Time = (Optimistic + 4×Most Likely + Pessimistic) ÷ 6
Example for Task D (Frontend Development):
-
Optimistic: 5 days
-
Most Likely: 7 days
-
Pessimistic: 10 days
-
Expected Time = (5 + 28 + 10) ÷ 6 = 7.2 days
Step 5: Determine the Critical Path
Calculate earliest/latest start and finish times for each task. The critical path is the longest sequence of dependent tasks that determines the minimum project duration.
For our website project:
A (3) → B (5) → D (7) → E (3) → F (4) → G (2) → H (1) = 25 days
Any delay in these tasks directly delays the entire project.
Step 6: Update as Project Progresses
As work completes, update actual durations vs. estimates. If Task D takes 9 days instead of 7, recalculate the critical path and adjust resources accordingly.
How to Draw a PERT Chart? (Manual Method)
PERT planning involves the following steps:
-
Identify the specific activities and milestones.
-
Determine the proper sequence of the activities.
-
Construct a PERT diagram.
-
Estimate the time required for each activity.
-
Determine the critical path.
-
Update the PERT chart as the project progresses.
PERT Chart Examples for Inspiration
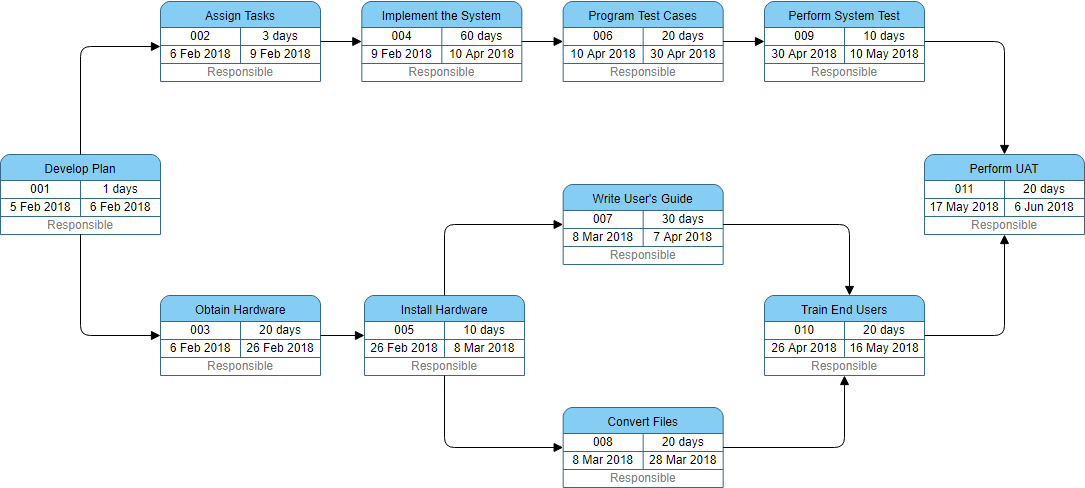
Project Preparation Example – The following PERT Chart shows:
Suppose a systems analyst is trying to set up a realistic schedule for the data gathering and proposal phases of the systems analysis and design life cycle. The systems analyst looks over the situation and lists activities that need to be accomplished along the way, and formed a PERT Chart as follows:

Software Development Template – The PERT Chart example below shows:
A generic template for software project management from analysis, design, build and test with phase in the lane.

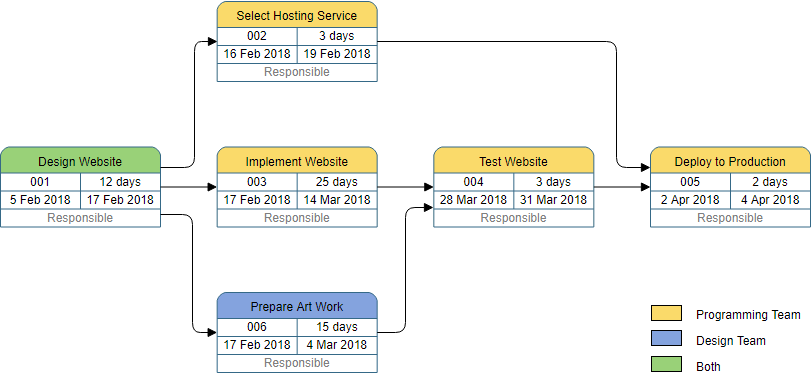
Website Creation Example – The following PERT Chart example below shows:
The PERT Chart shows the tasks involved in the process for creating a website, which includes, select hosting services, design website, writing HTML, artwork design, and etc.
PERT Template – Task with Milestones:

PERT Chart Example – Project Management:
New in OpenDocs: AI-Powered PERT Chart Support – Generate Project Timelines Effortlessly
February 12, 2026
EDITION REQUIRED | DESKTOP Professional | VP ONLINE Combo
We’re excited to announce the latest enhancement to OpenDocs, our powerful AI-powered knowledge management tool from Visual Paradigm. As part of our ongoing commitment to supercharge your documentation and project planning workflows, we now fully support PERT charts – with seamless AI generation capabilities.
What is a PERT Chart?
A PERT chart (Program Evaluation and Review Technique) is a proven project management visualization that maps out tasks, dependencies, milestones, and timelines in a network diagram format. Originally developed by the U.S. Navy, PERT charts excel at handling uncertainty by using optimistic, most likely, and pessimistic time estimates for each task, helping teams identify the critical path, optimize schedules, and manage complex projects with greater clarity and precision.
Whether you’re a project manager coordinating cross-functional teams, a business analyst outlining deliverables, or a software architect planning implementation phases, the PERT chart remains an essential tool for effective project scheduling and risk assessment.
Introducing AI-Powered PERT Chart Creation in OpenDocs
Today, we’re thrilled to add PERT chart to the growing list of diagram types fully supported in OpenDocs. This joins our recent additions of EPC diagrams and Component diagrams, expanding your visual storytelling options even further.
With our cutting-edge AI PERT chart generator, you can now create professional, ready-to-refine PERT charts in seconds – simply describe your project in natural language, and let the AI handle the rest. No more starting from scratch or wrestling with manual node placement and arrow connections.
Key highlights of the new PERT chart support:
-
AI generation from text descriptions – Input a project overview (e.g., “Develop a mobile banking app with user registration, transaction processing, and security verification phases”), and watch the AI build a complete PERT network diagram with tasks, dependencies, and estimated timelines.
-
Full editing in our rich diagram editor – Customize nodes (events/milestones), arrows (tasks), time estimates, and labels to fit your exact needs.
-
Seamless integration – Embed your PERT chart directly into any OpenDocs page as a live diagram component, or create a dedicated Component Page for focused viewing and collaboration.
-
Perfect for project documentation – Combine your PERT chart with detailed notes, requirements, and other diagrams in one centralized, shareable space.
Why Use the AI PERT Chart Tool in OpenDocs?
Our AI PERT chart tool dramatically accelerates project planning while maintaining professional quality. Boost productivity, reduce manual effort, and ensure your documentation is always clear, consistent, and visually compelling – all within our intuitive, web-based AI-powered knowledge management tool.
Whether you’re documenting project roadmaps, analyzing critical paths, or sharing progress with stakeholders, OpenDocs makes it effortless to turn complex ideas into actionable visuals.
How to Create a PERT Chart with AI: Step-by-Step Case Study
Let’s apply AI-powered PERT generation to our website launch case study.
Scenario Prompt:
“Create a PERT chart for launching a company website in 10 weeks. Include tasks for requirements gathering, design, content creation, frontend development, testing, and deployment. Show dependencies and identify the critical path.”
Step 1: Access the AI Generator
-
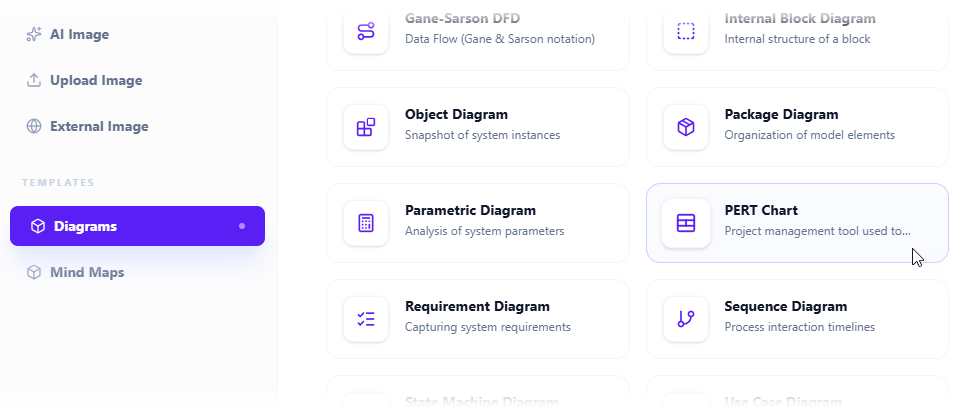
Click on the Insert button in the top bar of your document editor.

-
The Insert dialog box is opened. Select Diagrams tab on the left, and then PERT Chart on the right.
Step 2: Launch AI Generation
-
This opens the diagram editor. You can draw the PERT Chart using the symbols on the palette (Just drag and drop a symbol onto the diagram canvas).
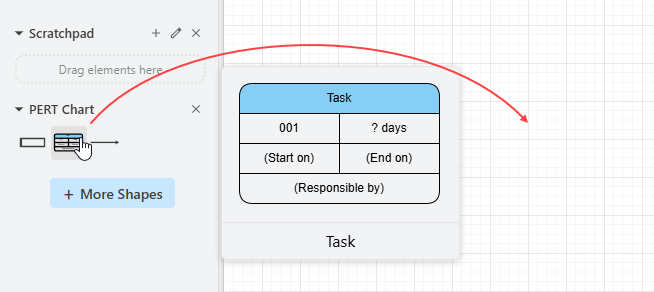
To generate a diagram with AI, click on Create with AI at the top right.

Step 3: Describe Your Project
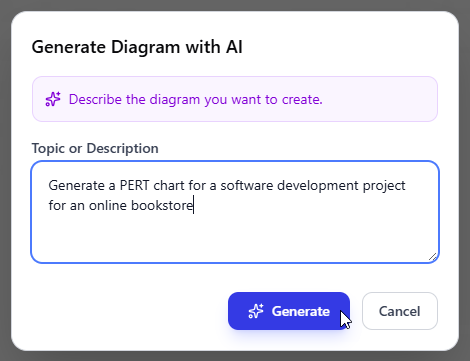
-
Describe your problem in the input box. Click Generate.
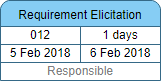
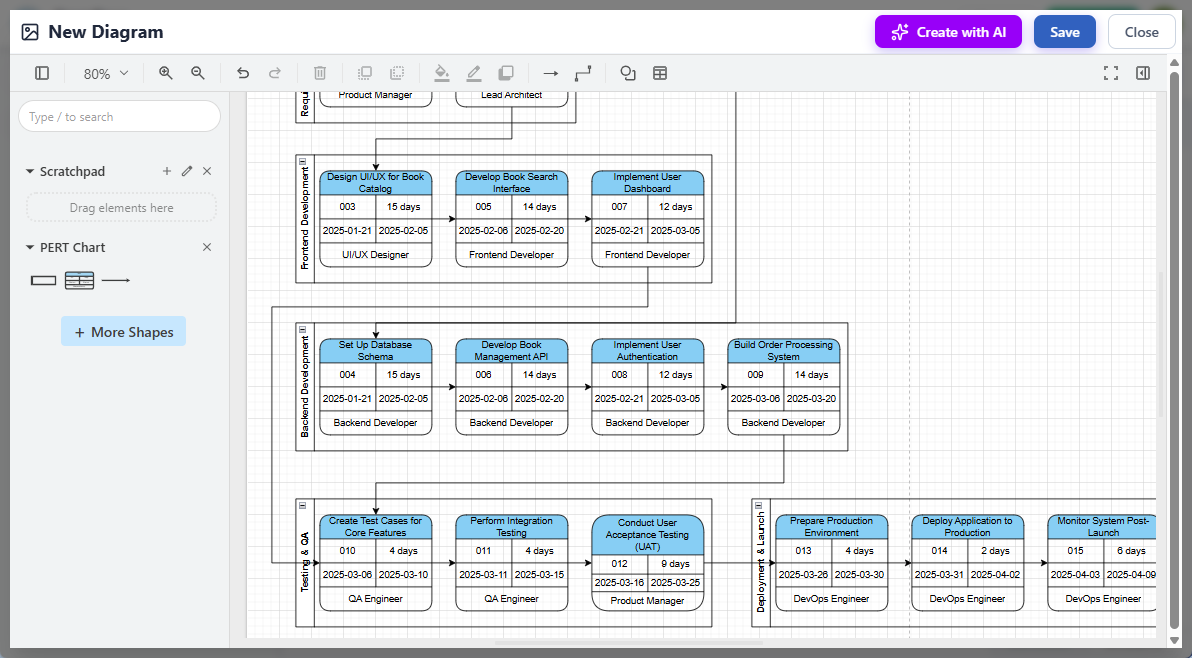
Step 4: Review & Refine AI Output
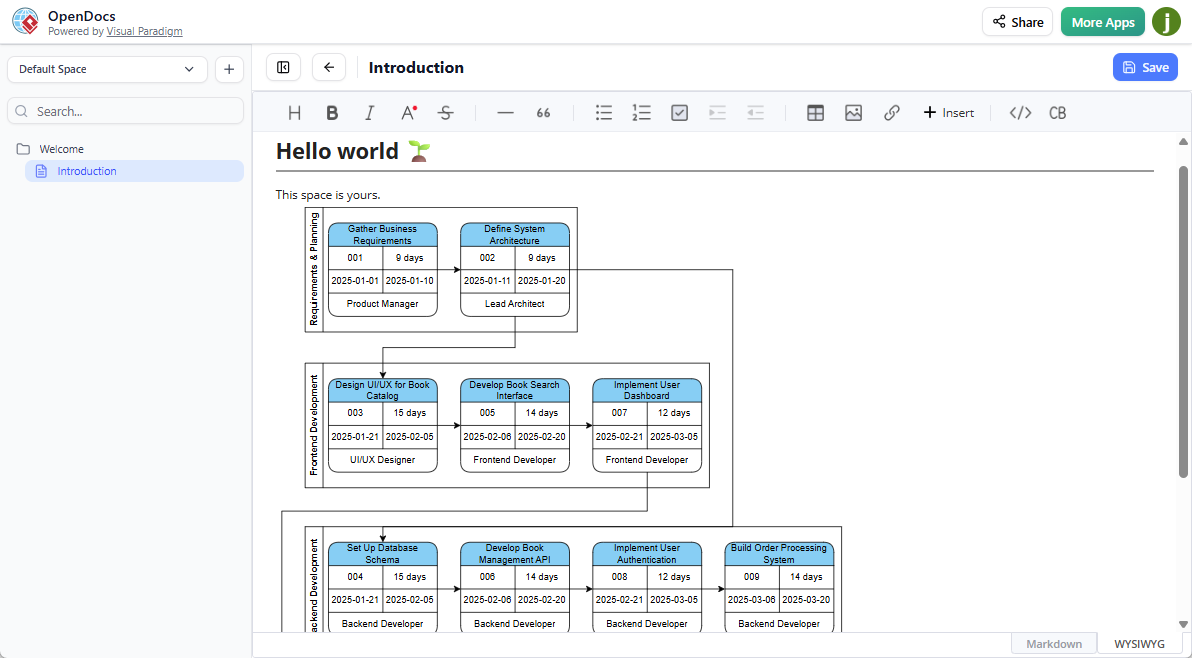
-
AI will analyze your problem and generate a PERT Chart accordingly. Below is an example generated.
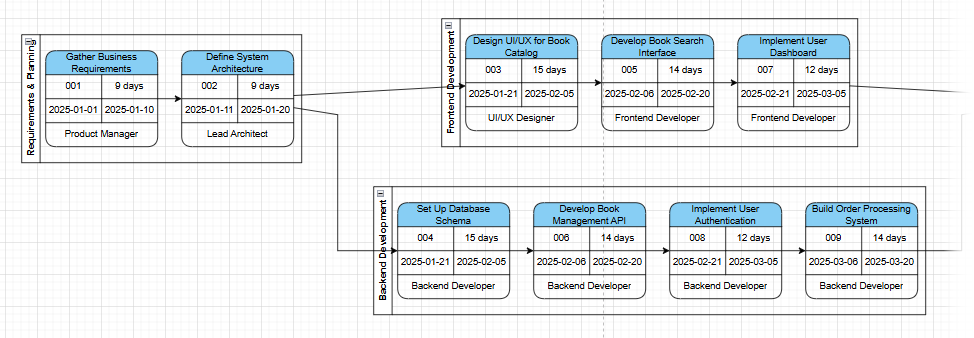
-
Touch up the PERT Chart by adjusting the layout, adding new shapes, etc.
Step 5: Save & Embed
-
Click Save at the top right.
-
Click Close to return to the document editor. The diagram is embedded into your document.
How to Create a PERT Chart with AI Across Platforms
You can use the AI across different parts of the Visual Paradigm ecosystem:
In Visual Paradigm Desktop:
-
Go to the Tools menu and select AI Diagram.
-
Select PERT Chart as your diagram type.
-
Enter a descriptive prompt (e.g., “Generate a PERT chart for a 3-month website development project with planning, design, and testing phases”) and click OK.
In OpenDocs (Web-based):
-
Open an OpenDocs page and click Insert > Diagrams > PERT Chart.
-
In the editor, click Create with AI at the top right.
-
Describe your project and click Generate.
Via AI Chatbot:
-
Access the AI Chatbot and type a conversational request like, “Create a PERT chart for launching a mobile app, showing dependencies and the critical path”.
-
The AI will interactively generate the chart, which you can then refine with follow-up commands like “Add a security audit task”.
Key AI-Powered Capabilities
-
Automated Calculations: The AI performs forward and backward passes to determine the earliest/latest start and finish times for every activity.
-
Critical Path Identification: It automatically highlights the sequence of tasks that determines the minimum project duration.
-
Three-Point Estimates: You can provide optimistic (O), most likely (M), and pessimistic (P) times in your text prompt, and the AI will calculate the expected durations automatically.
-
Dynamic Updating: If you manually change a task duration in the editor, the AI-driven engine recalculates the entire schedule and critical path in real-time.
Try it!
Finding an online PERT Chart tool? Just click the Draw button below to create your PERT Chart online. It’s simple and intuitive. You can also go through this PERT Chart tutorial to learn about PERT Chart before you get started.
Conclusion
PERT charts have stood the test of time because they solve a fundamental challenge: making complex project timelines visible, understandable, and actionable. What once required meticulous manual calculation and diagramming can now be accelerated dramatically with AI-powered tools—without sacrificing precision or control.
Through our step-by-step case study, you’ve seen how to:
-
Break down a real-world project (website launch) into PERT-ready tasks
-
Map dependencies and identify the critical path manually
-
Leverage AI to generate, refine, and embed professional PERT charts in seconds
-
Use enhanced features like swimlanes and task integration for team collaboration
Whether you’re a seasoned project manager or just starting your journey in project planning, mastering PERT charts—especially with AI assistance—gives you a powerful edge. You can anticipate bottlenecks, allocate resources wisely, communicate timelines clearly to stakeholders, and adapt dynamically as projects evolve.
The future of project management isn’t just about working harder—it’s about working smarter with tools that amplify your expertise. Start small: pick an upcoming project, draft a simple PERT chart, and experience the clarity it brings. Then, explore AI generation to scale your planning capabilities. Your next successful project delivery might just begin with a single, well-placed node on a PERT diagram.
References
-
A Complete Comprehensive Guide to Visual Paradigm’s AI-Powered PERT Chart Generator: An in-depth walkthrough of Visual Paradigm’s AI capabilities for generating PERT charts, including prompt engineering tips, feature comparisons, and practical use cases for project managers and analysts.
-
Create PERT Charts in Seconds with AI: Official Visual Paradigm article demonstrating how AI accelerates PERT chart creation, with step-by-step screenshots, sample prompts, and integration guidance for OpenDocs and Desktop editions.
-
Enhanced PERT Chart Features: Product documentation detailing Visual Paradigm’s advanced PERT functionalities, including swimlanes, Tasifier integration, automated task assignment, and critical path visualization.
-
Enhanced PERT Chart Features: Duplicate reference to Visual Paradigm’s official feature page for Enhanced PERT Charts, highlighting enterprise-grade project management capabilities.
-
Visual Paradigm UML Diagram Generator: Chinese-language technical blog post covering Visual Paradigm’s AI diagram generation suite, including PERT, ERD, DFD, and SysML support with natural language prompting.
-
AI PERT Chart Generator in OpenDocs: Official release announcement for AI-powered PERT chart support in OpenDocs, featuring workflow screenshots, edition requirements, and embedding capabilities.
-
AI Diagram Generator Release Notes: Comprehensive update log for Visual Paradigm’s AI diagram generation engine, covering supported diagram types, prompt best practices, and cross-platform availability.
-
Create PERT Charts in Seconds with AI: Duplicate reference to Visual Paradigm’s educational content on AI-assisted PERT chart creation, emphasizing time savings and accuracy improvements.
-
A Complete Comprehensive Guide to Visual Paradigm’s AI-Powered PERT Chart Generator: Duplicate reference to Archimetric’s detailed guide on leveraging Visual Paradigm’s AI for PERT chart automation and project planning optimization.
