


Designing software that withstands failure is a critical responsibility for any engineering team. Resilience is not just a feature; it is the backbone of modern distributed systems. To achieve this, we must look beyond static architecture and examine the dynamic interactions between components. Sequence diagrams provide a powerful lens for this analysis. By mapping out the flow of messages and data, we can identify weak points before they become production incidents. This guide explores how to use sequence diagram analysis to build robust, fault-tolerant systems.
1. The Foundation of Sequence Diagrams in Architecture 🧩
Before diving into resilience, we must understand the tool itself. A sequence diagram is a visual representation of interactions between objects or components over time. It shows the order of messages, the actors involved, and the timing of events. In the context of resilient system design, these diagrams serve as a blueprint for behavior under stress.
When analyzing a system, we do not just look for happy paths. We look for the edges. The happy path is the scenario where everything works perfectly. The unhappy path is where network latency occurs, services crash, or data is corrupted. Sequence diagrams allow us to visualize both paths simultaneously. This duality is essential for comprehensive system design.
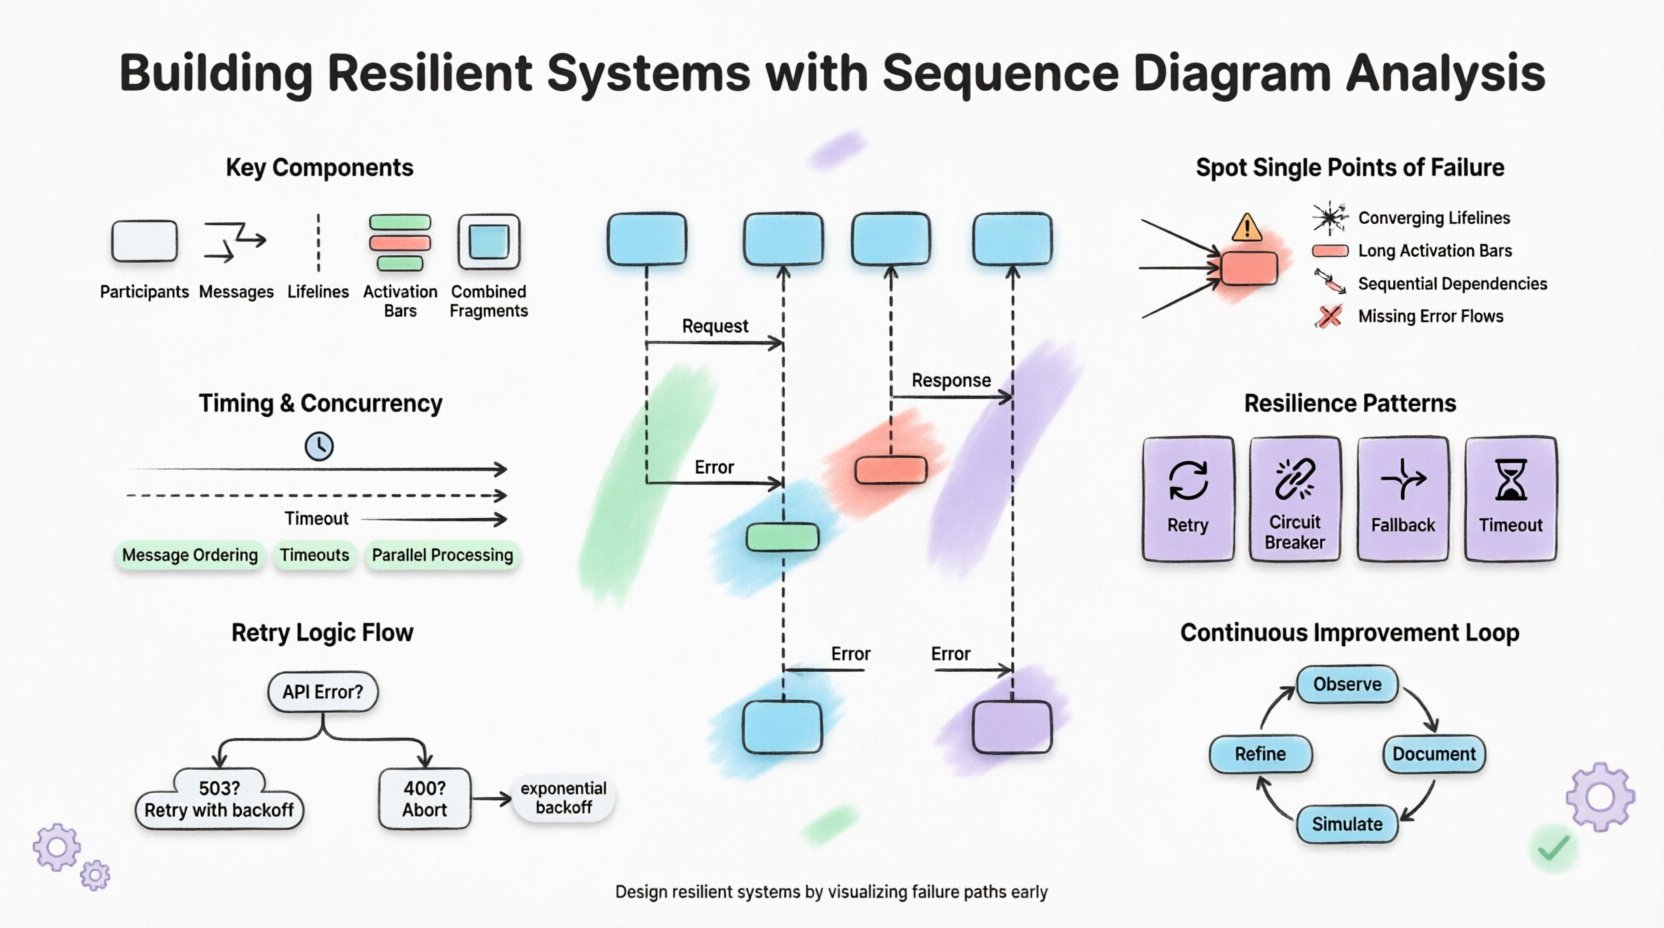
Key Components to Model
- Participants: Represent the services, databases, or external APIs involved in the process.
- Messages: Show the request and response flow between participants.
- Lifelines: Indicate the existence of an object over a period of time.
- Activation Bars: Show when an object is performing an action.
- Combined Fragments: Allow for the depiction of loops, alternatives, and optional sections.
By rigorously defining these elements, we create a contract of behavior. This contract becomes the basis for testing and validation. If the implementation does not match the sequence diagram, there is a gap in the design. This gap is often where failures originate.
2. Identifying Single Points of Failure 🔍
One of the primary goals of sequence diagram analysis is to uncover single points of failure. A single point of failure is a component whose failure brings down the entire system. In a sequence diagram, these often appear as a critical path where every message must pass through a specific node.
Consider a typical order processing flow. If every order must pass through a specific validation service before reaching the payment gateway, that validation service becomes a bottleneck. If it goes down, the entire order pipeline stops. Sequence diagrams make this dependency visible immediately.
Visual Indicators of Risk
| Visual Element | Implication for Resilience | Example |
|---|---|---|
| Converging Lifelines | Multiple flows rely on one component | Order, Payment, and Notification all hit one Auth Service |
| Long Activation Bars | Component is busy for extended periods | Blocking call during a synchronous request |
| Sequential Dependencies | Failure in step A blocks step B | Step 1 must complete before Step 2 starts |
| Missing Error Flows | No handling for failure scenarios | Only success return messages shown |
To mitigate these risks, we must redesign the sequence. This might involve introducing redundancy or changing the flow to be asynchronous. The goal is to ensure that the failure of one component does not cascade into a total system outage.
3. Analyzing Concurrency and Timing Constraints ⏱️
Resilience is also about time. Systems often fail not because of logic errors, but because of timing issues. Race conditions, timeouts, and deadlock scenarios are difficult to spot in code but are clear in sequence diagrams. When multiple components act simultaneously, the order of operations matters.
For example, imagine a user updating their profile while simultaneously requesting a login session. If the sequence diagram does not account for the timing of these concurrent requests, the system might process an outdated version of the data. This leads to data inconsistency, a common source of resilience issues.
Timing Analysis Techniques
- Message Ordering: Ensure that dependent messages are sent in the correct sequence.
- Timeout Durations: Specify how long a component waits for a response before aborting.
- Parallel Processing: Use combined fragments to show independent operations that run at the same time.
- State Synchronization: Verify that state updates happen before dependent actions occur.
By annotating the diagram with time constraints, we force the team to consider latency. This is crucial for systems that rely on real-time data. If a service expects a response within 500 milliseconds, the sequence diagram should reflect that expectation. If the downstream service cannot meet this, the diagram highlights a potential failure mode.
4. Embedding Resilience Patterns Directly 🔄
Resilience patterns are proven solutions to common architectural problems. Examples include circuit breakers, bulkheads, and retry logic. Instead of adding these patterns as an afterthought, we can embed them directly into the sequence diagram. This ensures that the design team understands how these patterns interact with the rest of the system.
Common Patterns in Flow
- Retry Mechanisms: Show a loop where a message is resent after a failure.
- Timeouts: Indicate a vertical dashed line where the message stops waiting.
- Fallbacks: Show an alternative path taken when the primary service fails.
- Circuit Breakers: Represent a state where the system stops sending requests to a failing service.
When modeling these patterns, clarity is key. We should use distinct notations for failure and recovery. For instance, a broken arrow can indicate a failed message. A dashed arrow can indicate a retry. This visual language allows stakeholders to quickly grasp the failure handling strategy.
| Pattern | Diagram Representation | Benefit |
|---|---|---|
| Retry | Loop Fragment with Condition | Prevents transient failures from causing errors |
| Circuit Breaker | Conditional Message (Open State) | Prevents cascading failures to downstream services |
| Fallback | Alternative Fragment (Alt) | Provides a degraded but functional experience |
| Timeout | Combined Fragment with Time Limit | Prevents resources from being held indefinitely |
By visualizing these patterns, we move from abstract theory to concrete design. Developers can see exactly where the retry logic happens and what triggers the fallback. This reduces ambiguity during implementation.
5. Handling Timeouts and Retries Effectively ⏳
Networks are unreliable. Services go down. Latency spikes. A resilient system must handle these realities gracefully. Sequence diagrams are the best place to define the rules for timeouts and retries. Without these definitions, developers make assumptions that vary from person to person.
Consider an external API integration. If the API returns a 503 Service Unavailable error, should the system retry immediately? Should it wait? How many times? These questions must be answered in the design phase. The sequence diagram provides the canvas for these decisions.
Defining Retry Logic
- Exponential Backoff: The wait time increases with each retry attempt.
- Maximum Retries: A hard limit on how many times a request is retried.
- Error Classification: Distinguishing between transient errors (retryable) and permanent errors (do not retry).
- Dead Letter Queues: Moving failed messages to a separate storage for analysis.
When documenting this in a diagram, we should specify the conditions for each branch. For example, “If response is 500, retry up to 3 times with backoff. If response is 400, abort.” This level of detail ensures that the code matches the design intent.
It is also important to consider the impact of retries on the system. Excessive retries can overwhelm the very service that is struggling. This is known as the thundering herd problem. Sequence diagrams help visualize this load. By showing multiple concurrent requests retrying, we can see the potential for resource exhaustion.
6. Cross-System Communication and Boundaries 🌐
Modern systems are distributed. They span multiple environments, clouds, or data centers. Communication between these boundaries introduces complexity. Network partitions, DNS failures, and firewall rules can all disrupt the flow. Sequence diagrams help map these boundaries clearly.
When drawing a sequence diagram for a distributed system, we should visually separate different domains. This can be done using partitioned frames or distinct background colors. This separation highlights where trust boundaries exist and where encryption is required.
Security and Resilience
- Authentication Flows: Ensure tokens are passed securely between services.
- Encryption: Indicate where data is encrypted in transit.
- Rate Limiting: Show where requests are throttled to prevent abuse.
- Input Validation: Confirm that data is checked before processing.
By including these security elements in the sequence diagram, we ensure that resilience is not just about availability, but also about integrity and confidentiality. A system that is available but compromised is not resilient.
7. Collaboration and Documentation Standards 🤝
A sequence diagram is a communication tool. It bridges the gap between architects, developers, and testers. For it to be effective, it must follow consistent standards. This ensures that everyone interprets the diagram the same way.
Best Practices for Maintenance
- Version Control: Treat diagrams as code. Store them in version control systems.
- Review Process: Include diagrams in code review and design review meetings.
- Living Documents: Update diagrams when the system changes. Outdated diagrams are dangerous.
- Automated Validation: Use tools to check that the implementation matches the diagram.
When a diagram becomes outdated, it loses its value. It can mislead developers into thinking a feature works when it does not. To prevent this, we must integrate diagram updates into the deployment pipeline. If the code changes, the diagram must change. This creates a culture of accuracy and reliability.
8. Iterative Refinement and Maintenance 🔄
System design is never finished. As we learn more about how the system behaves, we refine the diagrams. This iterative process is vital for long-term resilience. We cannot predict every failure mode, but we can improve our understanding over time.
After a production incident, we should review the sequence diagrams. Did the diagram reflect what actually happened? If not, why? This post-mortem analysis helps us improve our modeling skills. It helps us identify gaps in our understanding of the system.
Continuous Improvement Loop
- Observe: Monitor system behavior in production.
- Document: Update diagrams to reflect observed behavior.
- Simulate: Use chaos engineering to test the scenarios in the diagram.
- Refine: Adjust the design based on simulation results.
By treating the sequence diagram as a living artifact, we ensure that it remains a true representation of the system. This allows us to catch issues early. It allows us to plan for failure. And ultimately, it allows us to build systems that endure.
Final Thoughts on System Design 🏁
Building resilient systems requires discipline. It requires us to think about failure before it happens. Sequence diagram analysis provides the structure we need to do this. It forces us to look at the details. It forces us to consider the edges.
By using these diagrams effectively, we can reduce risk. We can improve reliability. We can create software that users can trust. This is not about magic or shortcuts. It is about rigorous analysis and clear communication. When we get the sequence right, the system follows.

