

Introduction
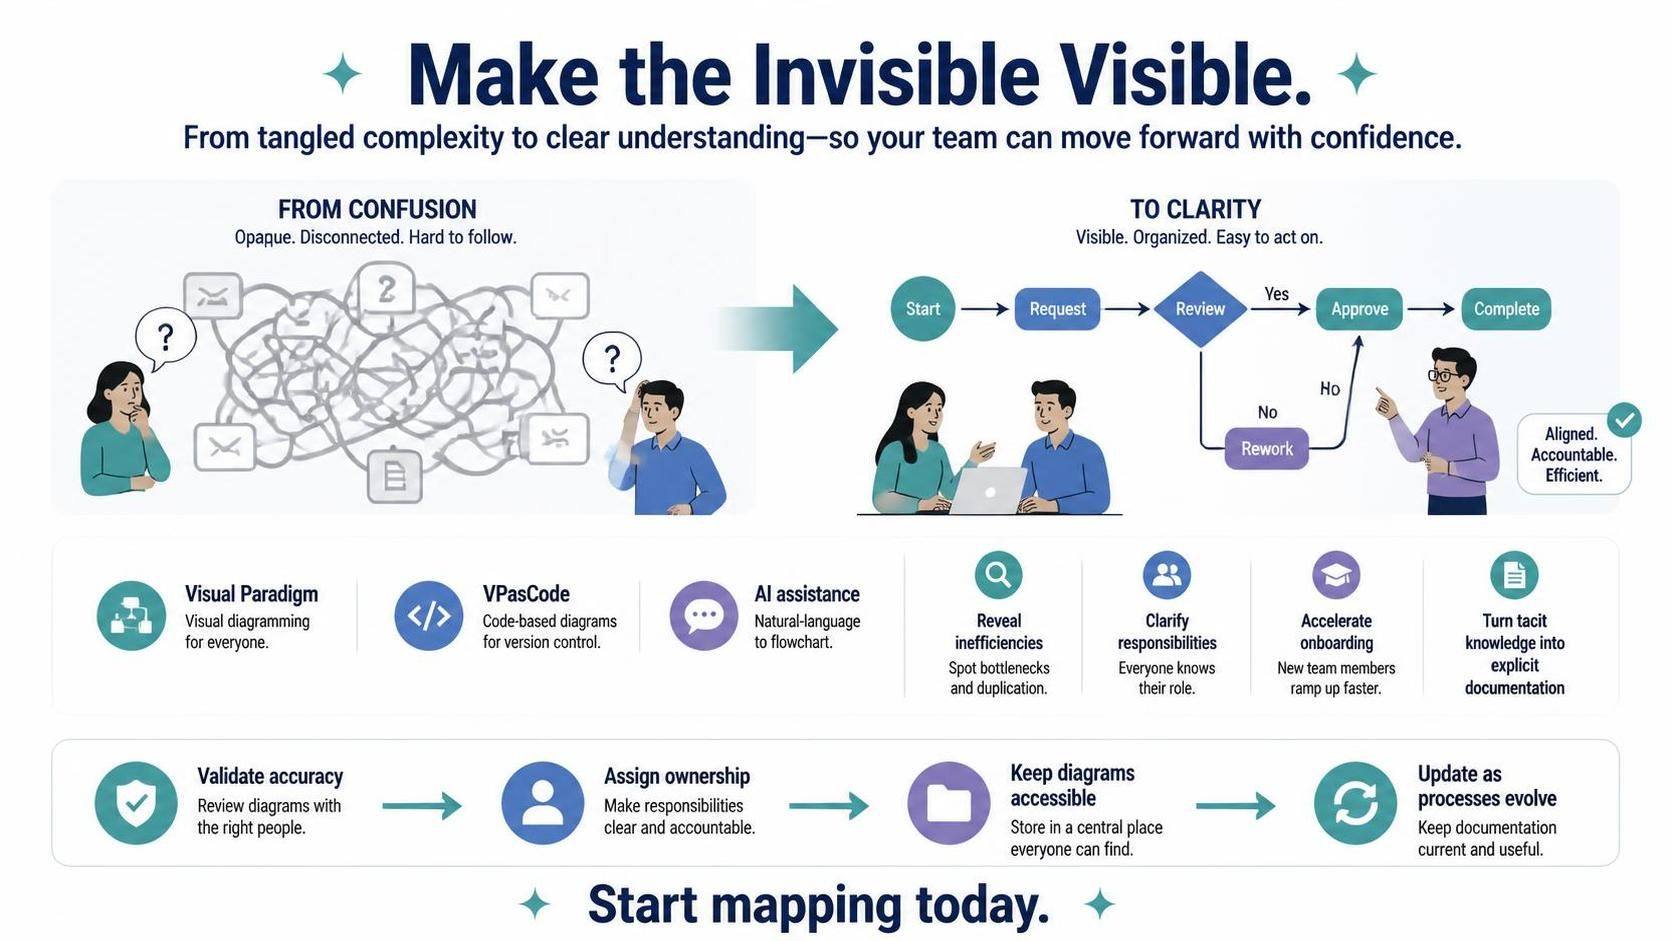
In an era where complexity is the default state of business operations, the ability to visualize workflows is not just a nice-to-have—it’s a competitive advantage. From debugging CI/CD pipelines to mapping customer onboarding journeys, flowcharts serve as the universal language that bridges technical teams, stakeholders, and end-users. They transform abstract processes into tangible, actionable maps that reveal bottlenecks, eliminate waste, and standardize operations.
While the fundamental principles of flowcharting have remained consistent for decades, the tools we use to create them have evolved dramatically. This guide explores how to leverage modern tooling—specifically Visual Paradigm Flowchart combined with VPasCode and AI-assisted generation—to create professional, maintainable, and collaborative process diagrams. We’ll cover industry-standard best practices, provide ready-to-use PlantUML examples, and demonstrate how AI can accelerate your diagramming workflow while maintaining precision and clarity.
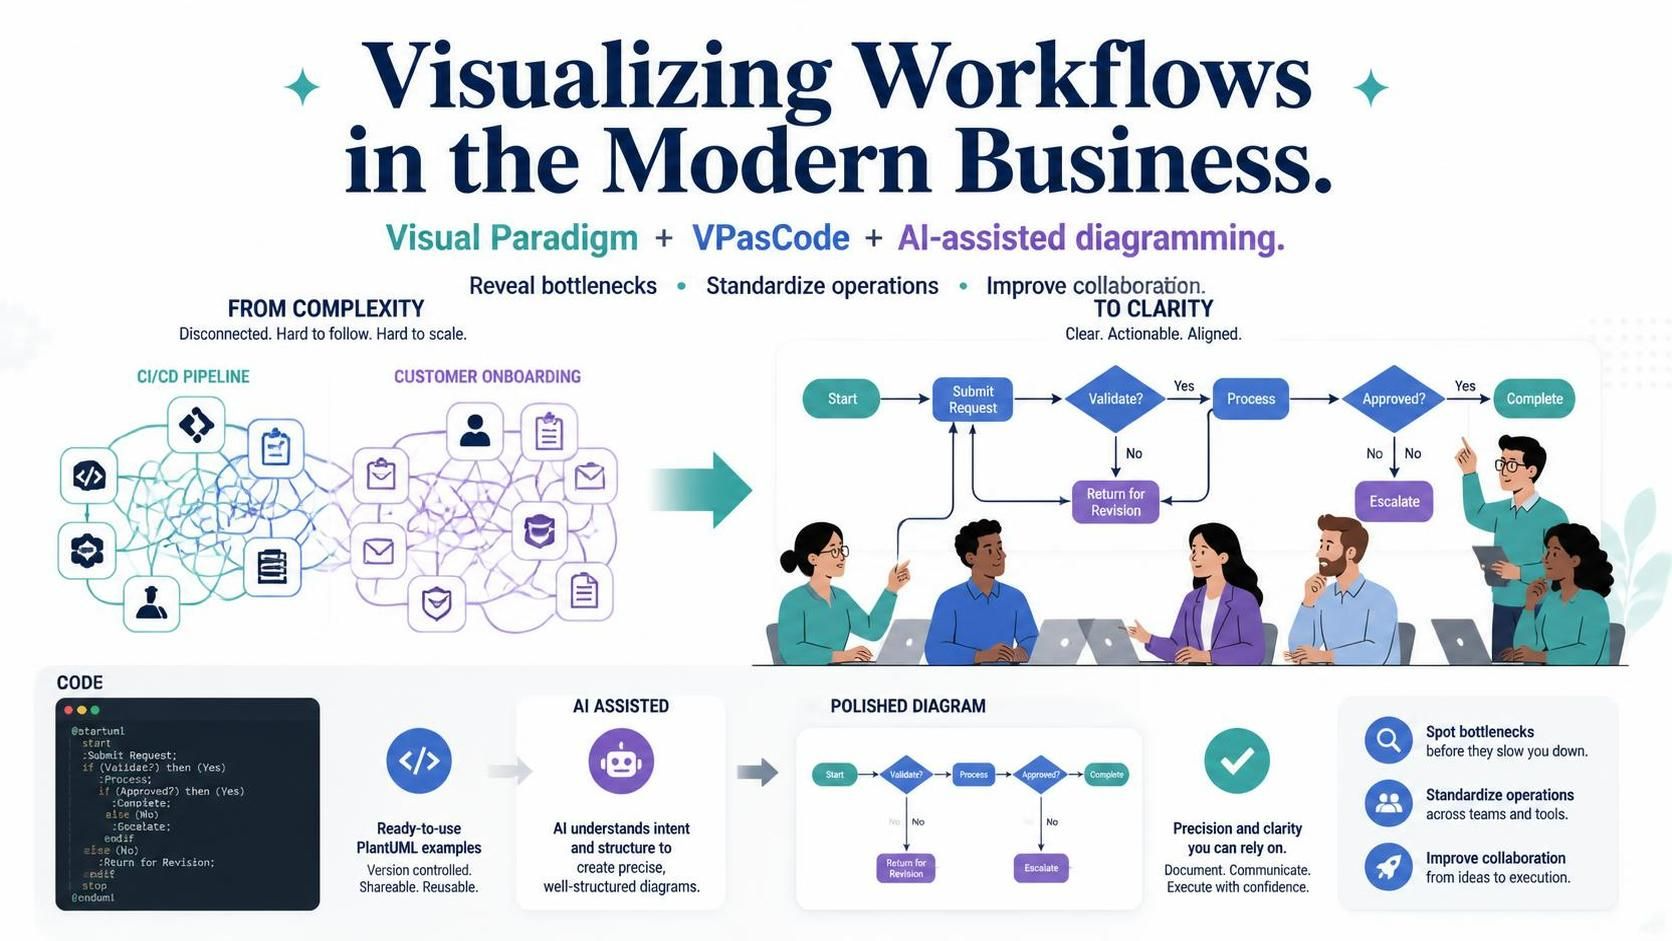
Whether you’re a product manager documenting user flows, a DevOps engineer mapping deployment pipelines, or an operations leader optimizing supply chains, this guide will equip you with the knowledge and tools to turn chaotic workflows into clear, visual logic.
Key Concepts: The Foundation of Effective Flowcharts
Standard Symbols and Their Meanings
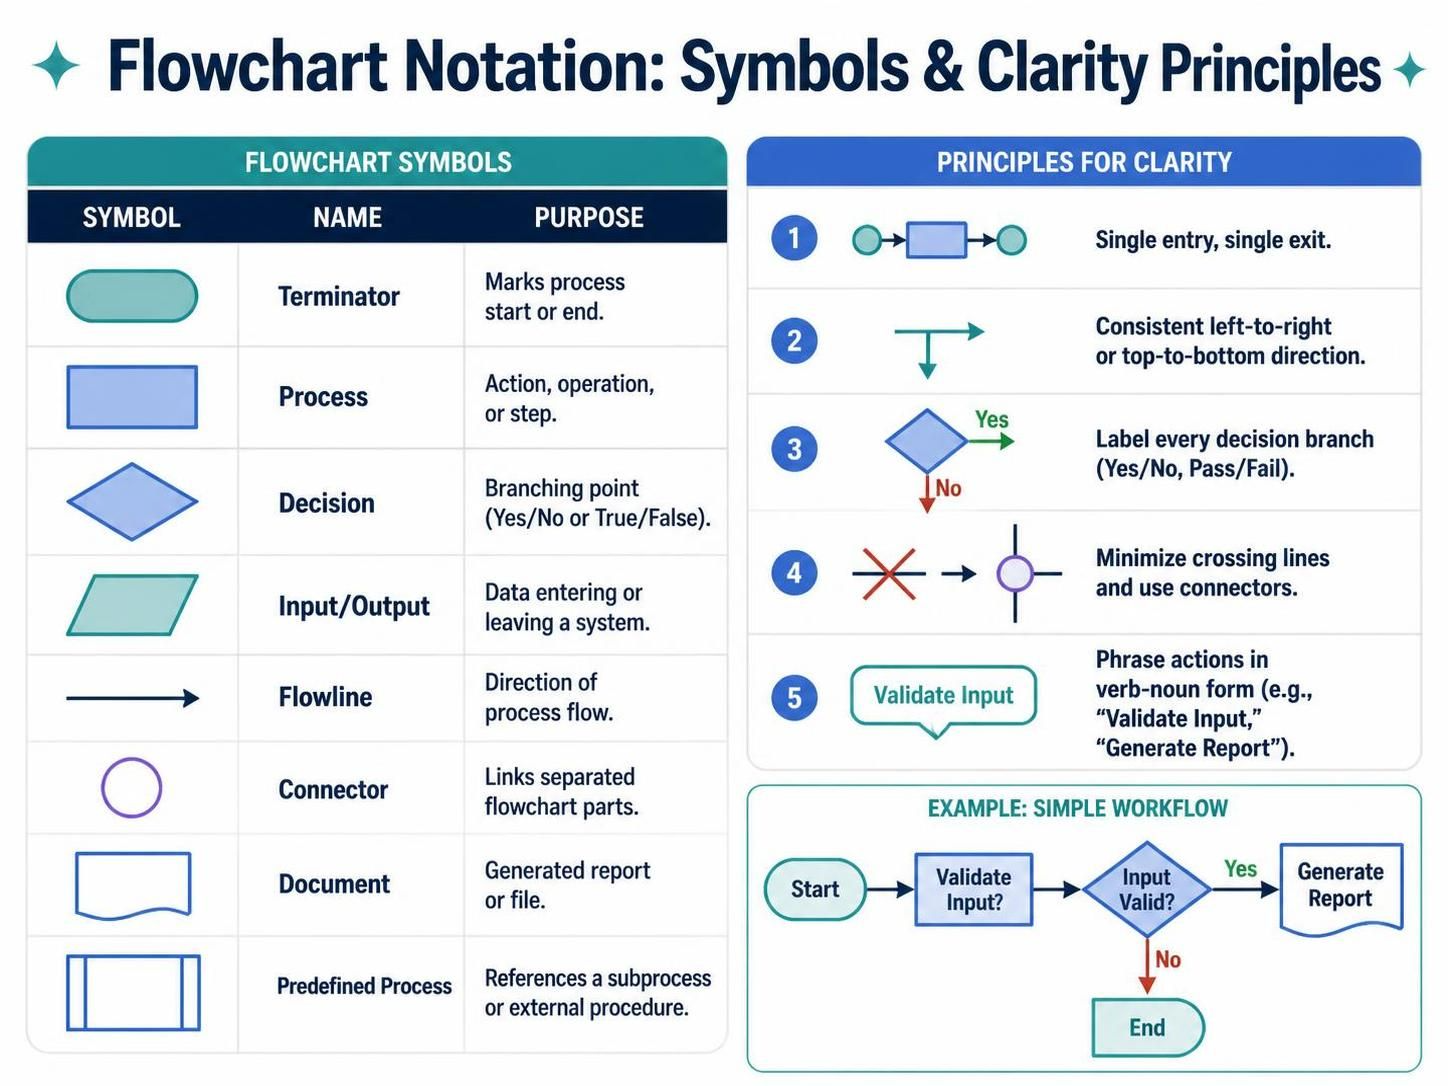
Before diving into tools, it’s essential to understand the universal language of flowcharts. Consistency in symbol usage ensures your diagrams are immediately understandable across teams and organizations.
| Symbol | Name | Purpose |
|---|---|---|
| Oval | Terminator | Marks the start or end of a process |
| Rectangle | Process | Represents an action, operation, or step |
| Diamond | Decision | Indicates a branching point (Yes/No, True/False) |
| Parallelogram | Input/Output | Shows data entering or leaving the system |
| Arrow | Flowline | Indicates direction of process flow |
| Circle | Connector | Links separated parts of a flowchart |
| Document | Document | Represents generated reports or files |
| Rectangle with double lines | Predefined Process | References a sub-process or external procedure |
Core Principles for Clarity
-
Single Entry, Single Exit: Each process block should have one entry point and one exit point to maintain logical flow.
-
Left-to-Right or Top-to-Bottom Flow: Maintain consistent directionality to reduce cognitive load.
-
Label Every Decision Path: Clearly mark all outgoing paths from decision diamonds (e.g., “Yes,” “No,” “Pass,” “Fail”).
-
Minimize Crossings: Avoid crossing flowlines; use connectors when necessary.
-
Verb-Noun Format: Write actions concisely (e.g., “Validate Input,” “Generate Report”).
Tooling Stack: Visual Paradigm + VPasCode + AI Assistance
Why Visual Paradigm?
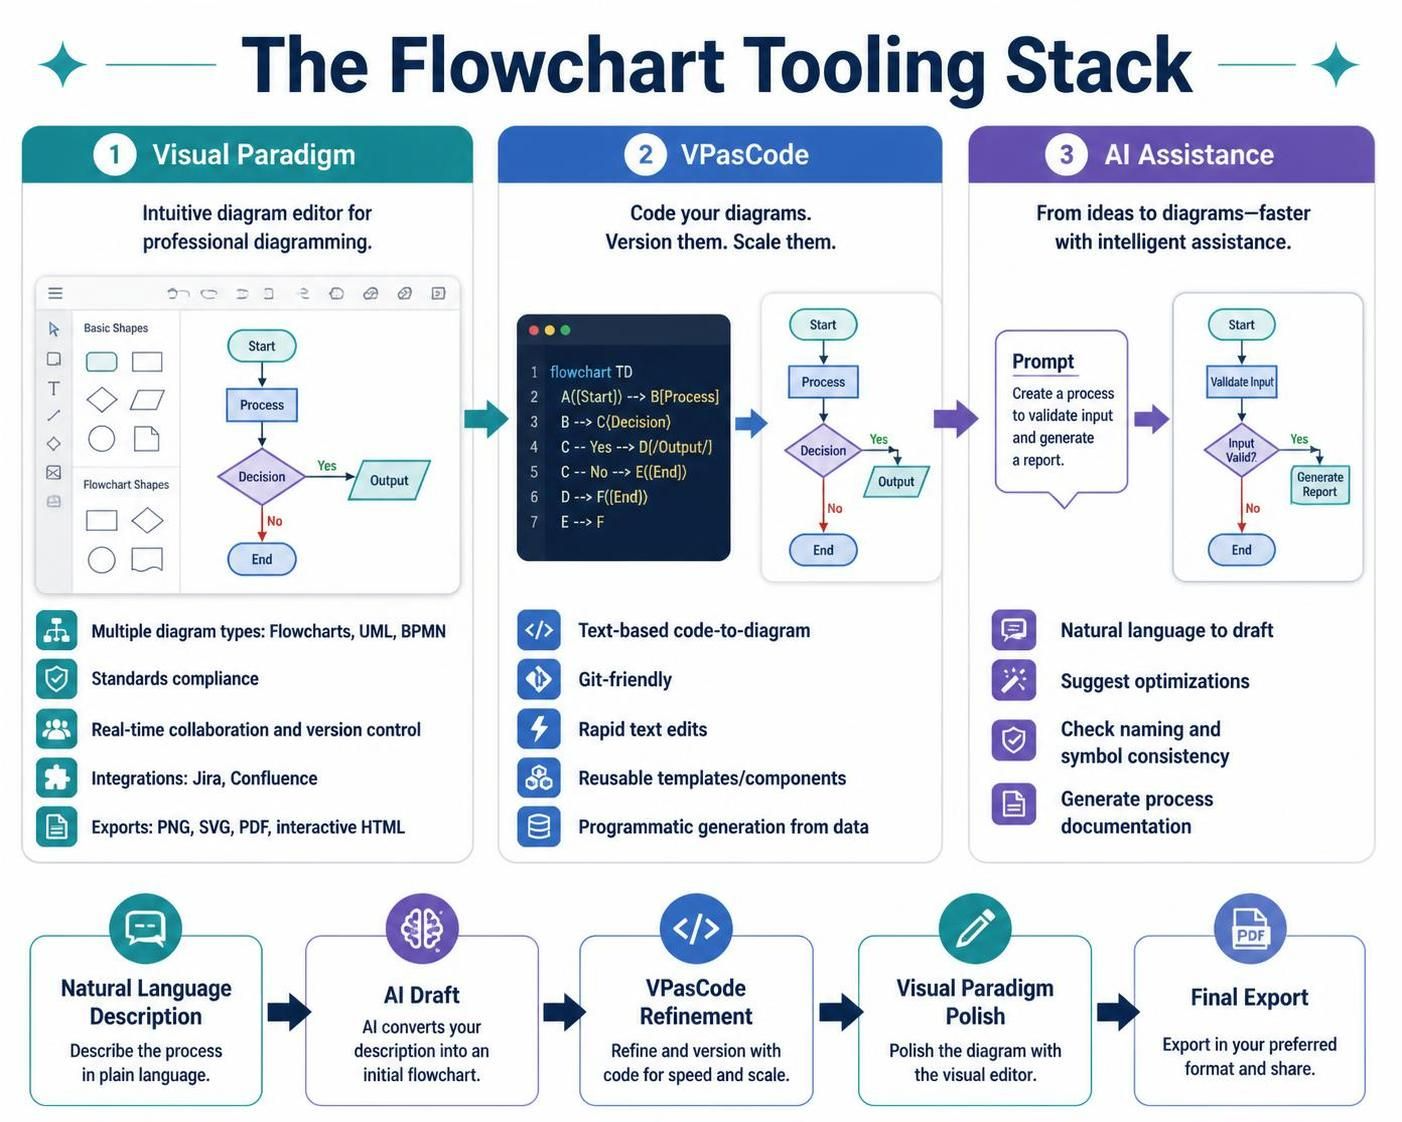
Visual Paradigm is an enterprise-grade modeling tool that supports multiple diagram types, including flowcharts, UML, BPMN, and more. Its key advantages include:
-
Standards Compliance: Adheres to ISO and industry-standard symbols
-
Collaboration Features: Real-time team editing and version control
-
Integration Capabilities: Connects with Jira, Confluence, and other productivity tools
-
Export Options: Generates high-quality PNG, SVG, PDF, and interactive HTML outputs
VPasCode: Code-Based Diagramming
VPasCode is Visual Paradigm’s code-to-diagram engine that allows you to define flowcharts using text-based syntax (similar to PlantUML). This approach offers several benefits:
-
Version Control Friendly: Store diagrams as code in Git repositories
-
Rapid Iteration: Make changes by editing text rather than dragging shapes
-
Reusability: Create templates and reuse components across projects
-
Automation: Generate diagrams programmatically from data sources
AI-Assisted Generation
Modern AI tools can accelerate flowchart creation by:
-
Natural Language to Diagram: Convert process descriptions into initial draft flowcharts
-
Optimization Suggestions: Identify redundant steps or missing decision points
-
Consistency Checks: Ensure adherence to naming conventions and symbol standards
-
Documentation Generation: Auto-generate accompanying process documentation
Workflow Integration:
Natural Language Description → AI Draft → VPasCode Refinement → Visual Paradigm Polish → Final Export
PlantUML Code Examples
Below are practical PlantUML examples that can be rendered in Visual Paradigm via VPasCode or any PlantUML-compatible tool.
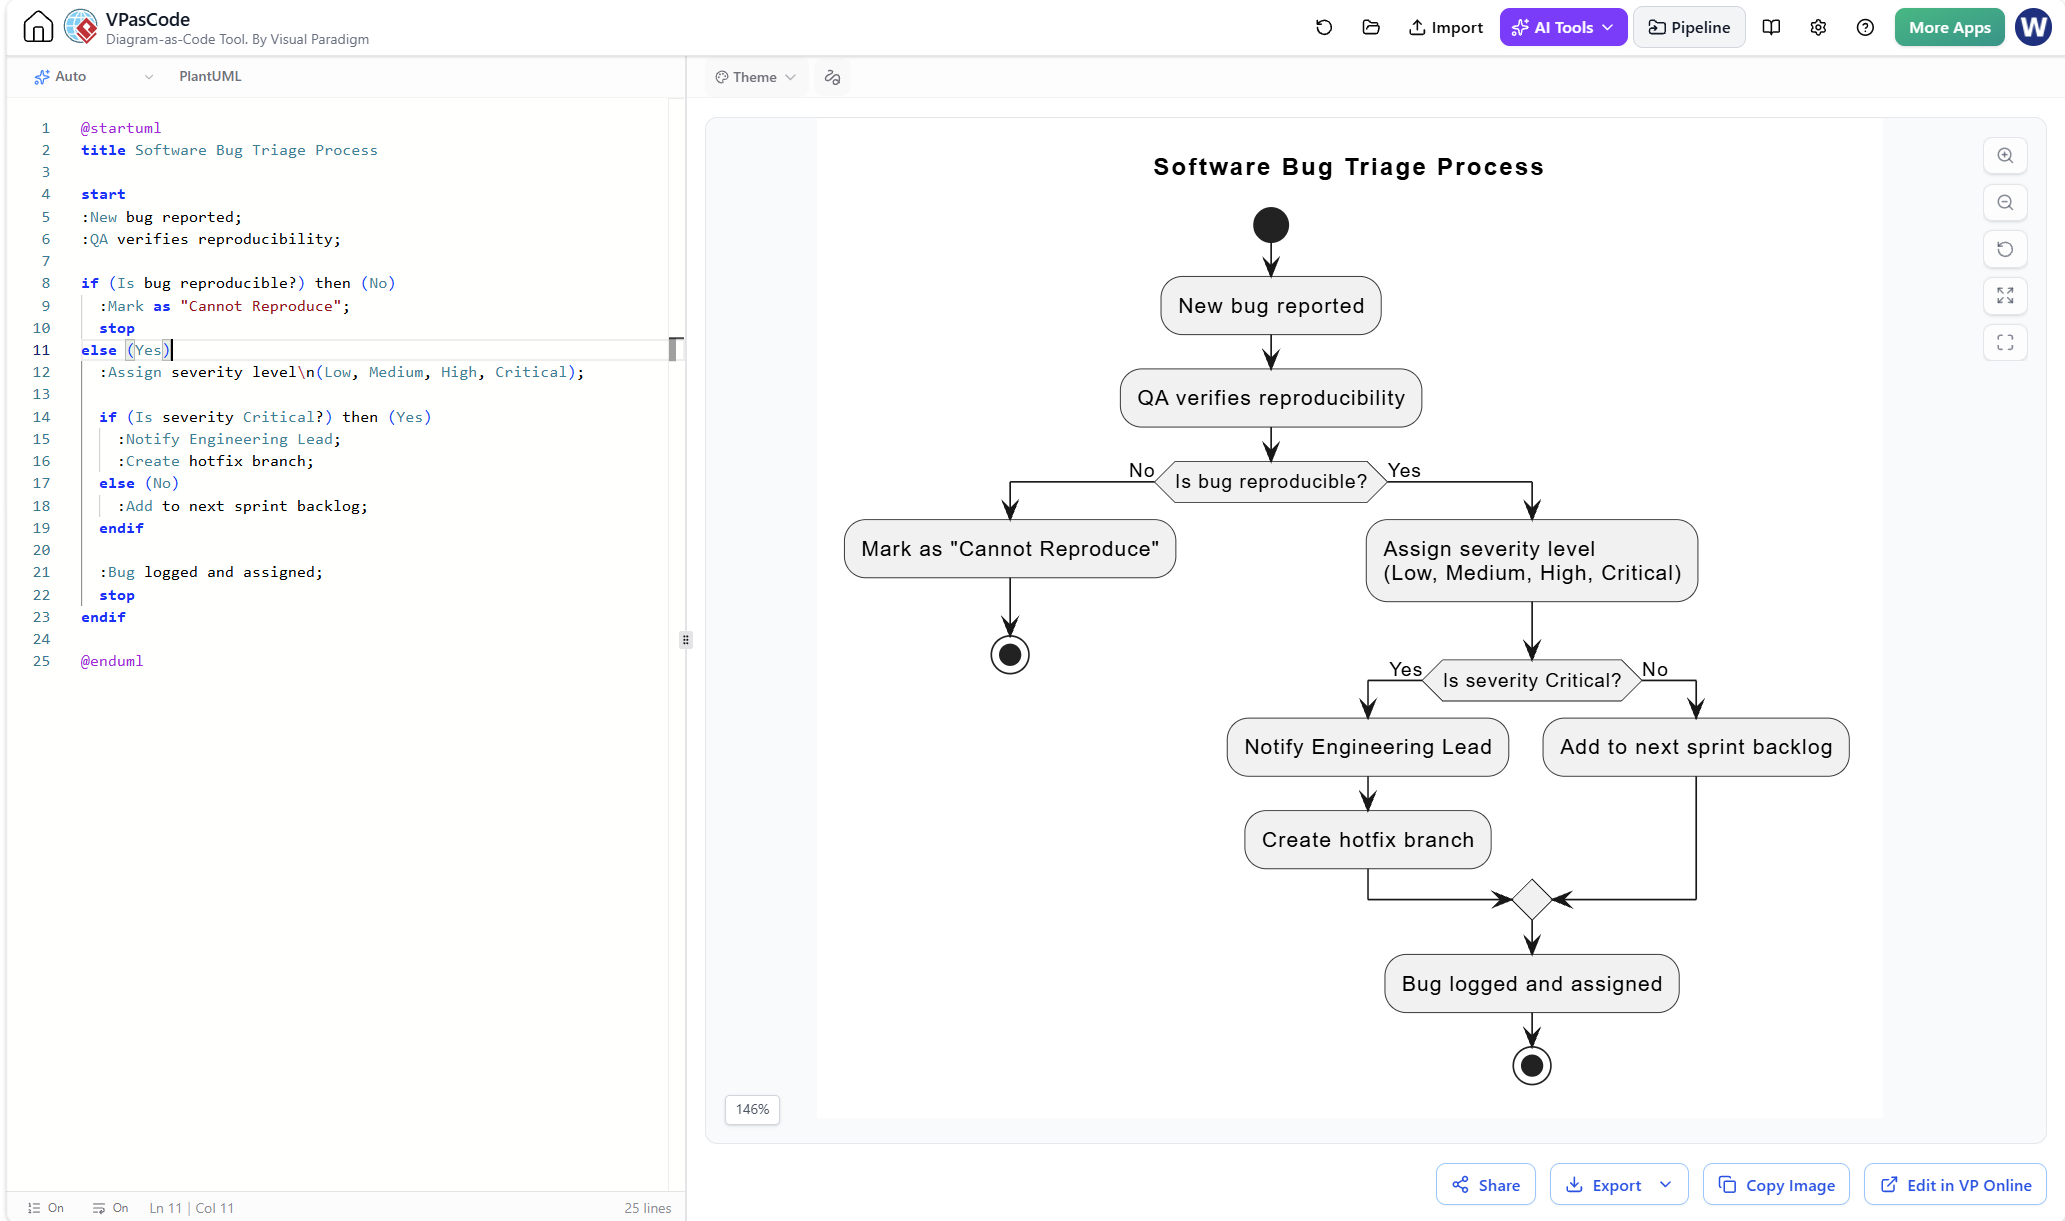
Example 1: Software Bug Triage Process
This basic flowchart maps the journey of a bug report from submission to resolution.
@startuml
title Software Bug Triage Process

start
:New bug reported;
:QA verifies reproducibility;

if (Is bug reproducible?) then (No)
  :Mark as "Cannot Reproduce";
  stop
else (Yes)
  :Assign severity level\n(Low, Medium, High, Critical);

  if (Is severity Critical?) then (Yes)
    :Notify Engineering Lead;
    :Create hotfix branch;
  else (No)
    :Add to next sprint backlog;
  endif

  :Bug logged and assigned;
  stop
endif

@enduml
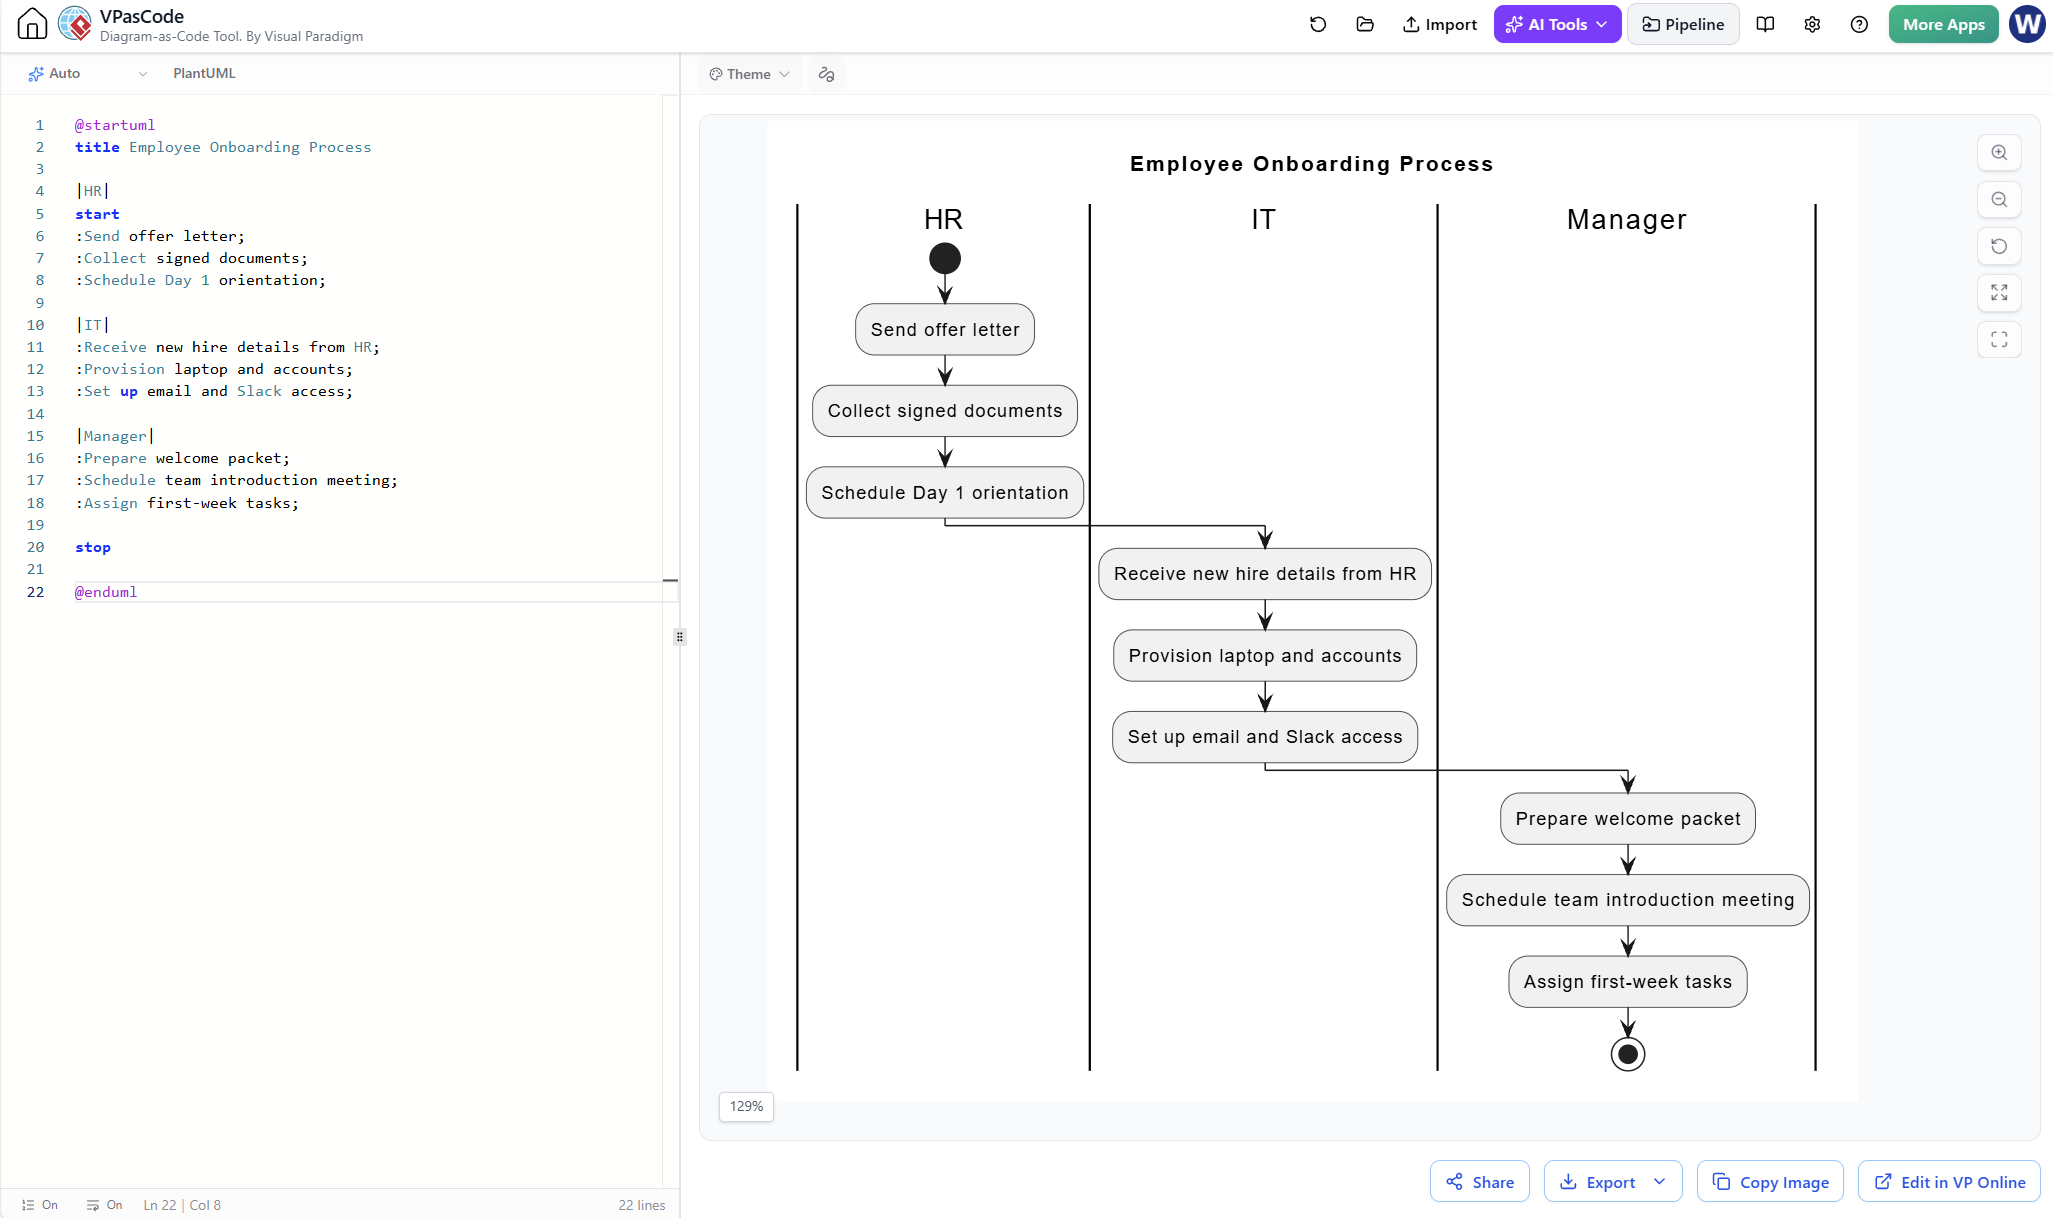
Example 2: Employee Onboarding (Swimlane Diagram)
This cross-functional flowchart shows handoffs between HR, IT, and Management during employee onboarding.
@startuml
title Employee Onboarding Process

|HR|
start
:Send offer letter;
:Collect signed documents;
:Schedule Day 1 orientation;

|IT|
:Receive new hire details from HR;
:Provision laptop and accounts;
:Set up email and Slack access;

|Manager|
:Prepare welcome packet;
:Schedule team introduction meeting;
:Assign first-week tasks;

stop

@enduml
Note: For true swimlane visualization in PlantUML, you can use the partition or package keywords, or leverage Visual Paradigm’s native swimlane features for better layout control.
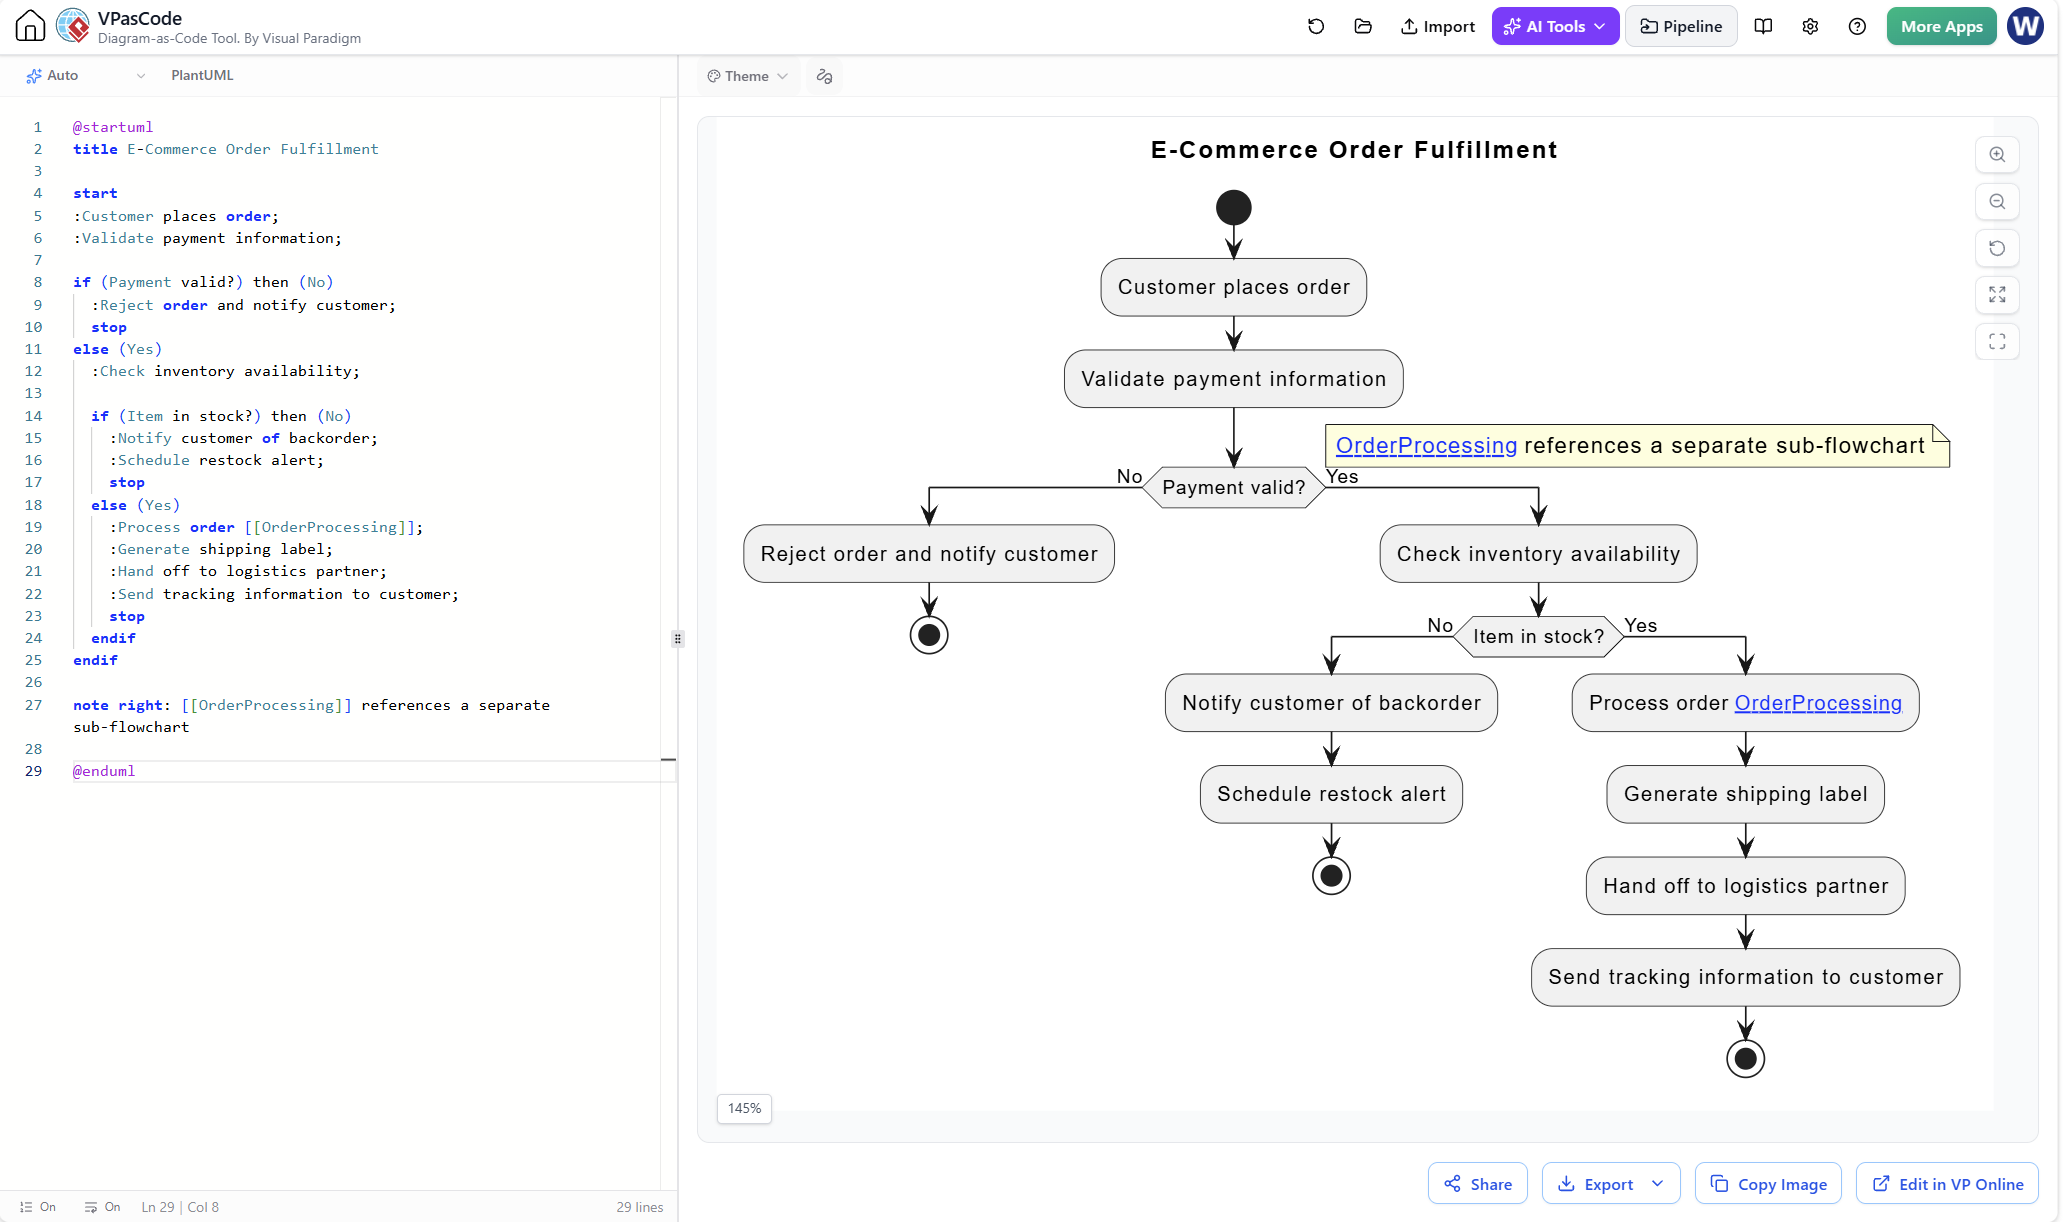
Example 3: E-Commerce Order Fulfillment with Sub-Processes
This example demonstrates how to reference sub-processes for complex workflows.
@startuml
title E-Commerce Order Fulfillment

start
:Customer places order;
:Validate payment information;

if (Payment valid?) then (No)
  :Reject order and notify customer;
  stop
else (Yes)
  :Check inventory availability;

  if (Item in stock?) then (No)
    :Notify customer of backorder;
    :Schedule restock alert;
    stop
  else (Yes)
    :Process order [[OrderProcessing]];
    :Generate shipping label;
    :Hand off to logistics partner;
    :Send tracking information to customer;
    stop
  endif
endif

note right: [[OrderProcessing]] references a separate sub-flowchart

@enduml
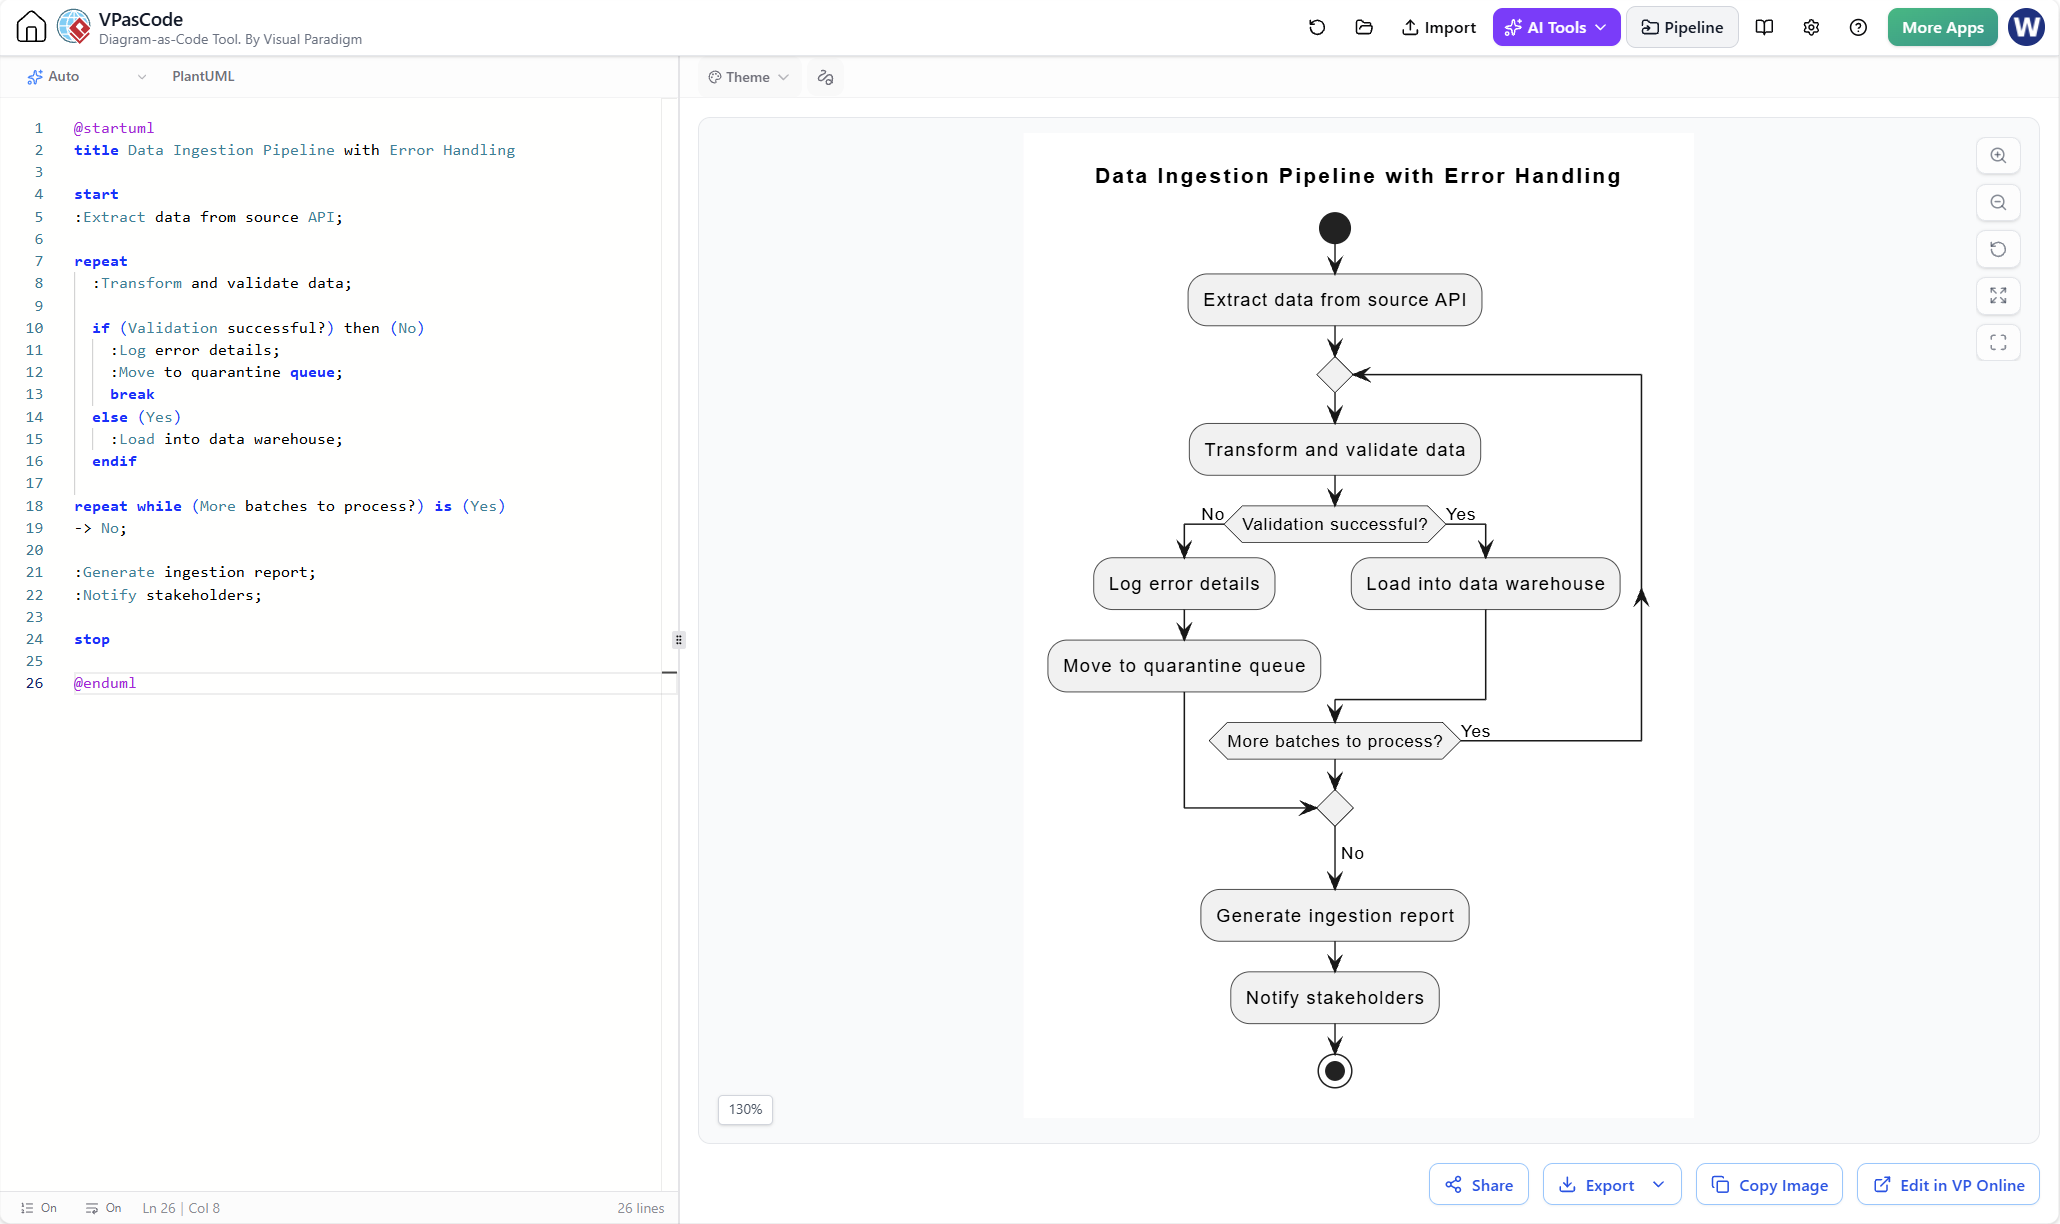
Example 4: Data Pipeline with Error Handling
This flowchart includes error paths and retry logic, common in data engineering workflows.
@startuml
title Data Ingestion Pipeline with Error Handling

start
:Extract data from source API;

repeat
  :Transform and validate data;

  if (Validation successful?) then (No)
    :Log error details;
    :Move to quarantine queue;
    break
  else (Yes)
    :Load into data warehouse;
  endif

repeat while (More batches to process?) is (Yes)
-> No;

:Generate ingestion report;
:Notify stakeholders;

stop

@enduml
Step-by-Step Guide: Creating Flowcharts with Visual Paradigm & VPasCode
Step 1: Define Scope and Audience
Before writing any code or drawing any shapes:
-
Identify boundaries: Where does the process start and end?
-
Determine detail level: High-level overview for executives or detailed steps for engineers?
-
Know your audience: Technical teams need different information than business stakeholders.
Step 2: Draft in Natural Language
Write out the process in plain English. This becomes your input for AI assistance and your reference for VPasCode.
Example:
When a user submits a support ticket:
1. System validates required fields
2. If invalid, return error message
3. If valid, assign priority based on keywords
4. Route to appropriate team queue
5. Send confirmation email to user
6. End
Step 3: Generate Initial Draft with AI
Use an AI assistant to convert your natural language description into PlantUML or VPasCode syntax. Prompt example:
“Convert the following process description into PlantUML flowchart code: [paste your description]”
Review the AI-generated code for accuracy and completeness.
Step 4: Refine with VPasCode
Import the AI-generated code into Visual Paradigm’s VPasCode editor. Make adjustments:
-
Add proper labels to decision paths
-
Insert sub-process references where needed
-
Ensure consistent naming conventions
-
Add notes or annotations for clarity
Step 5: Polish in Visual Paradigm GUI
Switch to Visual Paradigm’s graphical interface to:
-
Adjust layout for readability
-
Apply color coding (e.g., red for error paths, green for success)
-
Add title, version number, and date
-
Align symbols and optimize spacing
Step 6: Validate with Stakeholders
-
Walkthrough test: Have someone unfamiliar with the process follow the diagram
-
Peer review: Ask team members who perform the work to verify accuracy
-
Check for gaps: Ensure no dead ends or infinite loops exist
Step 7: Export and Distribute
-
Export as PNG/SVG for presentations
-
Export as PDF for documentation
-
Share interactive HTML version for web-based collaboration
-
Store VPasCode source in Git for version control
Common Types of Flowcharts and When to Use Them
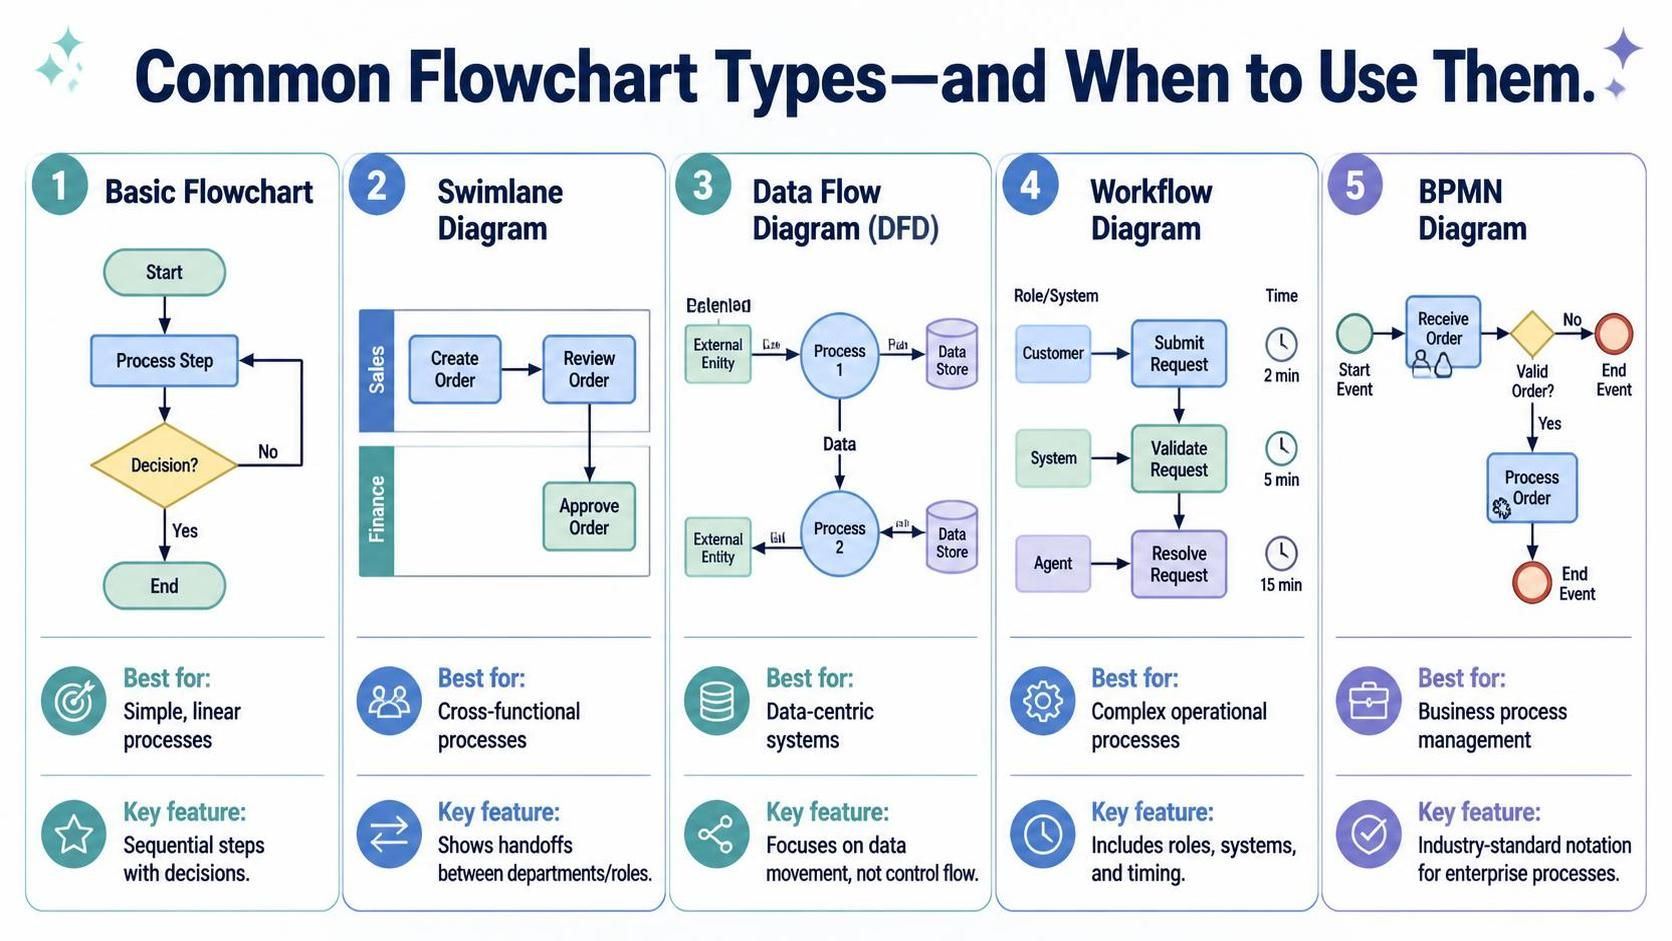
| Type | Best For | Key Feature |
|---|---|---|
| Basic Flowchart | Simple, linear processes | Sequential steps with decisions |
| Swimlane Diagram | Cross-functional processes | Shows handoffs between departments/roles |
| Data Flow Diagram (DFD) | Data-centric systems | Focuses on data movement, not control flow |
| Workflow Diagram | Complex operational processes | Includes roles, systems, and timing |
| BPMN Diagram | Business process management | Industry-standard notation for enterprise processes |
Tips for Maximum Impact
Design Best Practices
-
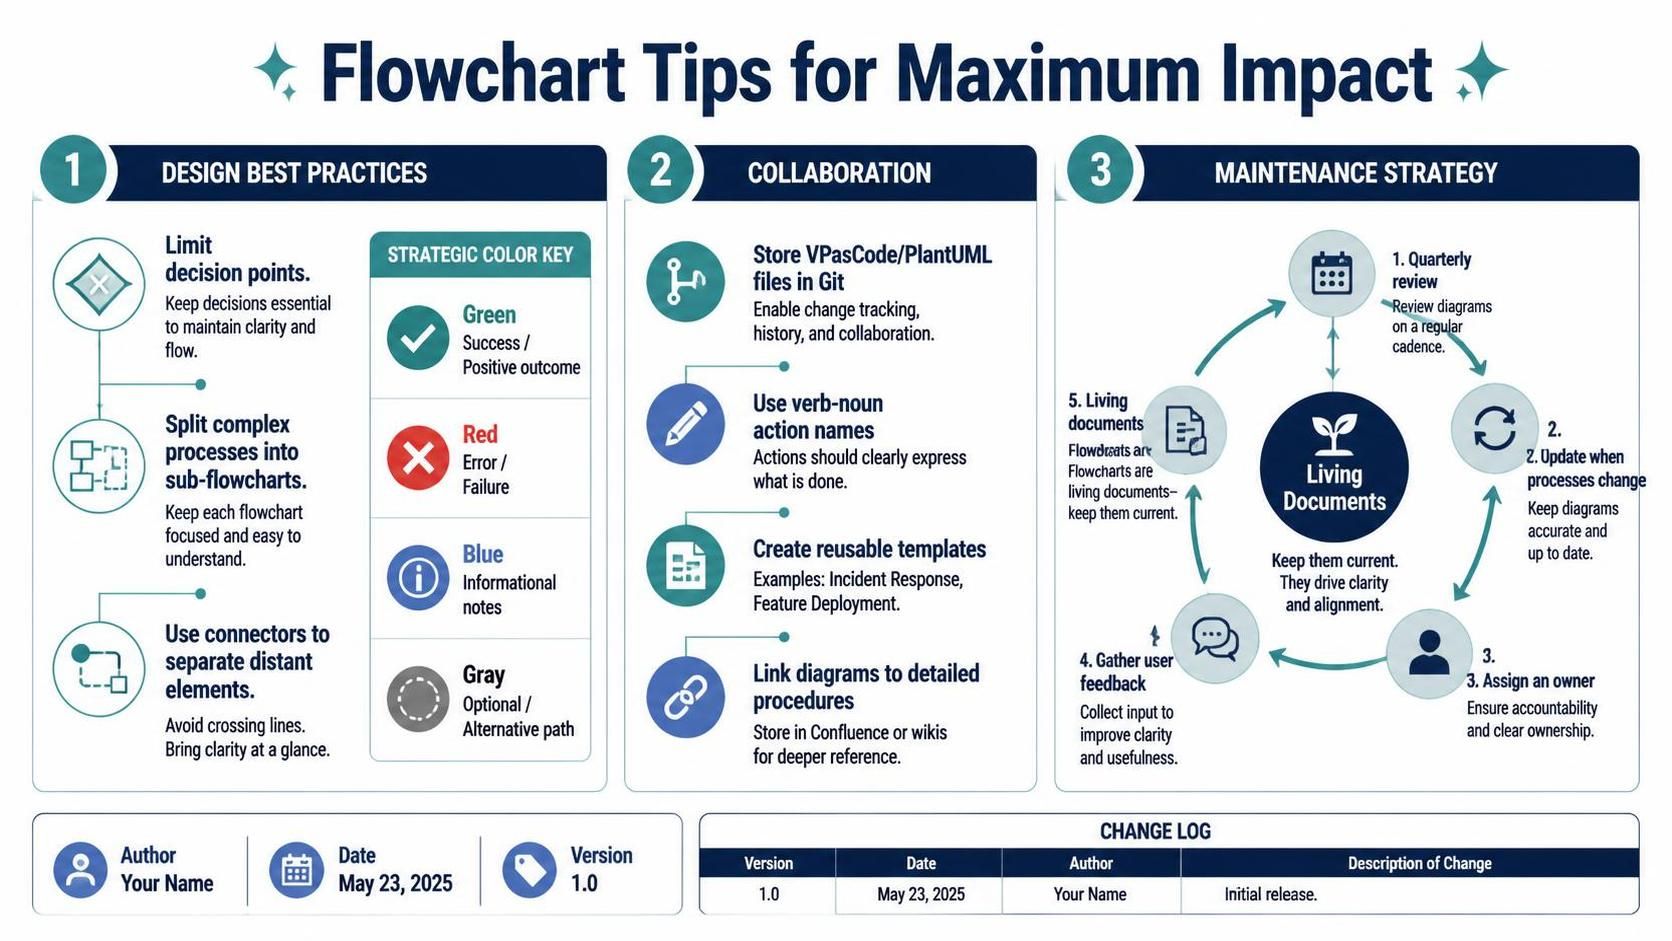
Limit Decision Points: Too many branches make diagrams hard to follow. Consider breaking complex processes into sub-flowcharts.
-
Use Color Strategically:
-
Green: Success paths
-
Red: Error/failure paths
-
Blue: Informational notes
-
Gray: Optional or alternative paths
-
-
Maintain White Space: Crowded diagrams reduce readability. Use connectors to separate distant elements.
-
Consistent Typography: Use the same font size and style throughout. Bold key decision points.
-
Include Metadata: Always add title, author, date, version, and change log.
Collaboration Tips
-
Store diagrams as code: Use VPasCode/PlantUML files in Git for easy tracking of changes
-
Establish naming conventions: Agree on verb-noun format for actions across your team
-
Create templates: Build reusable templates for common process types (e.g., incident response, feature deployment)
-
Link to documentation: Embed flowcharts in Confluence pages or wikis with links to detailed procedures
Maintenance Strategy
Flowcharts are living documents. Establish a review cadence:
-
Quarterly reviews: Verify accuracy against current processes
-
Change-triggered updates: Update diagrams whenever processes change
-
Ownership assignment: Assign a diagram owner responsible for maintenance
-
Feedback loop: Encourage users to report inaccuracies or suggest improvements
Conclusion
Flowcharts remain one of the most powerful tools for bringing clarity to complexity. By combining timeless principles with modern tooling—Visual Paradigm’s robust diagramming capabilities, VPasCode’s code-based approach, and AI-assisted generation—you can create professional, maintainable, and collaborative process maps that drive real business value.
The key to success lies not just in creating beautiful diagrams, but in using them as catalysts for conversation, improvement, and alignment. A well-crafted flowchart reveals hidden inefficiencies, clarifies responsibilities, and accelerates onboarding. It transforms tacit knowledge into explicit documentation that scales with your organization.
Remember: a flowchart is only as valuable as its accuracy and accessibility. Invest time in validation, establish clear ownership, and treat your diagrams as living artifacts that evolve with your processes. Start mapping today, and watch as the invisible becomes visible, and the complex becomes manageable.