


Business Process Model and Notation (BPMN) is the global standard for visualizing, analyzing, and optimizing business workflows. It bridges the gap between business strategy and technical implementation, allowing stakeholders from non-technical business users to complex IT architects to collaborate on process efficiency.
This guide explores the core concepts of BPMN, demonstrates practical examples, and details how modern tooling—specifically Visual Paradigm—enhances this experience with AI-powered generation and a robust modeling ecosystem.
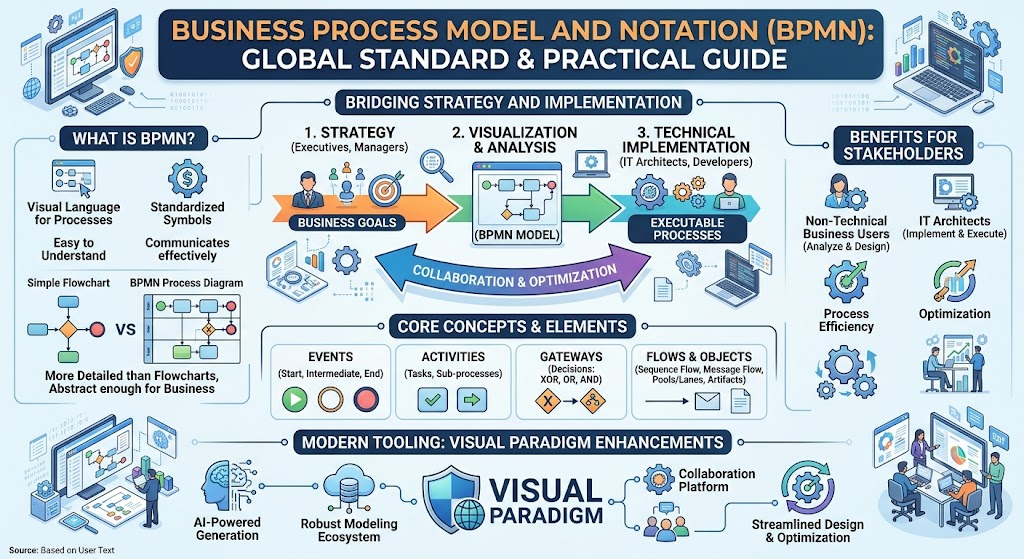
1. What is BPMN?
BPMN is a visual language used to represent business processes. It provides a standardized set of symbols that make processes easy to understand, communicate, and execute. Unlike simple flowcharts, BPMN is detailed enough to be executed by BPM engines, yet abstract enough for business users to read and understand.
Why Use BPMN?
-
Clarity: Standardized symbols reduce ambiguity, making processes understandable to both technical and non-technical stakeholders.
-
Communication: It facilitates effective dialogue between business analysts, designers, and developers.
-
Process Improvement: Visualizing processes helps identify bottlenecks, inefficiencies, and areas for automation.
-
Automation: BPMN diagrams can serve as the executable blueprint for Business Process Management (BPM) software.
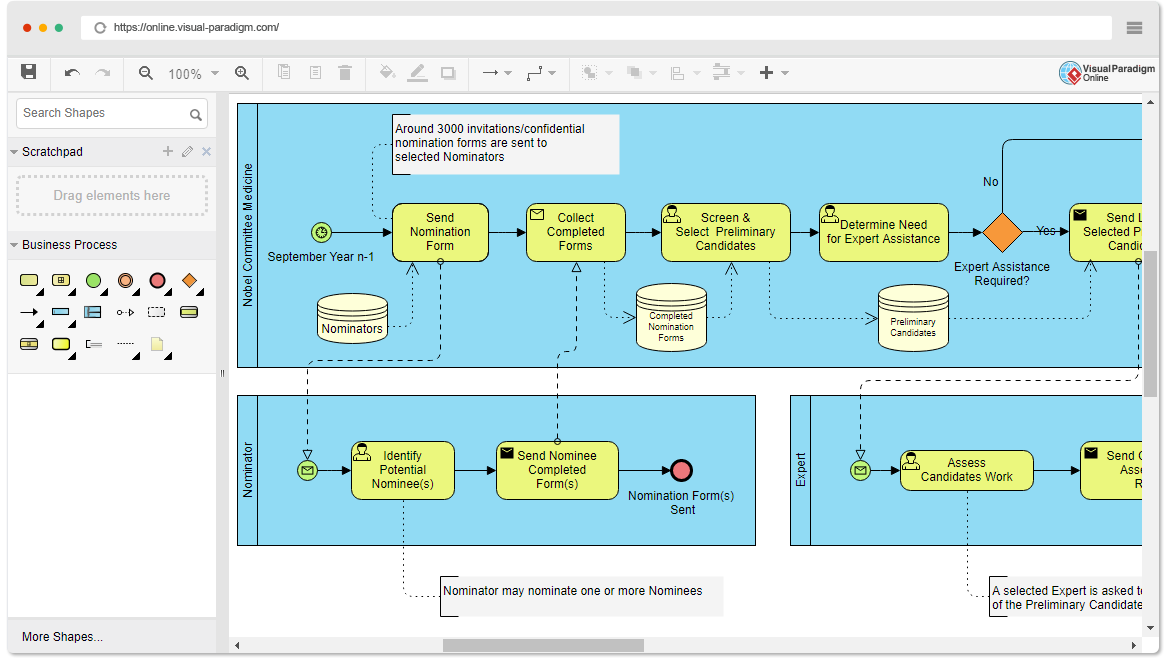
Diagram Example: This image displays a business process diagram illustrating the Nobel Committee nomination and selection process, involving roles like the Nobel Committee, Nominator, and Expert.
2. Key Concepts and Elements
BPMN diagrams are built from four main types of elements: Events, Activities, Gateways, and Flow Objects.
2.1 Events
Events are things that happen during a process. They are represented by circles and have no width.
-
Start Event: The beginning of a process (usually a green circle).
-
End Event: The termination of a process (usually a red circle).
-
Intermediate Event: Something that happens between the start and end (e.g., a timer, a message, or an error).
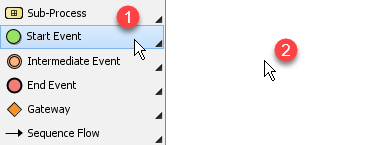
Diagram Example: Visual Paradigm interface showing the selection of a Start Event to initiate a process flow.
2.2 Activities
Activities represent work that needs to be done. They are represented by rounded rectangles.
-
Task: An atomic unit of work (e.g., “Fill Form,” “Ship Goods”).
-
Sub-Process: A complex activity that contains its own internal logic and can be expanded for more detail.
-
User Task: A task performed by a human.
-
Service Task: A task performed by a system or application.

Diagram Example: A User Task example showing an order approval step in a workflow where a human actor performs the action.
2.3 Gateways
Gateways represent decision points in a process. They are represented by diamonds and determine the path the flow will take.
-
Exclusive Gateway (XOR): Selects one path out of many (e.g., “Is Stock Available? Yes -> Pack; No -> Cancel”).
-
Parallel Gateway: Splits the flow into multiple concurrent paths that run simultaneously.
-
Inclusive Gateway: Selects one or more paths based on conditions.

Diagram Example: Event-based gateway example showing decision logic branching into multiple paths based on specific triggers.
2.4 Sequence Flows
Sequence flows connect flow elements (Events, Activities, Gateways) and represent the order of execution. They are shown as solid lines with arrows.

Diagram Example: A simple sequence flow connecting “Fill Shopping Cart” to “Checkout”.
2.5 Message Flows
Message flows represent communication between different processes or pools. They are shown as dotted lines with arrows.
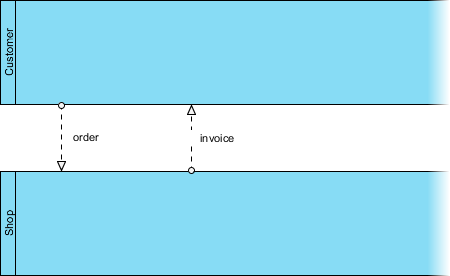
Diagram Example: Message flow between “Customer” and “Shop” swimlanes showing an “order” request and an “invoice” response.
2.6 Swimlanes (Pools and Lanes)
Swimlanes organize activities to show who is responsible for what.
-
Pool: Represents a distinct participant in the process (e.g., a company, a customer, or a department).
-
Lane: A subdivision within a pool that represents a specific role, department, or resource.
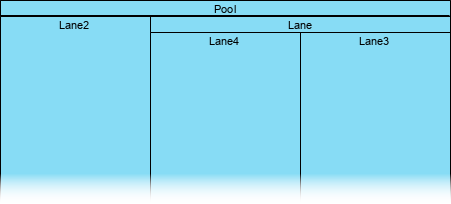
Diagram Example: A nested pool structure demonstrating how complex organizational hierarchies are modeled with swimlanes.
3. Advanced BPMN Modeling in Visual Paradigm
Visual Paradigm is a leading tool that supports the full spectrum of BPMN modeling, from basic diagrams to complex, executable processes.
3.1 As-Is and To-Be Analysis
One of the most powerful applications of BPMN is Gap Analysis.
-
As-Is Model: Documents the current state of the process to understand existing workflows and identify pain points.
-
To-Be Model: Designs the future state of the process, incorporating improvements and automation.
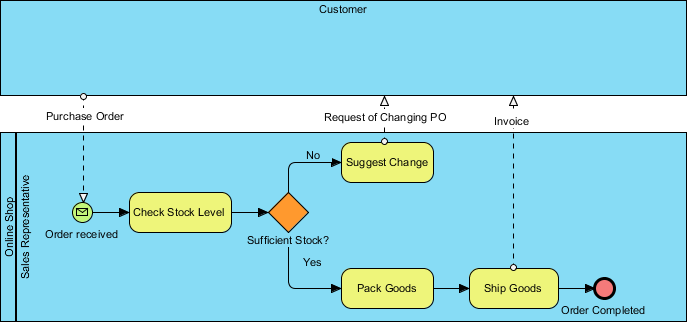
Diagram Example: An As-Is process model for an online shop, showing a customer order flow with a decision point for stock availability.
3.2 Process Simulation and Animation
Visual Paradigm allows users to simulate their BPMN diagrams to analyze performance metrics like time and cost.
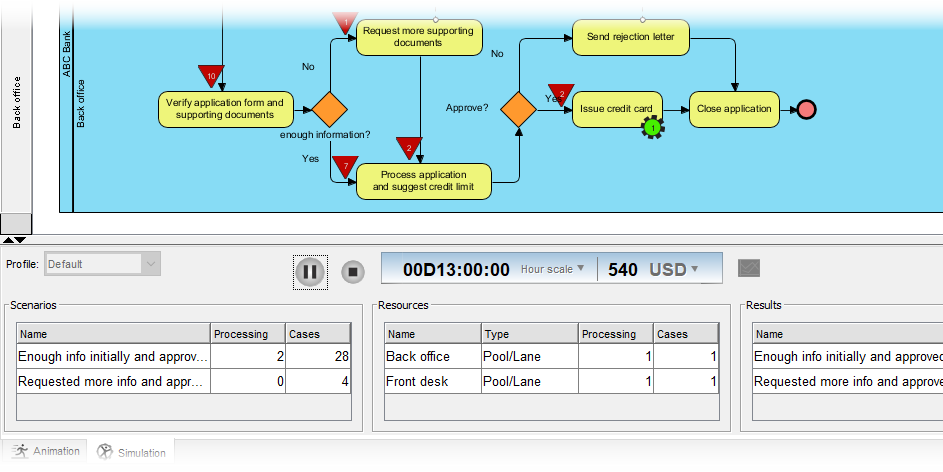
Diagram Example: A BPMN simulation interface for a bank’s credit application process, displaying metrics like execution time and cost.
3.3 Sub-Process Drill-Down
Complex processes can be collapsed into sub-processes for high-level views and expanded for detailed analysis, allowing for multiple levels of abstraction.
4. The AI Revolution: From Narrative to Diagram
The traditional bottleneck in BPMN modeling is the manual effort required to draw diagrams. Visual Paradigm has revolutionized this with AI-Powered BPMN Generation.
4.1 The AI Chatbot Approach
Instead of dragging and dropping symbols, users can now describe their process in plain English using the Visual Paradigm AI Chatbot (accessible via the desktop tool or web platform). The AI parses the natural language, identifies actors, tasks, and decision points, and instantly generates a compliant BPMN diagram.
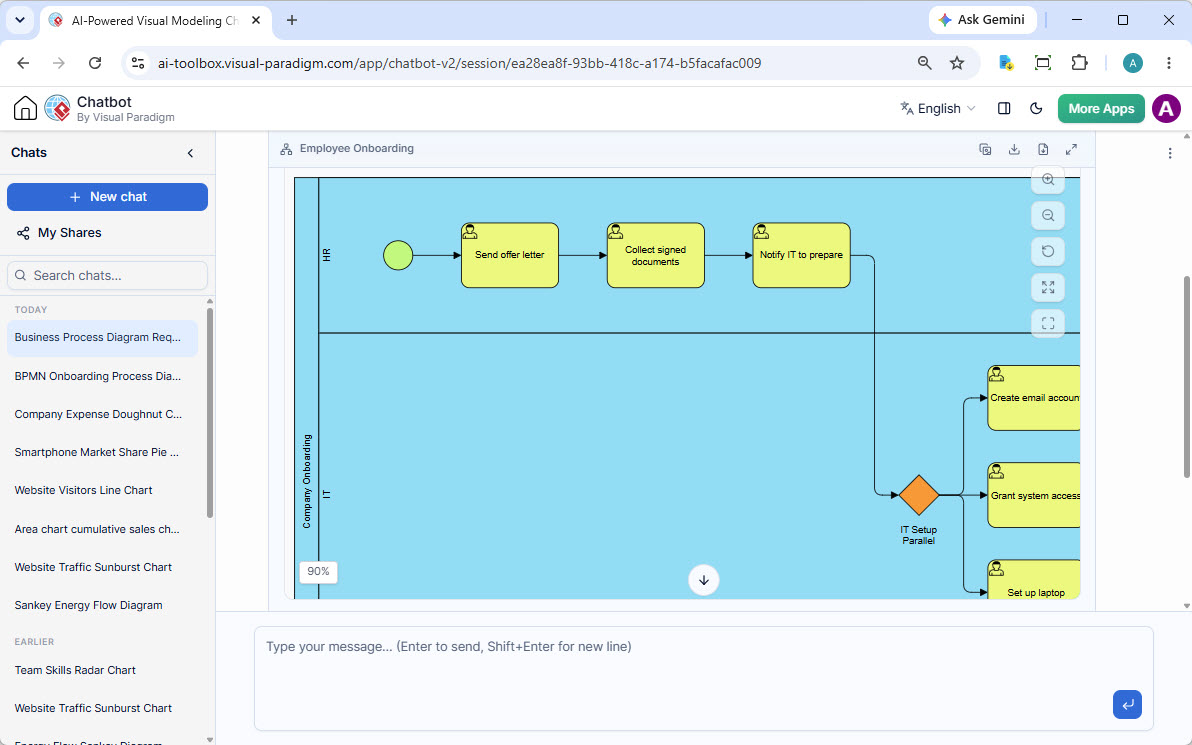
Diagram Example: An AI-generated BPMN diagram for an Employee Onboarding process, showing HR and IT swimlanes with parallel tasks.
4.2 How the AI Generator Works
-
Semantic Extraction: The AI identifies organizational entities (Pools/Lanes) and actions (Tasks).
-
Object Generation: It creates the underlying model objects, not just static shapes.
-
Smart Routing: Advanced algorithms lay out the sequence flows to minimize crossing lines and optimize readability.
-
Iterative Refinement: The generated diagram is fully editable, allowing users to refine the model manually or ask the AI to make further changes conversationally.
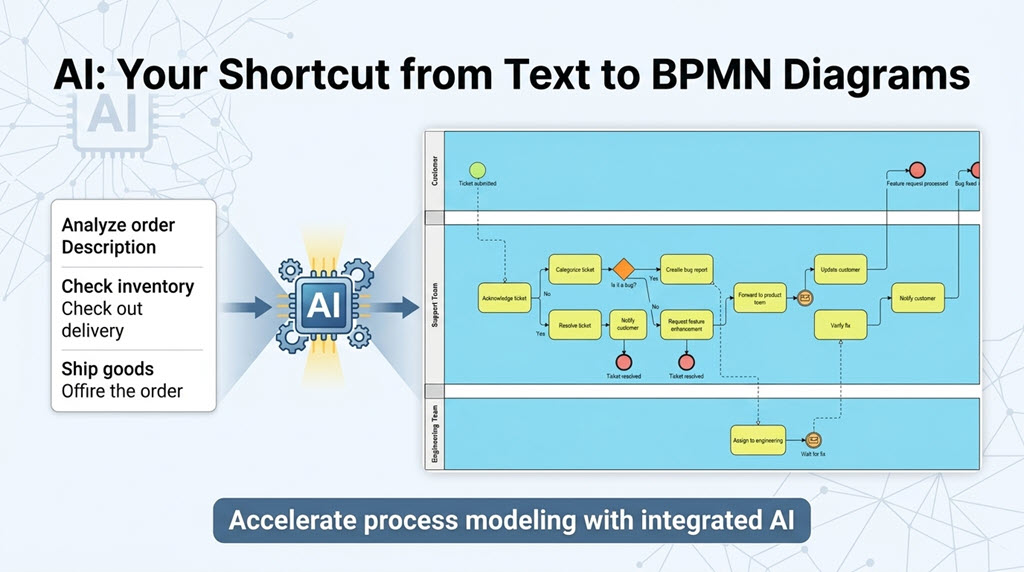
Diagram Example: A conceptual graphic showing the transformation of text descriptions into a professional BPMN diagram using AI.
5. The Visual Paradigm Ecosystem
Visual Paradigm is not just a diagramming tool; it is a comprehensive ecosystem designed for the entire process lifecycle.
-
VP Desktop: A powerful offline environment for complex modeling, code engineering, and version control.
-
Visual Paradigm Online: A web-based tool for collaboration, sharing, and team-based modeling.
-
OpenDocs: A knowledge management platform that embeds dynamic diagrams directly into documentation.
-
AI Chatbot: A conversational interface that guides users through modeling tasks and generates diagrams instantly.
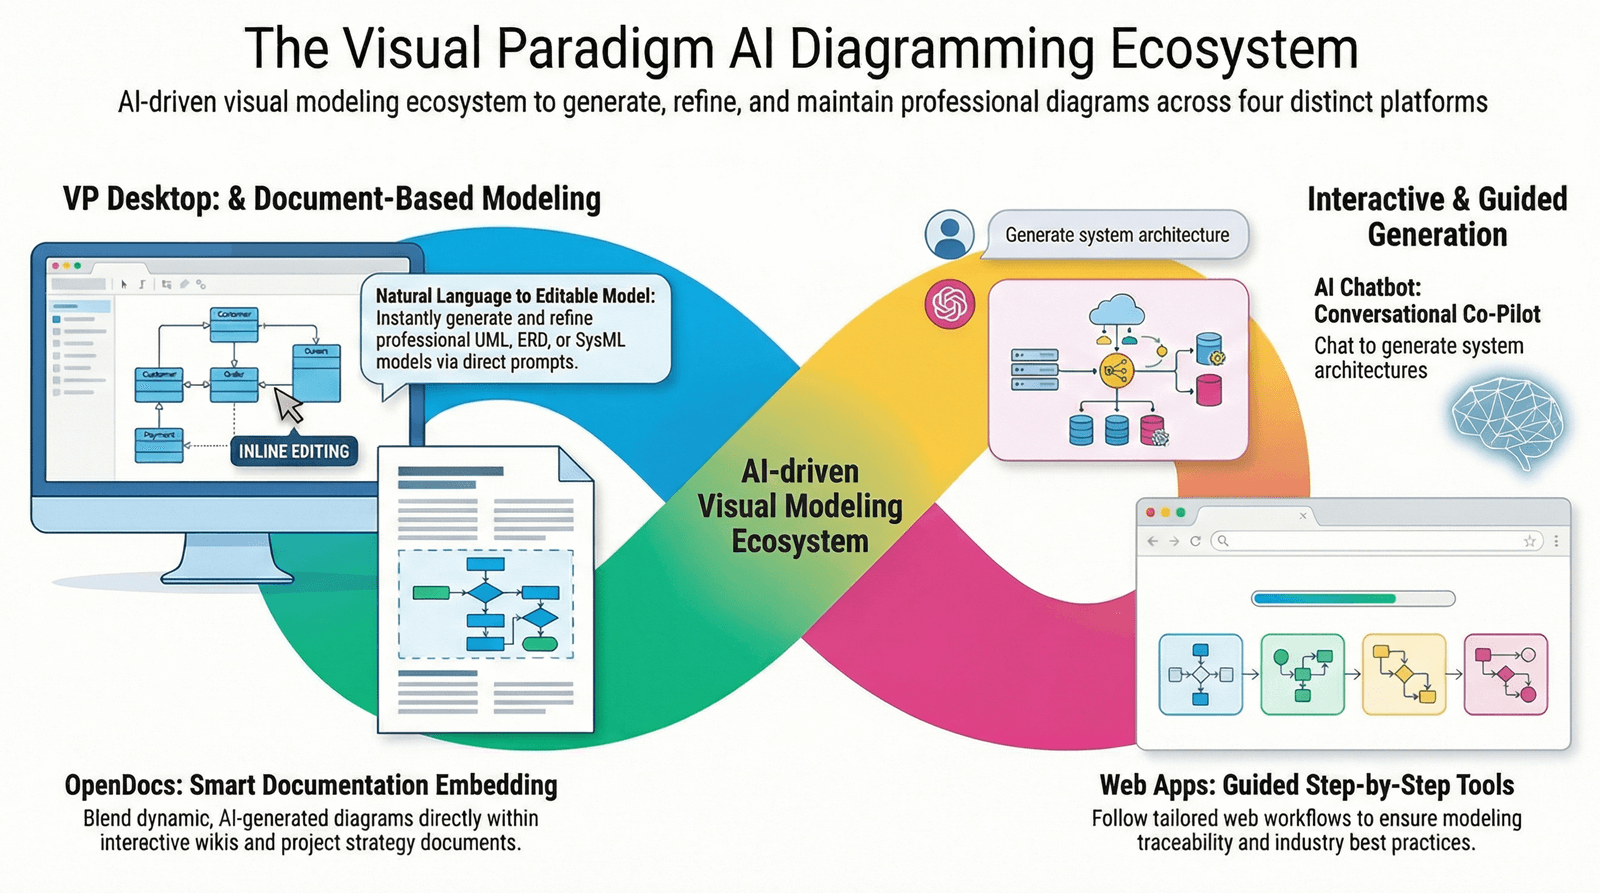
Diagram Example: An ecosystem diagram illustrating how VP Desktop, Web Apps, OpenDocs, and AI Chatbot integrate into a unified workflow.
6. Practical Examples
Example 1: Order Fulfillment
-
Start: Customer places an order.
-
Process: Sales checks inventory.
-
Decision: If stock is available, Warehouse packs and Shipping delivers. If not, the order is cancelled.
-
End: Order Completed with Invoice.
Example 2: Employee Onboarding
-
HR Lane: Send offer letter, collect signed documents, notify IT.
-
IT Lane (Parallel): Create email, grant access, set up laptop.
-
Decision: IT Setup Complete -> Process Ends.
BPMN Reference List
The following resources provide deeper insights into BPMN standards, tooling, and AI integration:
