


Introduction
In today’s fast-paced business environment, effective project management is no longer a luxury—it’s a necessity. Whether you’re leading a small team or orchestrating a complex, multi-departmental initiative, the ability to visualize, schedule, and track project progress is critical to success. Among the most powerful tools in a project manager’s arsenal are Gantt charts and PERT charts.
While both serve the fundamental purpose of helping teams plan and execute projects efficiently, they approach project visualization from distinctly different angles. Understanding when to use each tool, their unique strengths, and how modern AI-powered technologies are revolutionizing their creation can dramatically improve your project outcomes.

This comprehensive guide will walk you through the fundamental differences between Gantt and PERT charts, provide real-world case study insights, and demonstrate how to leverage cutting-edge AI tools to create professional project schedules in minutes rather than hours.
Understanding the Fundamentals
What is the Difference between Gantt and PERT Chart?
PERT and Gantt charts are visualization tools that are often used in project management. Both of these charts are used for task scheduling, controlling, and administering the tasks necessary for the completion of a project. The difference between them is that a PERT chart is a kind of network diagram, while a Gantt chart is a bar chart.
What is the PERT Chart?
PERT Chart is an acronym for (Program Evaluation and Review Technique). A PERT chart is a project management tool used to schedule, organize, and coordinate tasks within a project. It is a method to analyze the tasks involved in completing a given project, especially the time needed to complete each task and to identify the minimum time needed to complete the total project.
What is a Gantt Chart?
A Gantt chart is a type of horizontal bar chart commonly used in project management, which is a visual view of tasks scheduled overtime. It provides a graphical visualization of a schedule that helps to plan, coordinate, and track specific tasks (or elements) in a project.
Gantt chart boils down multiple tasks and timelines into a single page. Using a Gantt chart allows all stakeholders to perceive the same schedule information, sets mutually understood expectations, and conducts their efforts according to the desired protocol. The Gantt chart tool provides a visual timeline for the start and end of tasks, making it clear how tasks are interrelated and perhaps rely on the completion of another before one can start.

Comparative Analysis: PERT vs Gantt Chart
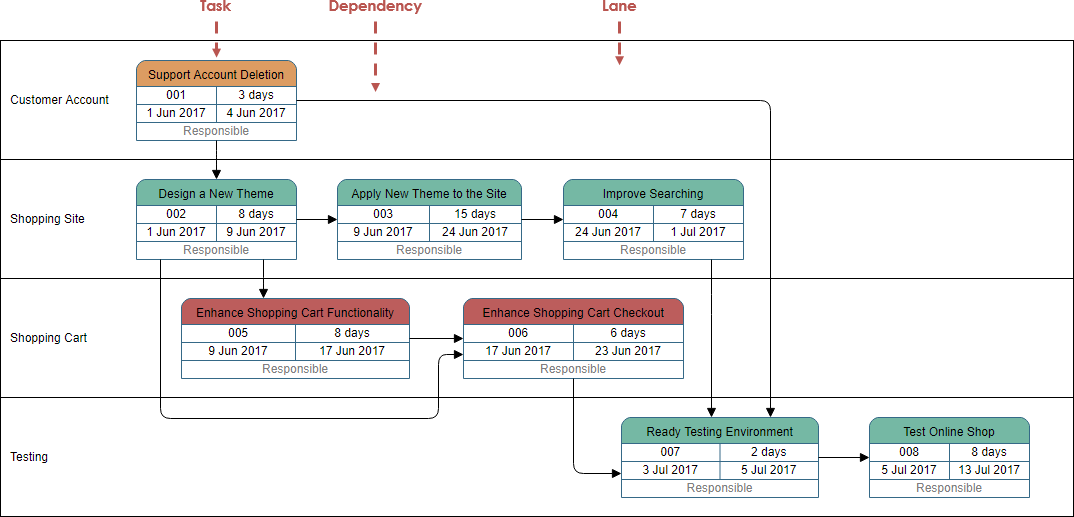
PERT charts are network diagrams that use boxes to represent tasks and arrows to present dependencies between tasks. The boxes are laid out from left to right, but there is no fixed Y-axis with dates. The first box, or root, is centered vertically on the left side, and the subsequent tasks can be drawn anywhere along the Y-axis. Arrows can point to the right, up or down, but never to the left.
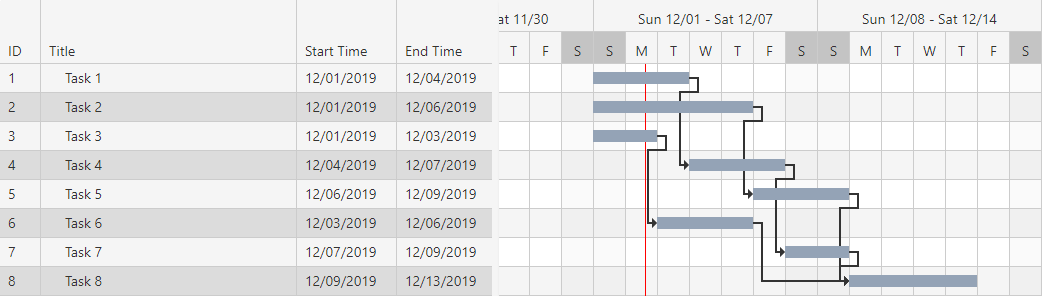
Gantt charts are bar graphs. The X-axis contains dates and the Y-axis lists separate tasks. On each line of the Y-axis, the chart depicts a bar positioned to extend from the task’s start date to its end date. Tasks are listed in the start-date order.
PERT vs Gantt Example
A Pert Chart:
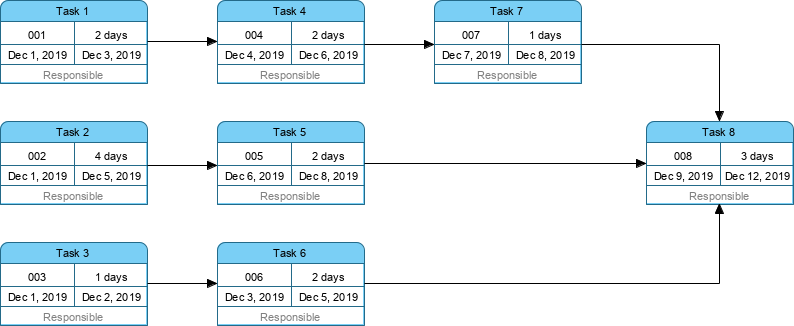
The ‘Gantt Chart version” of the PERT Chart above:
Summary Comparison Table
| Gantt chart | PERT chart |
|---|---|
| Gantt chart is defined as the bar chart. | PERT chart is similar to a network diagram |
| Gantt chart was developed by Henry L. Gantt. | PERT chart was developed by the United States navy. |
| Gantt chart is often used for Small Projects | PERT chart can be used for large and complex Projects |
| Gantt chart focuses on the time required to complete a task | PERT chart focuses on the dependency of relationships. |
| Gantt chart is simpler and more straightforward | PERT chart could be sometimes confusing and complex but can be used for visualizing critical path |
Case Study: Implementing Dual Chart Strategy in Software Development
Scenario Overview
A mid-sized technology company was tasked with developing a new customer relationship management (CRM) platform within a 6-month timeframe. The project involved 15 team members across development, design, quality assurance, and deployment teams, with over 80 interdependent tasks.
Challenge
The project manager faced several critical challenges:
-
Complex task dependencies that were difficult to track
-
Multiple stakeholders requiring different levels of detail
-
Need to identify the critical path to prevent delays
-
Requirement to communicate progress clearly to non-technical executives
Solution Implementation
Phase 1: PERT Chart for Planning
The team initially created a PERT chart to:
-
Map out all 80+ tasks and their dependencies
-
Identify the critical path through the project
-
Calculate optimistic, pessimistic, and most likely timeframes for each task
-
Visualize complex relationships between development modules
Phase 2: Gantt Chart for Execution
Once the planning phase was complete, the team converted their PERT analysis into a Gantt chart to:
-
Provide a clear timeline view for all team members
-
Track progress against specific dates
-
Communicate milestones to stakeholders
-
Monitor resource allocation across the timeline
Results
-
30% reduction in project planning time
-
Zero critical path delays throughout the 6-month project
-
Improved stakeholder satisfaction due to clear visual communication
-
Early identification of potential bottlenecks 3 weeks before they would have impacted delivery
Key Takeaways
-
Use PERT for complex planning when task dependencies are numerous and critical path analysis is essential
-
Use Gantt for execution and communication when you need to track progress and share timelines with stakeholders
-
Combine both tools for maximum effectiveness in large-scale projects
-
Leverage modern AI tools to convert between formats quickly and maintain synchronization
Key Concepts and Guidelines
When to Use PERT Charts
✓ Complex projects with numerous interdependent tasks
✓ Research and development initiatives with uncertain timelines
✓ Critical path analysis is required
✓ Risk assessment and time estimation are priorities
✓ Large-scale projects requiring detailed dependency mapping
When to Use Gantt Charts
✓ Straightforward projects with clear timelines
✓ Stakeholder communication is a priority
✓ Progress tracking against specific dates is needed
✓ Resource allocation visualization is important
✓ Team coordination requires simple, clear visuals
Best Practices for Implementation
-
Start with PERT for planning – Map dependencies first
-
Convert to Gantt for execution – Simplify for daily use
-
Update regularly – Keep both charts synchronized
-
Identify critical path – Focus attention on high-impact tasks
-
Communicate appropriately – Use Gantt for executives, PERT for technical teams
-
Build in buffers – Account for unexpected delays
-
Review dependencies – Ensure arrows/links reflect reality
Modern AI-Powered Project Management Tools
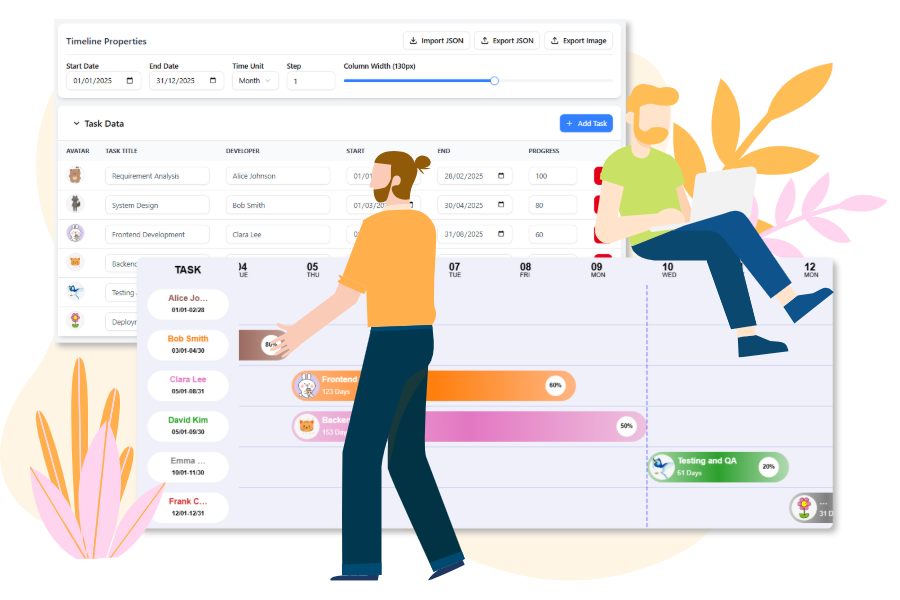
Instant Gantt Chart Builder
The free workspace for project managers and developers. Build, customize, and generate production-ready Gantt Chart configuration code instantly.
Try It Now
Core Features: Design, Configure, Generate
Leverage the power of cutting-edge visualization technology with a user-friendly frontend.

Interactive Timeline
Easily configure the Date Range, Time Unit (day, week, month), and Column Width using simple sliders and pickers.

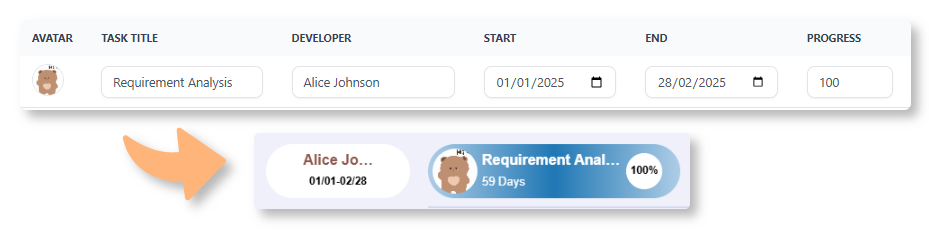
Dynamic Task Editor
Manage tasks by adding progress percentage, set dates, and assign developers with customizable avatars.

Live Preview
See changes instantly on the Gantt Chart below to view the progress clearly in a visual way.

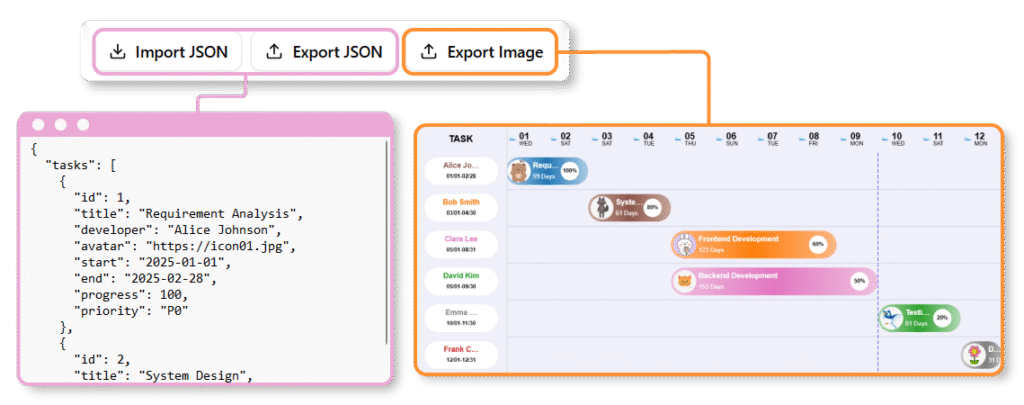
Image Export
Export the Gantt Chart as image to share your latest work to your team members.
How to Build Your Gantt Chart
Create your comprehensive project plan using only the visual interface.
01 | Input Tasks in the Data Table
Enter each project task, including the Start Date, End Date, Assigned Team Member, and Progress (%), directly into the spreadsheet-like data editor.
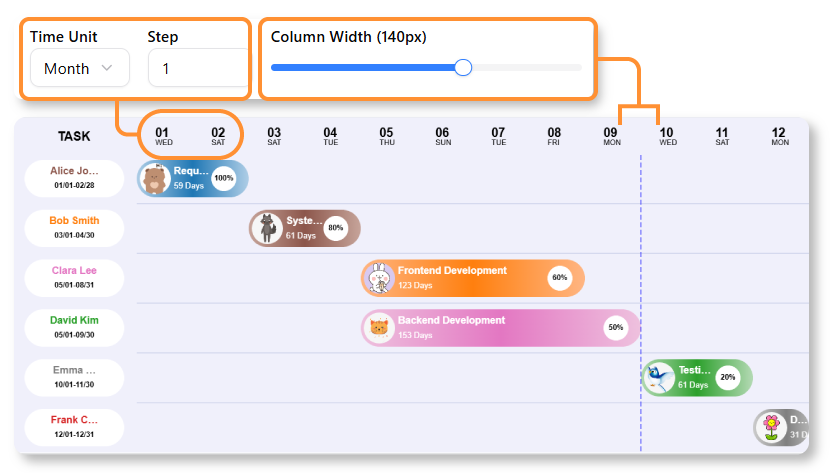
02 | Visualize & Customize the Timeline
Use the control panel to adjust the overall project Date Range and change the time scale from Days to Weeks or Months. See your tasks instantly rendered as interactive bars on the chart.
03 | Review & Export
Review and confirm the final visual output. You can export the Gantt Chart to image, and also share the data by the JSON to your team members.
Leveraging AI for Rapid Chart Generation
A Gantt chart is a visual project management tool that represents a schedule as a horizontal bar chart. It displays tasks on the vertical axis and time intervals on the horizontal axis, with the width of each bar indicating a task’s duration. Modern Gantt charts also visualize dependency relationships (links between tasks) and current project progress. [1, 2, 3]
How to use Visual Paradigm’s AI-Powered Tools for Gantt Charts
Visual Paradigm provides several AI-driven ways to generate and manage Gantt charts instantly from text. [4]
1. AI Development Plan Generator: This tool creates an Instant Visual Timeline Diagram alongside a textual plan.
-
Describe Your Project: Enter a clear goal and constraints (e.g., “Plan a 3-month website redesign”) into the input field.
-
Generate: The AI analyzes the input to produce a detailed task breakdown and a corresponding visual timeline with Gantt-like elements.
-
Refine: You can manually adjust task durations, add dependencies, or modify the plan directly in the editor.
2. AI Chatbot (for PERT-to-Gantt Conversion):
-
Use the AI Chatbot to generate a PERT chart by describing project phases.
-
The ecosystem allows for Seamless Format Conversion, where the AI-generated PERT chart can be converted into a Gantt view instantly.
3. Standard AI Diagram Generator:
In the Visual Paradigm Desktop (Enterprise Edition) or Online workspace, you can use the AI Diagram Generator to type what you need and get accurate diagrams without manual drawing. [4, 5, 6, 7, 8, 9]
Key Benefits of AI Integration
-
Automated Scheduling: AI identifies task sequences and dependencies from plain English.
-
Time Savings: Reduces project planning time from hours to minutes by skipping manual bar plotting.
-
Dynamic Synchronization: Once generated, the Gantt Chart Builder ensures that any visual edits (like dragging a bar) are instantly reflected in the task data and vice-versa. [4, 9, 10, 11, 12]
Conclusion
The choice between Gantt and PERT charts is not a matter of which is superior, but rather which is most appropriate for your specific project needs, team structure, and stakeholder requirements. As we’ve explored throughout this guide, each visualization tool offers distinct advantages:
PERT charts excel in the planning phases of complex projects where understanding task dependencies and identifying the critical path are paramount. They provide the analytical depth needed for risk assessment and time estimation in uncertain environments.
Gantt charts shine during project execution and stakeholder communication, offering intuitive timeline visualization that makes progress tracking and resource management straightforward for teams of all sizes.
The modern project manager’s toolkit is no longer limited to choosing one or the other. With the advent of AI-powered tools like Visual Paradigm’s intelligent diagram generators, you can now:
-
Generate comprehensive project plans from simple text descriptions
-
Seamlessly convert between PERT and Gantt formats
-
Maintain real-time synchronization across multiple visualization types
-
Reduce planning time from hours to minutes
The case study presented demonstrates that the most successful projects often employ both tools strategically—using PERT for initial complex planning and critical path analysis, then transitioning to Gantt charts for execution, monitoring, and stakeholder communication.
As project management continues to evolve with technological advancement, the integration of AI tools is democratizing access to professional-grade project visualization. Whether you’re managing a small team initiative or orchestrating enterprise-level transformations, mastering both Gantt and PERT charts—and knowing when to leverage each—will position you to deliver projects more efficiently, communicate more effectively, and achieve better outcomes consistently.
The future of project management is not about choosing between tools, but about intelligently combining traditional methodologies with modern AI capabilities to create adaptive, responsive, and visually compelling project plans that drive success.
References
- Gantt Chart Software: Comprehensive guide to Gantt chart software tools and features for effective project visualization and management.
- Practical Guide to Gantt Charts: In-depth practical guide covering Gantt chart fundamentals, creation methods, and best practices for project managers.
- Gantt Chart for Project Managers: Essential resource for project managers on utilizing Gantt charts for task scheduling, tracking, and team coordination.
- Comprehensive Tutorial: Using Visual Paradigm’s AI Development Plan Generator: Step-by-step tutorial on leveraging AI-powered tools to generate development plans and visual timelines automatically.
- AI Diagram Generation: Overview of Visual Paradigm’s AI diagram generation capabilities that transform text descriptions into professional diagrams instantly.
- Comprehensive Tutorial: Using Visual Paradigm’s AI Development Plan Generator: Detailed walkthrough of AI-assisted project planning and timeline generation.
- Comprehensive Tutorial: Using Visual Paradigm’s AI Development Plan Generator: Advanced techniques for AI-powered development planning and visualization.
- Gantt Chart for Project Managers (Chinese): Chinese language resource on Gantt chart implementation for project management professionals.
- Visual Paradigm AI PERT Chart Generator: Guide to using AI tools for generating PERT charts and converting between different project visualization formats.
- Free Gantt Chart Builder Release: Announcement and documentation for Visual Paradigm’s free Gantt chart builder tool with real-time synchronization features.
- Smarter Diagrams Powered by AI: The All-in-One Visual Paradigm Platform AI Ecosystem: Comprehensive guide to Visual Paradigm’s AI ecosystem for intelligent diagram creation and project management.
- Free Gantt Chart Builder Release: Documentation on the free Gantt chart builder featuring dynamic task editing and instant visual preview capabilities.