

Introduction
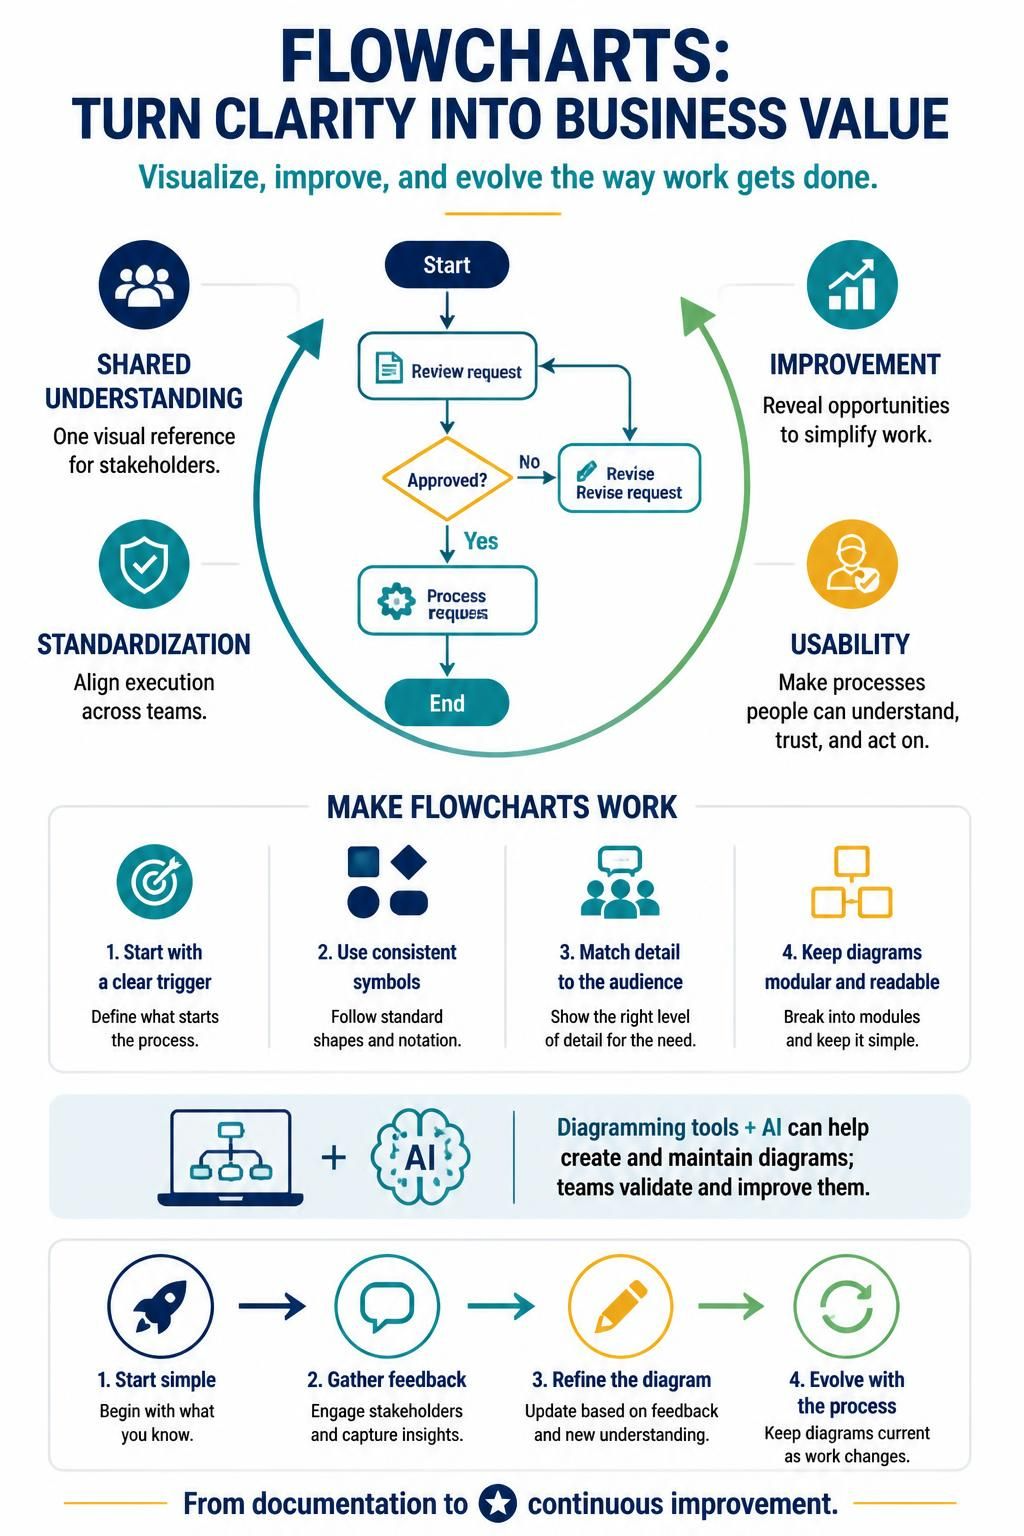
In the complex landscape of modern business operations, clarity is currency. Business Process Management (BPM) relies heavily on the ability to visualize, understand, and optimize workflows. At the heart of this visualization lies the flowchart—a deceptively simple yet profoundly powerful tool that transforms abstract processes into concrete, actionable diagrams.
Flowcharts serve as the universal language of process improvement, bridging the gap between technical teams, management, and operational staff. Whether you’re troubleshooting a faulty lamp or orchestrating a multi-departmental enterprise workflow, flowcharts provide the structural framework needed to identify bottlenecks, eliminate redundancies, and standardize operations across organizations.
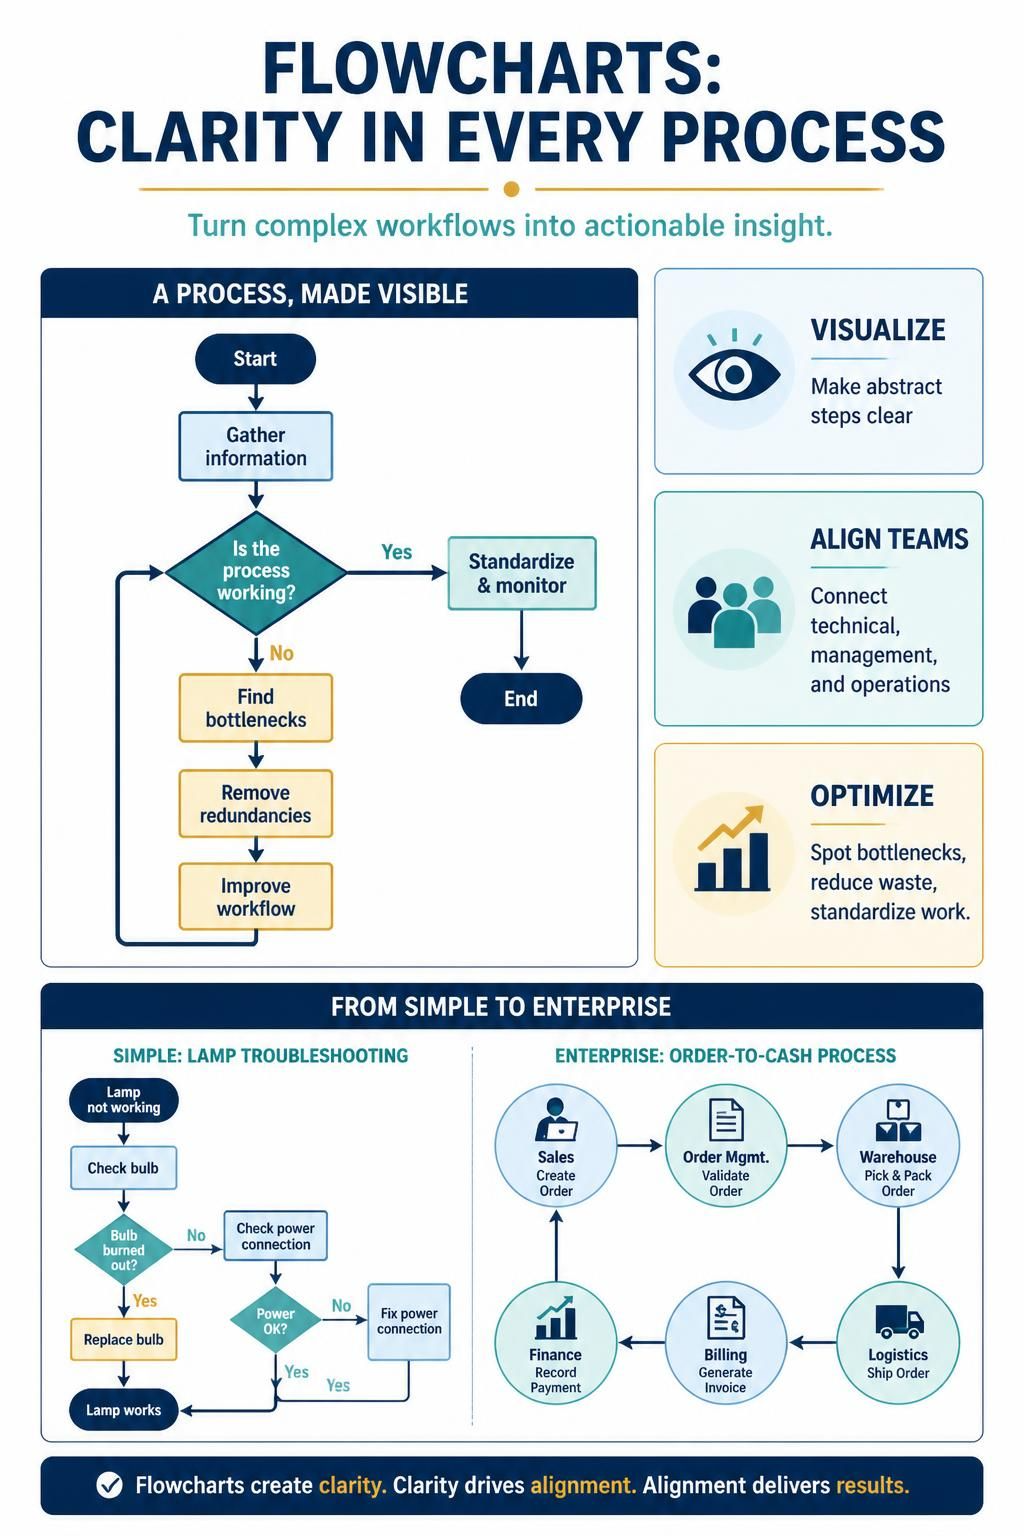
This comprehensive guide explores how flowcharting drives effective Business Process Management, covering fundamental symbols, best practices, real-world applications, and modern tooling approaches that leverage AI-assisted diagramming capabilities.
Key Concepts in Business Process Flowcharting
1. The Purpose of Flowcharts in BPM
Flowcharts are not merely decorative diagrams; they are analytical instruments that serve multiple critical functions:
-
Shared Understanding: Creating a common reference point for all stakeholders
-
Process Analysis: Identifying bottlenecks, inefficiencies, and resource allocation issues
-
Standardization: Ensuring consistent execution across different teams or departments
-
Exception Handling: Mapping variations and edge cases that deviate from the normal flow
-
Documentation: Providing enduring records of how processes should operate
2. Core Flowchart Symbols
While numerous specialized symbols exist, effective flowcharts rely on five fundamental elements:
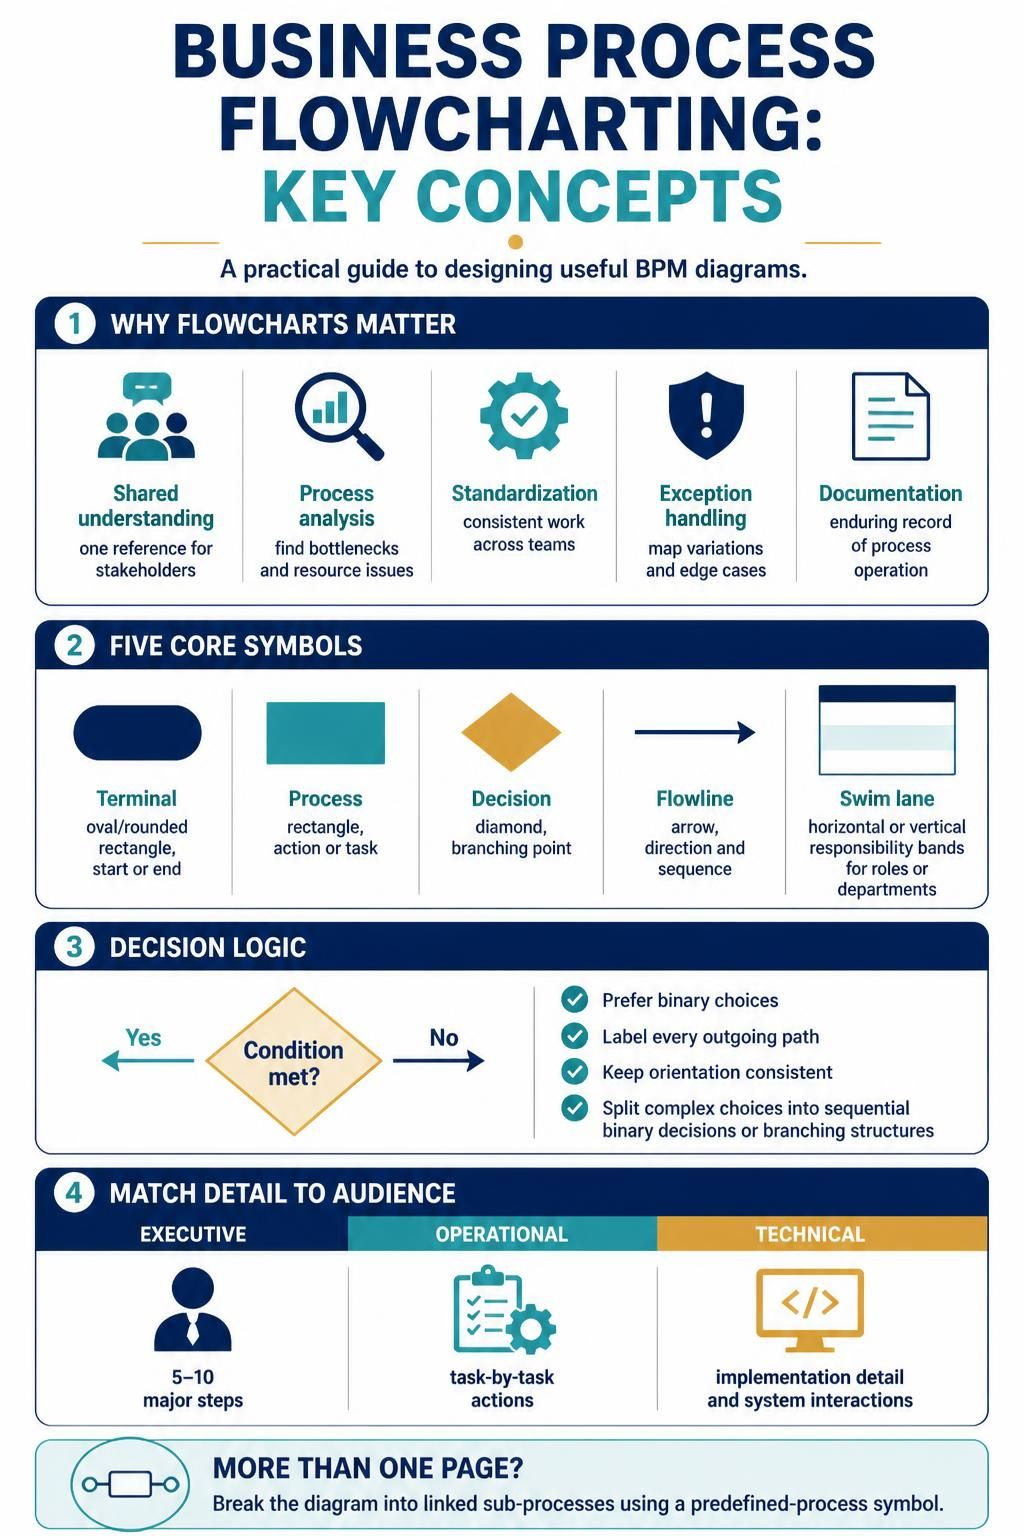
| Symbol | Shape | Purpose |
|---|---|---|
| Terminal | Oval/Rounded Rectangle | Marks the start or end of a process |
| Process | Rectangle | Represents an action or task |
| Decision | Diamond/Rhombus | Indicates a branching point (Yes/No, True/False) |
| Arrow/Flowline | Arrow | Shows the direction and sequence of steps |
| Swim Lane | Horizontal/Vertical Bands | Denotes responsibility by person, role, or department |
3. Decision Point Logic
Decision symbols are unique in that they generate multiple output paths. Best practice dictates:
-
Limit decisions to binary choices when possible (Yes/No)
-
Label all outgoing arrows clearly
-
Maintain consistency in path orientation (e.g., “Yes” always flows downward, “No” always flows rightward)
-
Break complex multi-option decisions into sequential binary decisions or use branching structures
4. Level of Detail Strategy
The granularity of your flowchart should match its audience:
-
Executive Level: High-level overview with 5-10 major steps
-
Operational Level: Detailed task-by-task breakdown with specific actions
-
Technical Level: Granular implementation details including system interactions
When a flowchart exceeds one page, consider decomposing it into sub-processes linked via predefined process symbols.
Diagram Examples Using PlantUML Code
Below are practical PlantUML examples demonstrating various flowchart scenarios relevant to business processes.
Example 1: Basic Expense Approval Process
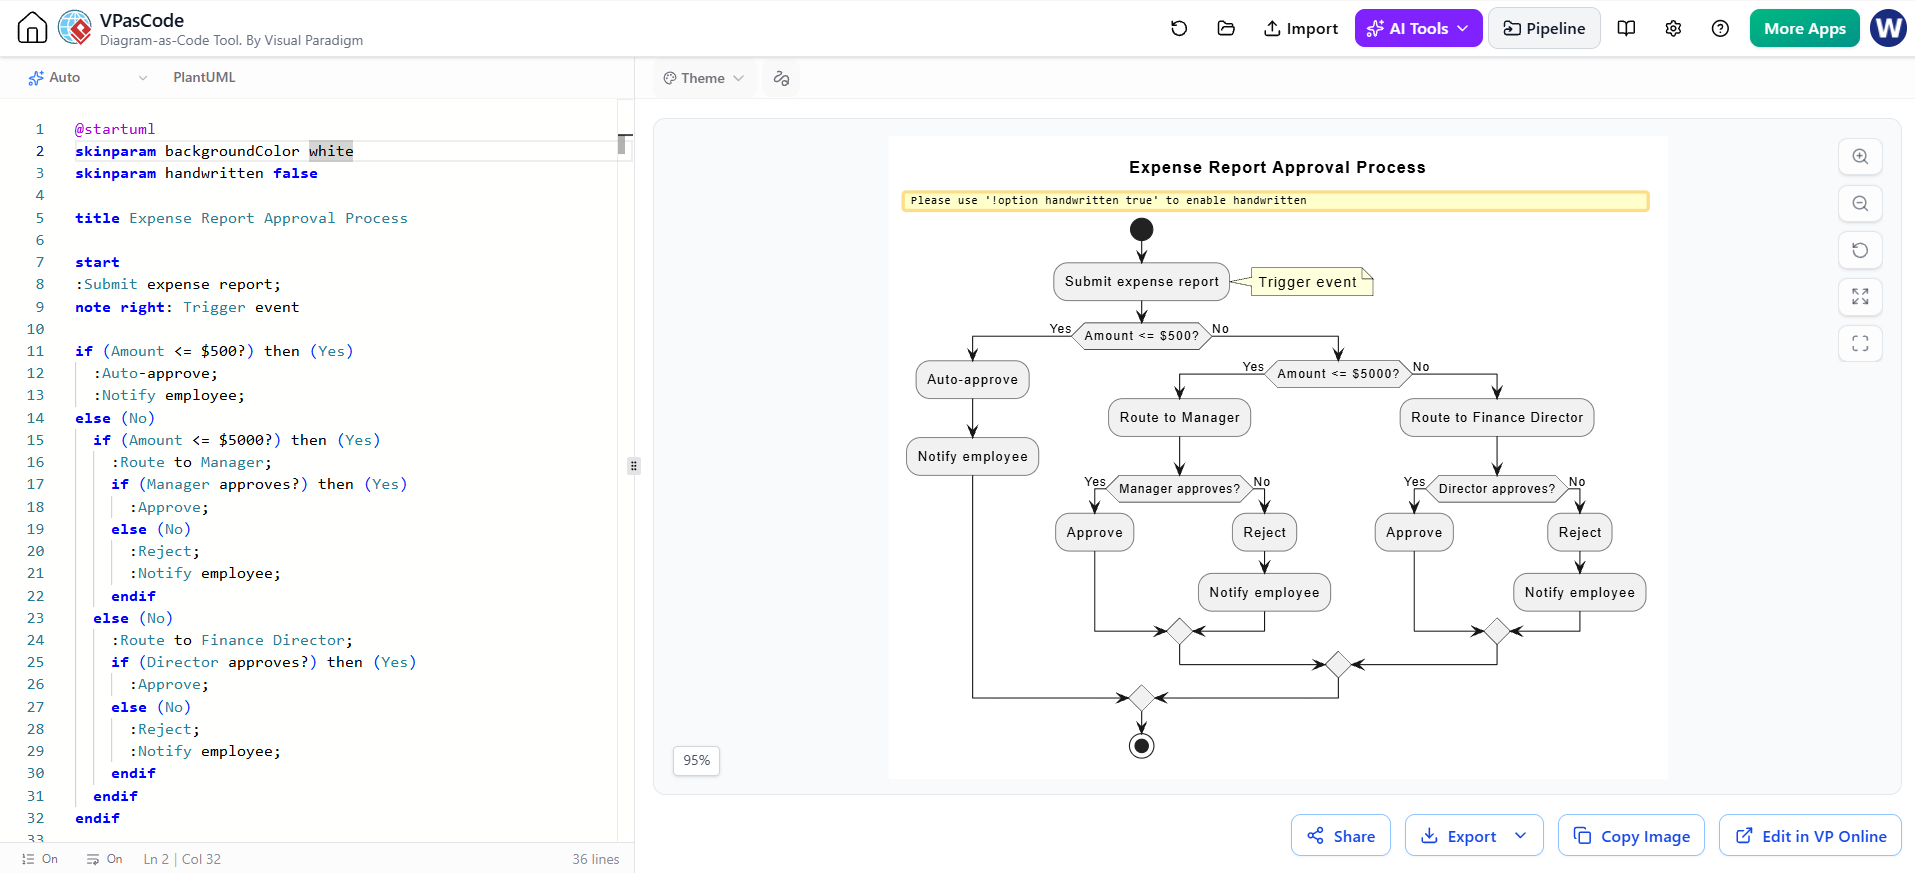
@startuml
skinparam backgroundColor white
skinparam handwritten false

title Expense Report Approval Process

start
:Submit expense report;
note right: Trigger event

if (Amount <= $500?) then (Yes)
  :Auto-approve;
  :Notify employee;
else (No)
  if (Amount <= $5000?) then (Yes)
    :Route to Manager;
    if (Manager approves?) then (Yes)
      :Approve;
    else (No)
      :Reject;
      :Notify employee;
    endif
  else (No)
    :Route to Finance Director;
    if (Director approves?) then (Yes)
      :Approve;
    else (No)
      :Reject;
      :Notify employee;
    endif
  endif
endif

stop

@enduml
Example 2: Swim Lane Diagram for Customer Onboarding
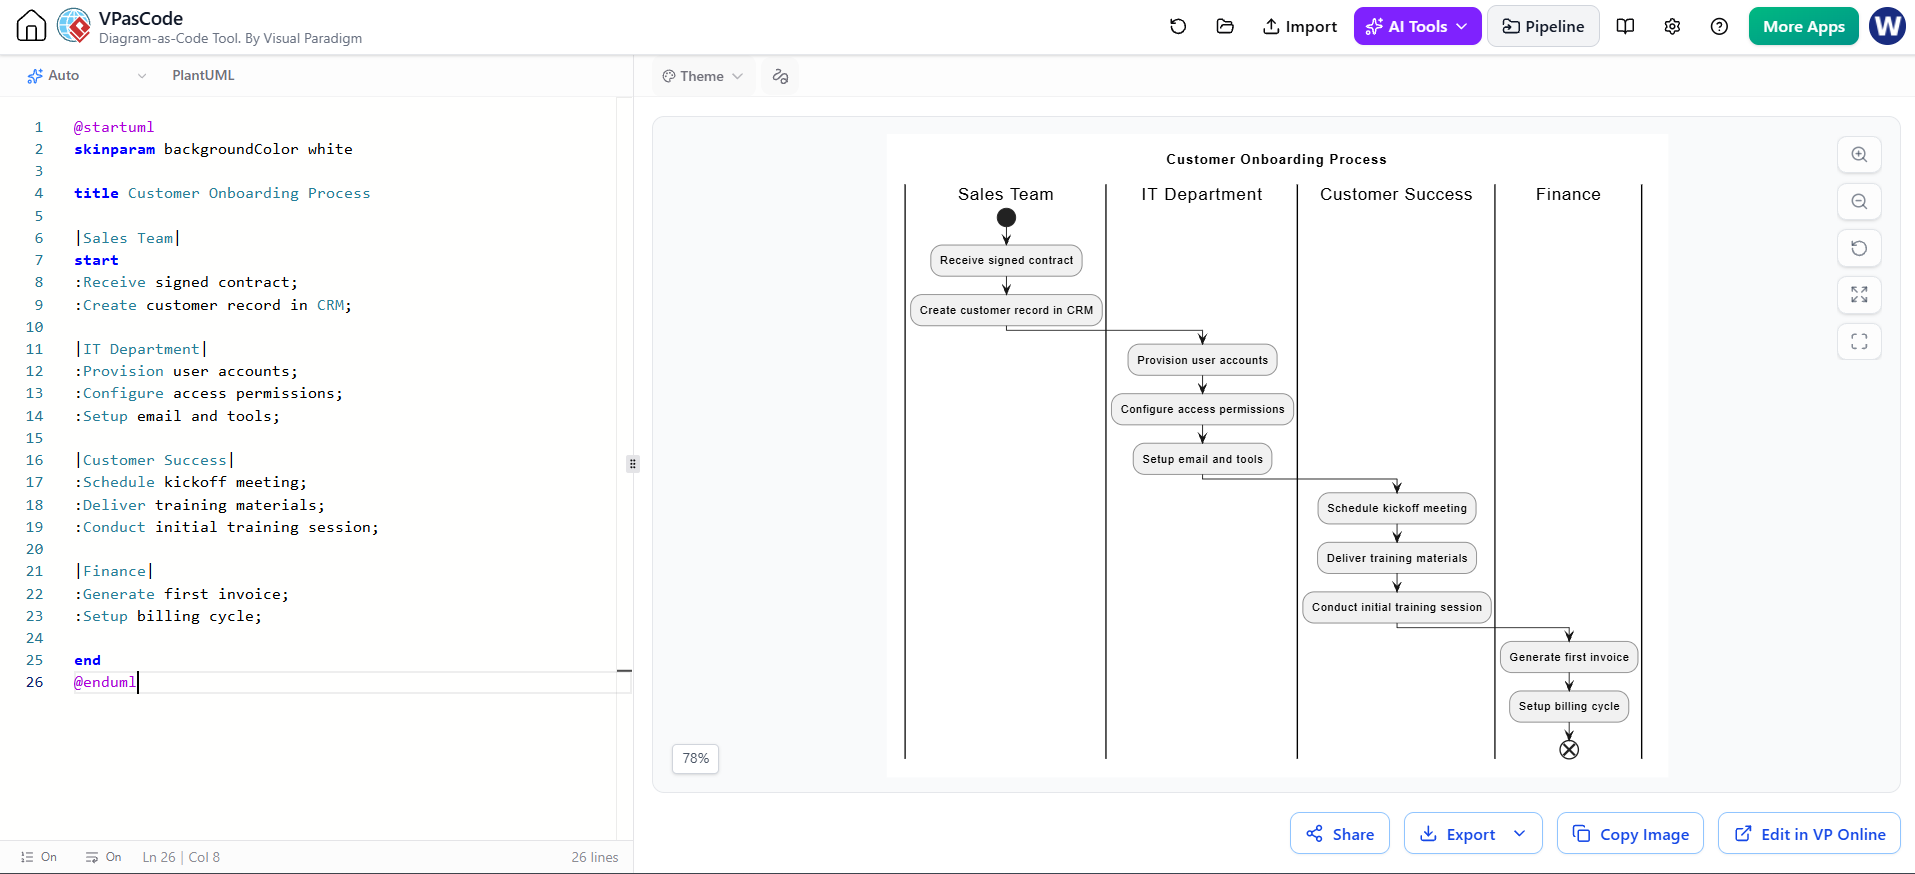
@startuml
skinparam backgroundColor white

title Customer Onboarding Process

|Sales Team|
start
:Receive signed contract;
:Create customer record in CRM;

|IT Department|
:Provision user accounts;
:Configure access permissions;
:Setup email and tools;

|Customer Success|
:Schedule kickoff meeting;
:Deliver training materials;
:Conduct initial training session;

|Finance|
:Generate first invoice;
:Setup billing cycle;

end
@enduml
Example 3: IT Incident Resolution with Multiple Endpoints
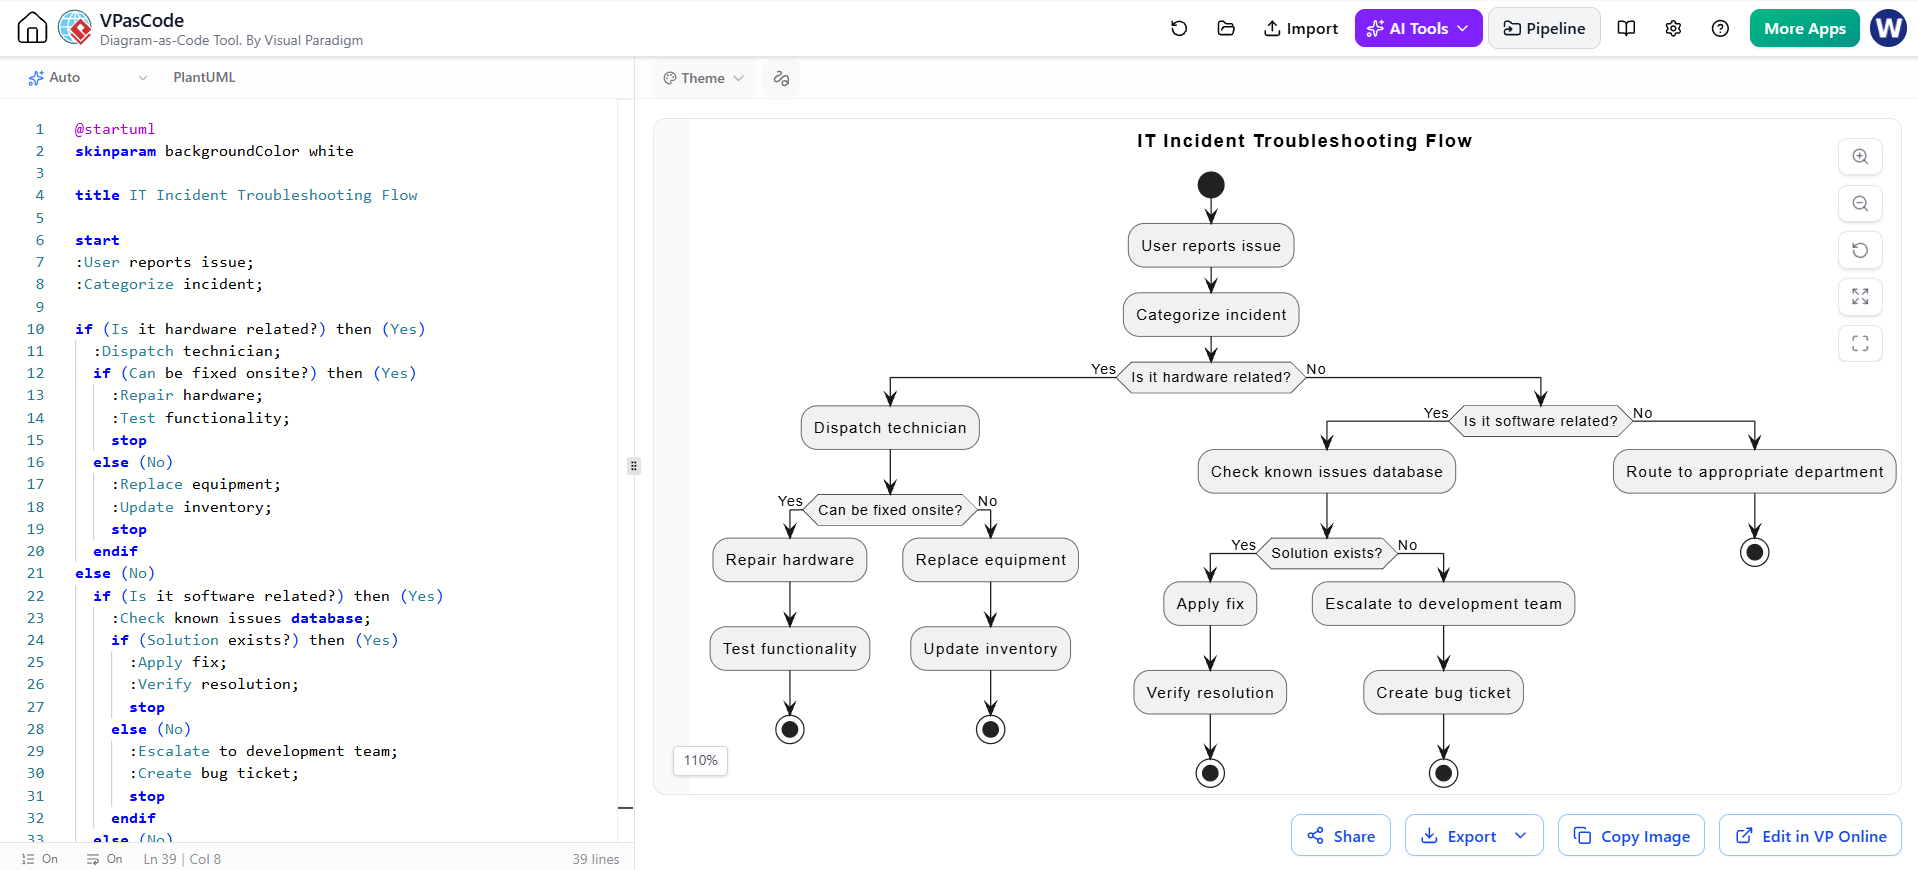
@startuml
skinparam backgroundColor white

title IT Incident Troubleshooting Flow

start
:User reports issue;
:Categorize incident;

if (Is it hardware related?) then (Yes)
  :Dispatch technician;
  if (Can be fixed onsite?) then (Yes)
    :Repair hardware;
    :Test functionality;
    stop
  else (No)
    :Replace equipment;
    :Update inventory;
    stop
  endif
else (No)
  if (Is it software related?) then (Yes)
    :Check known issues database;
    if (Solution exists?) then (Yes)
      :Apply fix;
      :Verify resolution;
      stop
    else (No)
      :Escalate to development team;
      :Create bug ticket;
      stop
    endif
  else (No)
    :Route to appropriate department;
    stop
  endif
endif

@enduml
Example 4: Complex Process with Sub-Processes
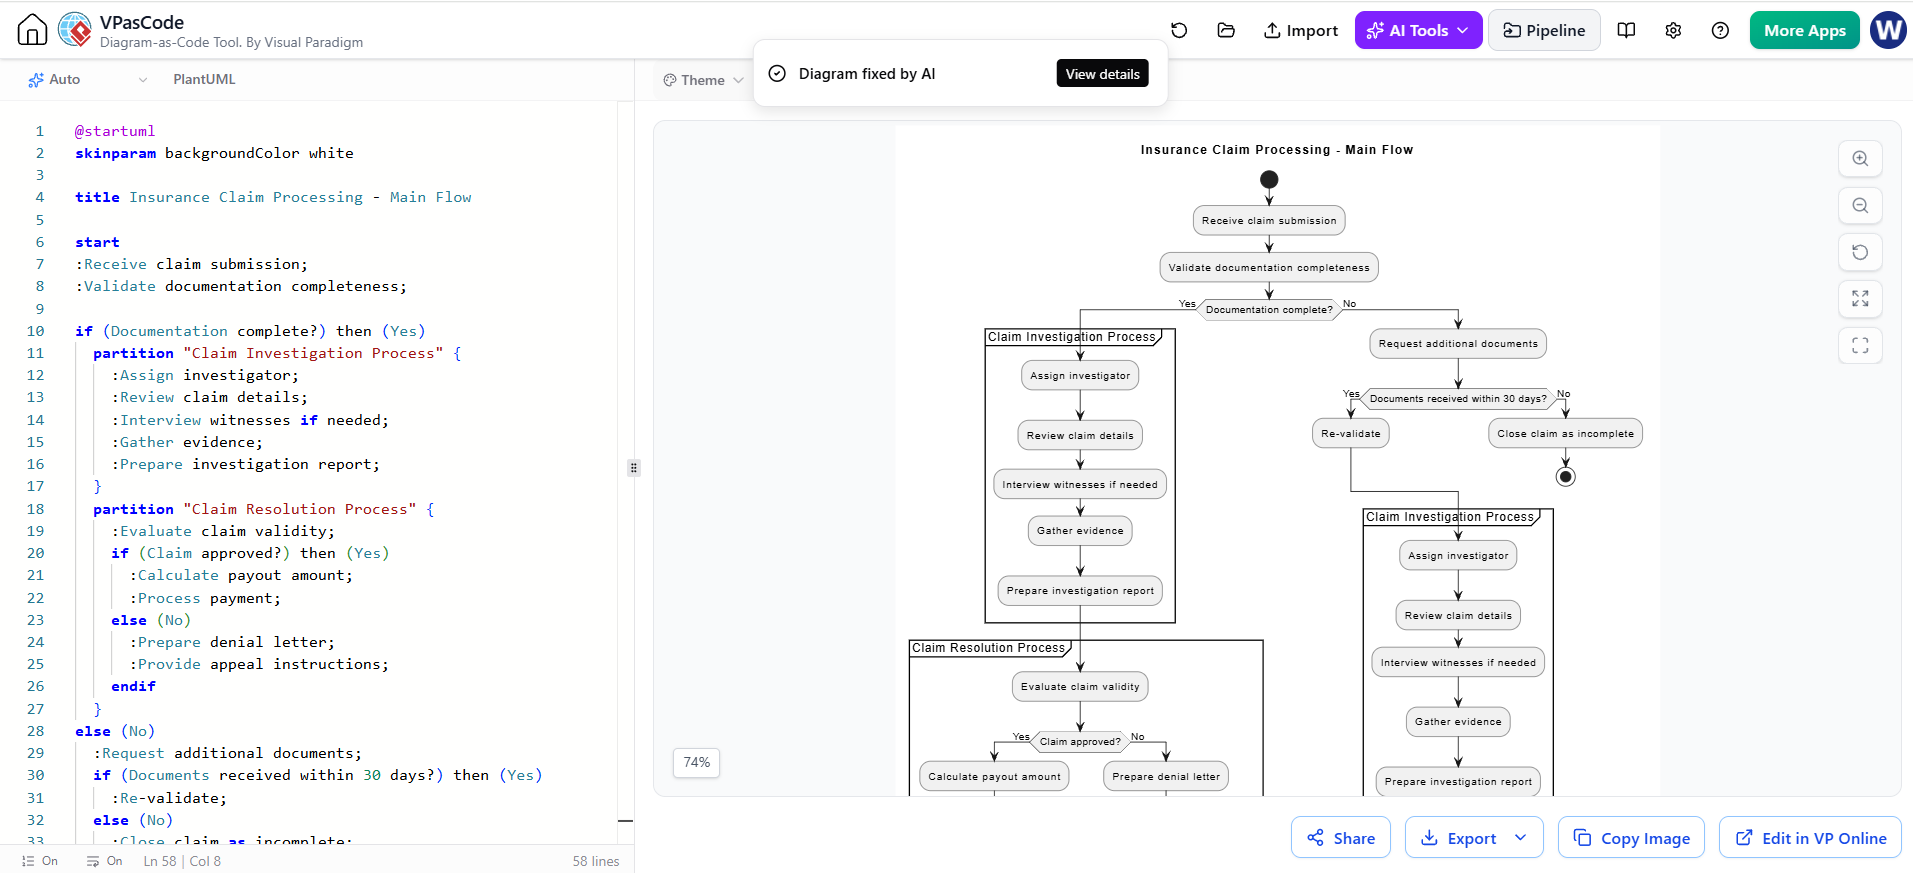
@startuml
skinparam backgroundColor white

title Insurance Claim Processing - Main Flow

start
:Receive claim submission;
:Validate documentation completeness;

if (Documentation complete?) then (Yes)
  partition "Claim Investigation Process" {
    :Assign investigator;
    :Review claim details;
    :Interview witnesses if needed;
    :Gather evidence;
    :Prepare investigation report;
  }
  partition "Claim Resolution Process" {
    :Evaluate claim validity;
    if (Claim approved?) then (Yes)
      :Calculate payout amount;
      :Process payment;
    else (No)
      :Prepare denial letter;
      :Provide appeal instructions;
    endif
  }
else (No)
  :Request additional documents;
  if (Documents received within 30 days?) then (Yes)
    :Re-validate;
  else (No)
    :Close claim as incomplete;
    stop
  endif
  partition "Claim Investigation Process" {
    :Assign investigator;
    :Review claim details;
    :Interview witnesses if needed;
    :Gather evidence;
    :Prepare investigation report;
  }
  partition "Claim Resolution Process" {
    :Evaluate claim validity;
    if (Claim approved?) then (Yes)
      :Calculate payout amount;
      :Process payment;
    else (No)
      :Prepare denial letter;
      :Provide appeal instructions;
    endif
  }
endif

:Notify claimant of outcome;
stop

@enduml
Flowchart Best Practices
To maximize the effectiveness of your flowcharts, adhere to these twelve proven practices:
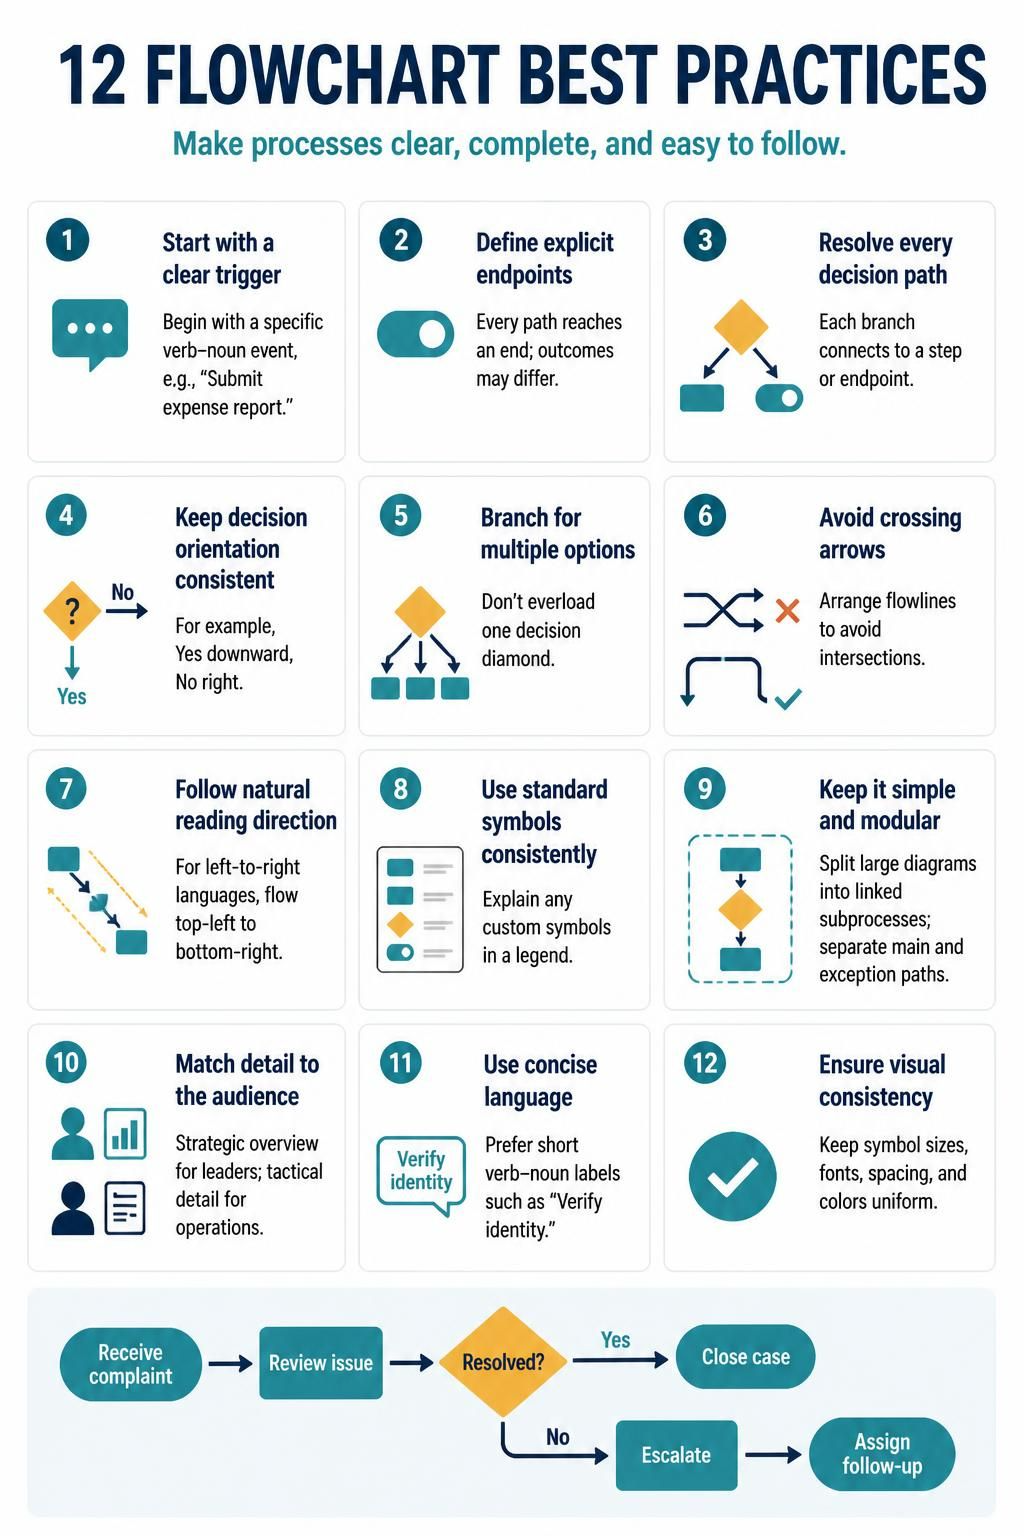
1. Start with a Clear Trigger
Every flowchart should begin with a specific initiating event expressed as a verb-noun phrase (e.g., “Submit expense report,” “Receive customer complaint”). This clarifies when the process begins.
2. Define Explicit Endpoints
Ensure every path leads to a terminal symbol. Complex processes may have multiple endpoints representing different outcomes (approved/rejected, resolved/escalated, etc.).
3. Resolve All Decision Paths
Never leave a decision point with an unresolved path. Every branch must connect to either another step or a terminal symbol.
4. Maintain Consistent Decision Orientation
Establish and follow a convention: for example, “Yes/True” always flows downward from decision diamonds, while “No/False” always flows to the right. This creates visual predictability.
5. Use Branching for Multi-Option Decisions
When facing more than two options, consider using a branching structure rather than overloading a single decision diamond. This improves readability and reduces complexity.
6. Avoid Crossing Arrows
Crossing flowlines create visual confusion. Reorganize your layout to ensure arrows flow cleanly without intersections. Modern diagramming tools can help automate this.
7. Follow Natural Reading Direction
For left-to-right languages, design flowcharts to flow from top-left to bottom-right. This aligns with natural reading patterns and improves comprehension.
8. Use Standard Symbols Consistently
Stick to universally recognized symbols. If you introduce custom symbols, provide a legend or key. Consistency reduces cognitive load for readers.
9. Keep It Simple and Modular
If a flowchart exceeds one page, break it into sub-processes. Identify the primary happy path and create separate diagrams for variations, exceptions, or detailed sub-tasks.
10. Match Detail Level to Audience
Senior leadership needs strategic overviews; operational teams need tactical detail. Create multiple versions of the same process at different granularity levels.
11. Use Concise Language
Employ verb-noun phrases (“Submit payment,” “Verify identity”) rather than lengthy descriptions. Reserve detailed explanations for accompanying documentation or callouts.
12. Ensure Visual Consistency
Maintain uniform symbol sizes, fonts, spacing, and colors throughout the diagram. Consistency enhances professionalism and readability.
Modern Tooling: Visual Paradigm Flowchart + VPasCode + AI
Why Visual Paradigm?
Visual Paradigm has emerged as a leading enterprise-grade diagramming platform that combines intuitive visual editing with powerful code-based generation capabilities. Its strengths include:
-
VPasCode Integration: Generate flowcharts programmatically using code, enabling version control, automation, and CI/CD integration
-
AI-Assisted Diagramming: Leverage AI to suggest optimizations, detect inconsistencies, and auto-generate diagrams from text descriptions
-
Enterprise Collaboration: Real-time co-editing, comment threads, and approval workflows
-
Standards Compliance: Support for BPMN, UML, ArchiMate, and other industry standards
-
Export Flexibility: Output to PNG, SVG, PDF, and embeddable web formats
Leveraging VPasCode for Programmatic Flowchart Generation
VPasCode allows you to define flowcharts using a structured syntax that can be version-controlled in Git, reviewed in pull requests, and generated automatically. This approach offers several advantages:
-
Reproducibility: Diagrams are generated from source code, ensuring consistency
-
Collaboration: Teams can review and modify flowcharts through code reviews
-
Automation: Integrate flowchart generation into documentation pipelines
-
Maintenance: Update processes by modifying code rather than manually redrawing diagrams
Example VPasCode snippet:
flowchart ExpenseApproval {
  start -> SubmitReport
  SubmitReport -> CheckAmount {
    amount <= 500 -> AutoApprove
    amount <= 5000 -> ManagerReview
    else -> DirectorReview
  }
  ManagerReview -> ManagerDecision {
    approved -> Approve
    rejected -> Reject
  }
  AutoApprove -> NotifyEmployee
  Approve -> NotifyEmployee
  Reject -> NotifyEmployee
  NotifyEmployee -> end
}
AI-Enhanced Flowchart Creation
Modern AI tools can accelerate flowchart development by:
-
Text-to-Diagram Conversion: Describe a process in natural language, and AI generates the initial flowchart structure
-
Optimization Suggestions: AI analyzes existing flowcharts and recommends simplifications, identifies potential bottlenecks, or suggests standardization opportunities
-
Anomaly Detection: Automatically flag unresolved decision paths, orphaned steps, or inconsistent symbol usage
-
Best Practice Enforcement: AI can enforce organizational standards for naming conventions, symbol usage, and layout principles
Integration with Development Workflows
For technical teams, integrating flowchart generation into development workflows provides significant benefits:
-
Store VPasCode files (i.e. PlantUML) in Git repositories alongside application code
-
Generate updated documentation automatically when processes change
-
Use flowcharts as living documentation that evolves with the system
-
Link flowchart elements to code modules for traceability
Practical Application Scenarios
Scenario 1: Process Standardization Across Departments
Challenge: Three regional offices handle customer complaints differently, leading to inconsistent service quality.
Solution:
-
Document each region’s current process using swim lane flowcharts
-
Identify best practices from each variant
-
Create a unified standard process flowchart
-
Distribute the standardized flowchart to all regions
-
Use the flowchart as a training tool and compliance reference
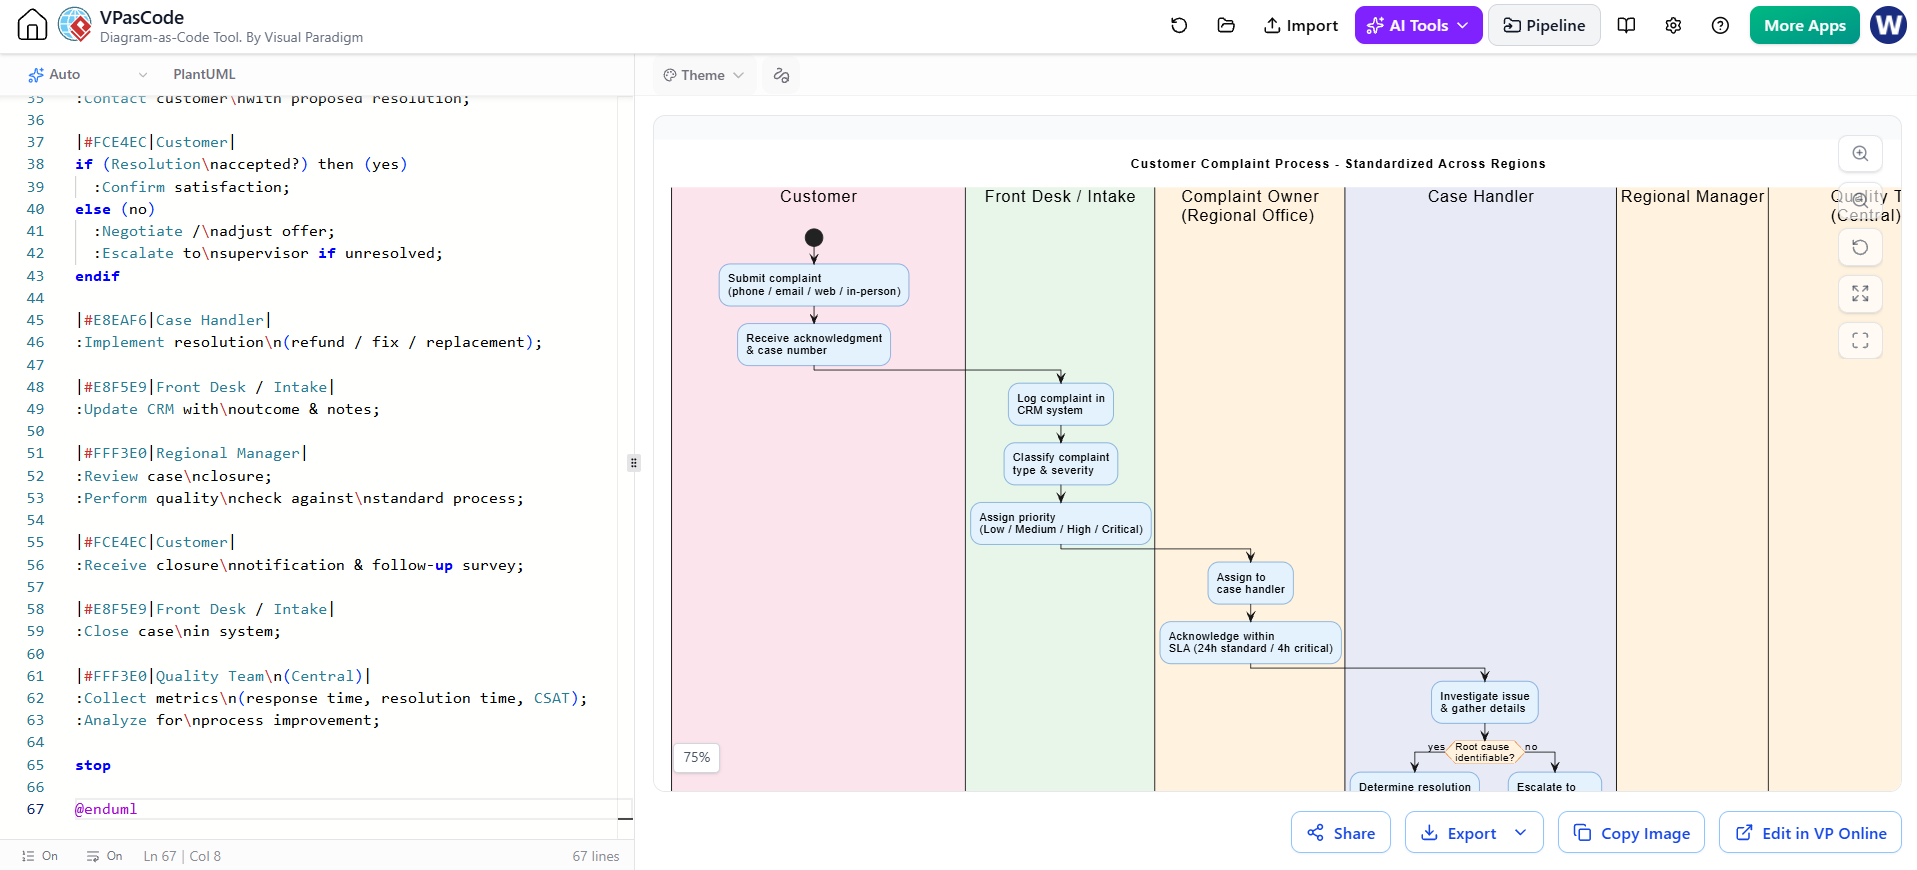
@startuml
title Customer Complaint Process - Standardized Across Regions

skinparam swimlaneBorderThickness 1
skinparam ActivityBackgroundColor #E3F2FD
skinparam ActivityBorderColor #1565C0
skinparam ActivityDiamondBackgroundColor #FFF3E0
skinparam ActivityDiamondBorderColor #EF6C00

|#FCE4EC|Customer|
start
:Submit complaint\n(phone / email / web / in-person);
:Receive acknowledgment\n& case number;

|#E8F5E9|Front Desk / Intake|
:Log complaint in\nCRM system;
:Classify complaint\ntype & severity;
:Assign priority\n(Low / Medium / High / Critical);

|#FFF3E0|Complaint Owner\n(Regional Office)|
:Assign to\ncase handler;
:Acknowledge within\nSLA (24h standard / 4h critical);

|#E8EAF6|Case Handler|
:Investigate issue\n& gather details;

if (Root cause\nidentifiable?) then (yes)
  :Determine resolution\n& corrective action;
else (no)
  :Escalate to\nsubject expert;
  :Investigate further;
endif

:Prepare resolution\noffer;
:Contact customer\nwith proposed resolution;

|#FCE4EC|Customer|
if (Resolution\naccepted?) then (yes)
  :Confirm satisfaction;
else (no)
  :Negotiate /\nadjust offer;
  :Escalate to\nsupervisor if unresolved;
endif

|#E8EAF6|Case Handler|
:Implement resolution\n(refund / fix / replacement);

|#E8F5E9|Front Desk / Intake|
:Update CRM with\noutcome & notes;

|#FFF3E0|Regional Manager|
:Review case\nclosure;
:Perform quality\ncheck against\nstandard process;

|#FCE4EC|Customer|
:Receive closure\nnotification & follow-up survey;

|#E8F5E9|Front Desk / Intake|
:Close case\nin system;

|#FFF3E0|Quality Team\n(Central)|
:Collect metrics\n(response time, resolution time, CSAT);
:Analyze for\nprocess improvement;

stop

@endumlScenario 2: Bottleneck Identification
Challenge: Order fulfillment takes 5 days on average, but management believes it should take 2 days.
Solution:
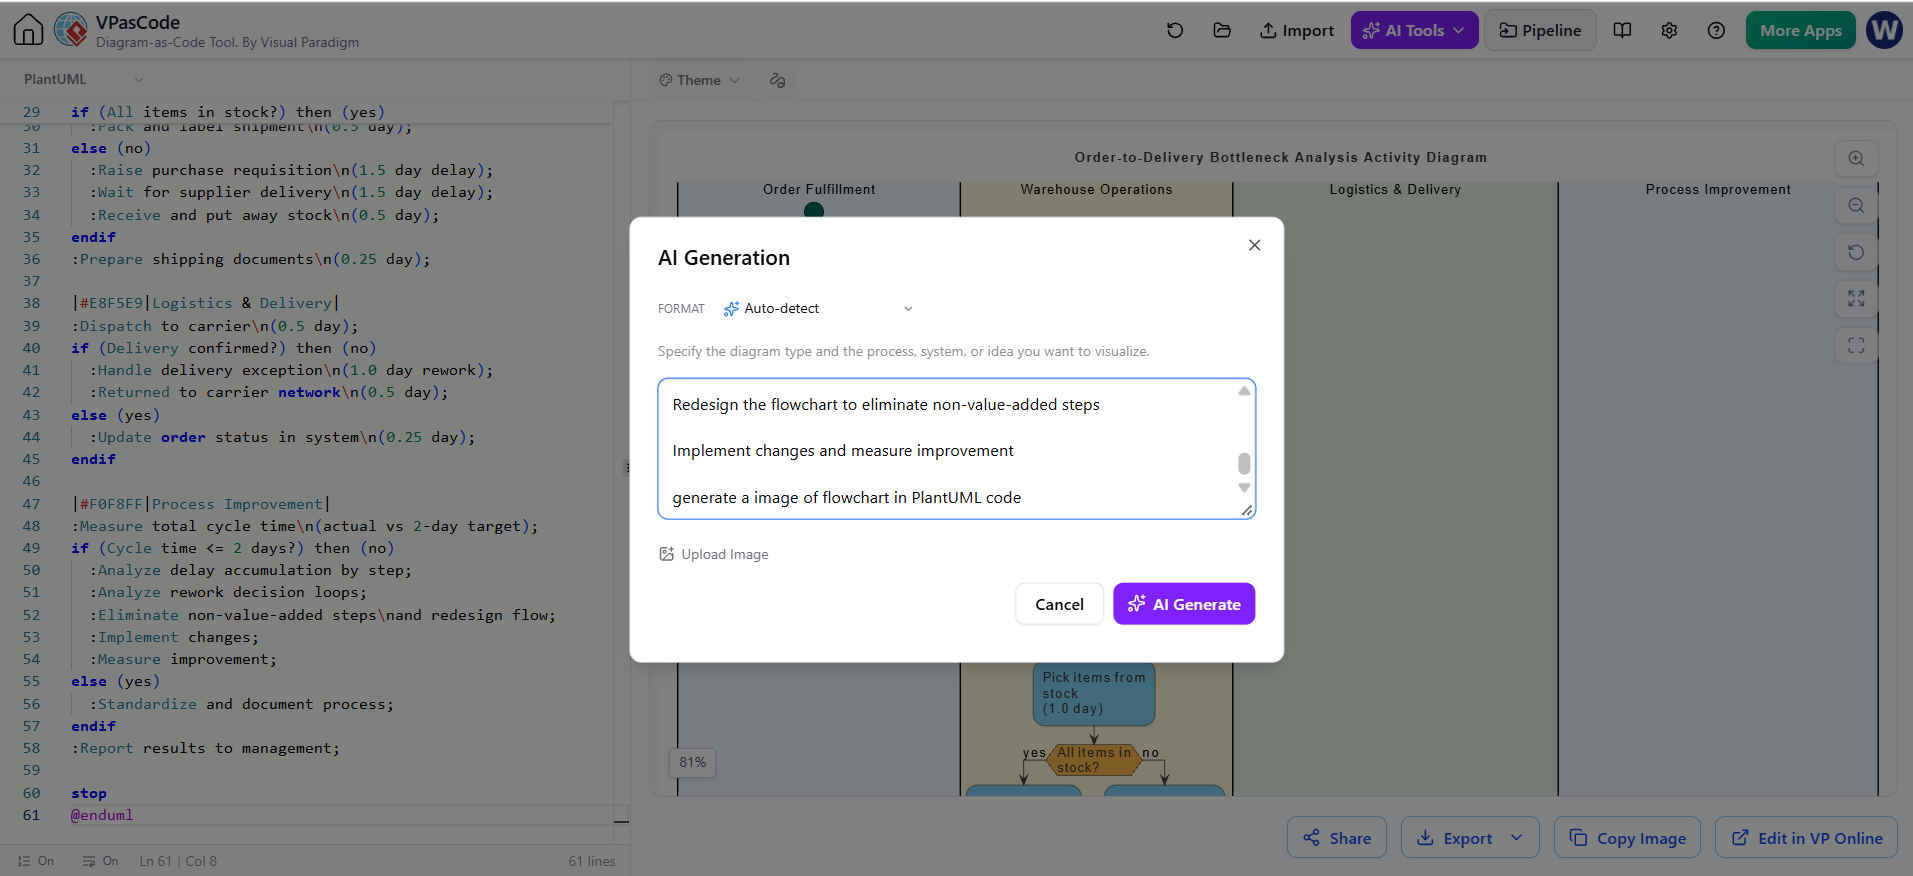
Generate the Flowchart with VPasCode’s embedded AI Assisted Generator:
-
Map the complete order-to-delivery process in detail
-
Add time estimates to each process step
-
Identify steps where delays accumulate
-
Analyze decision points causing rework loops
-
Redesign the flowchart to eliminate non-value-added steps
-
Implement changes and measure improvement
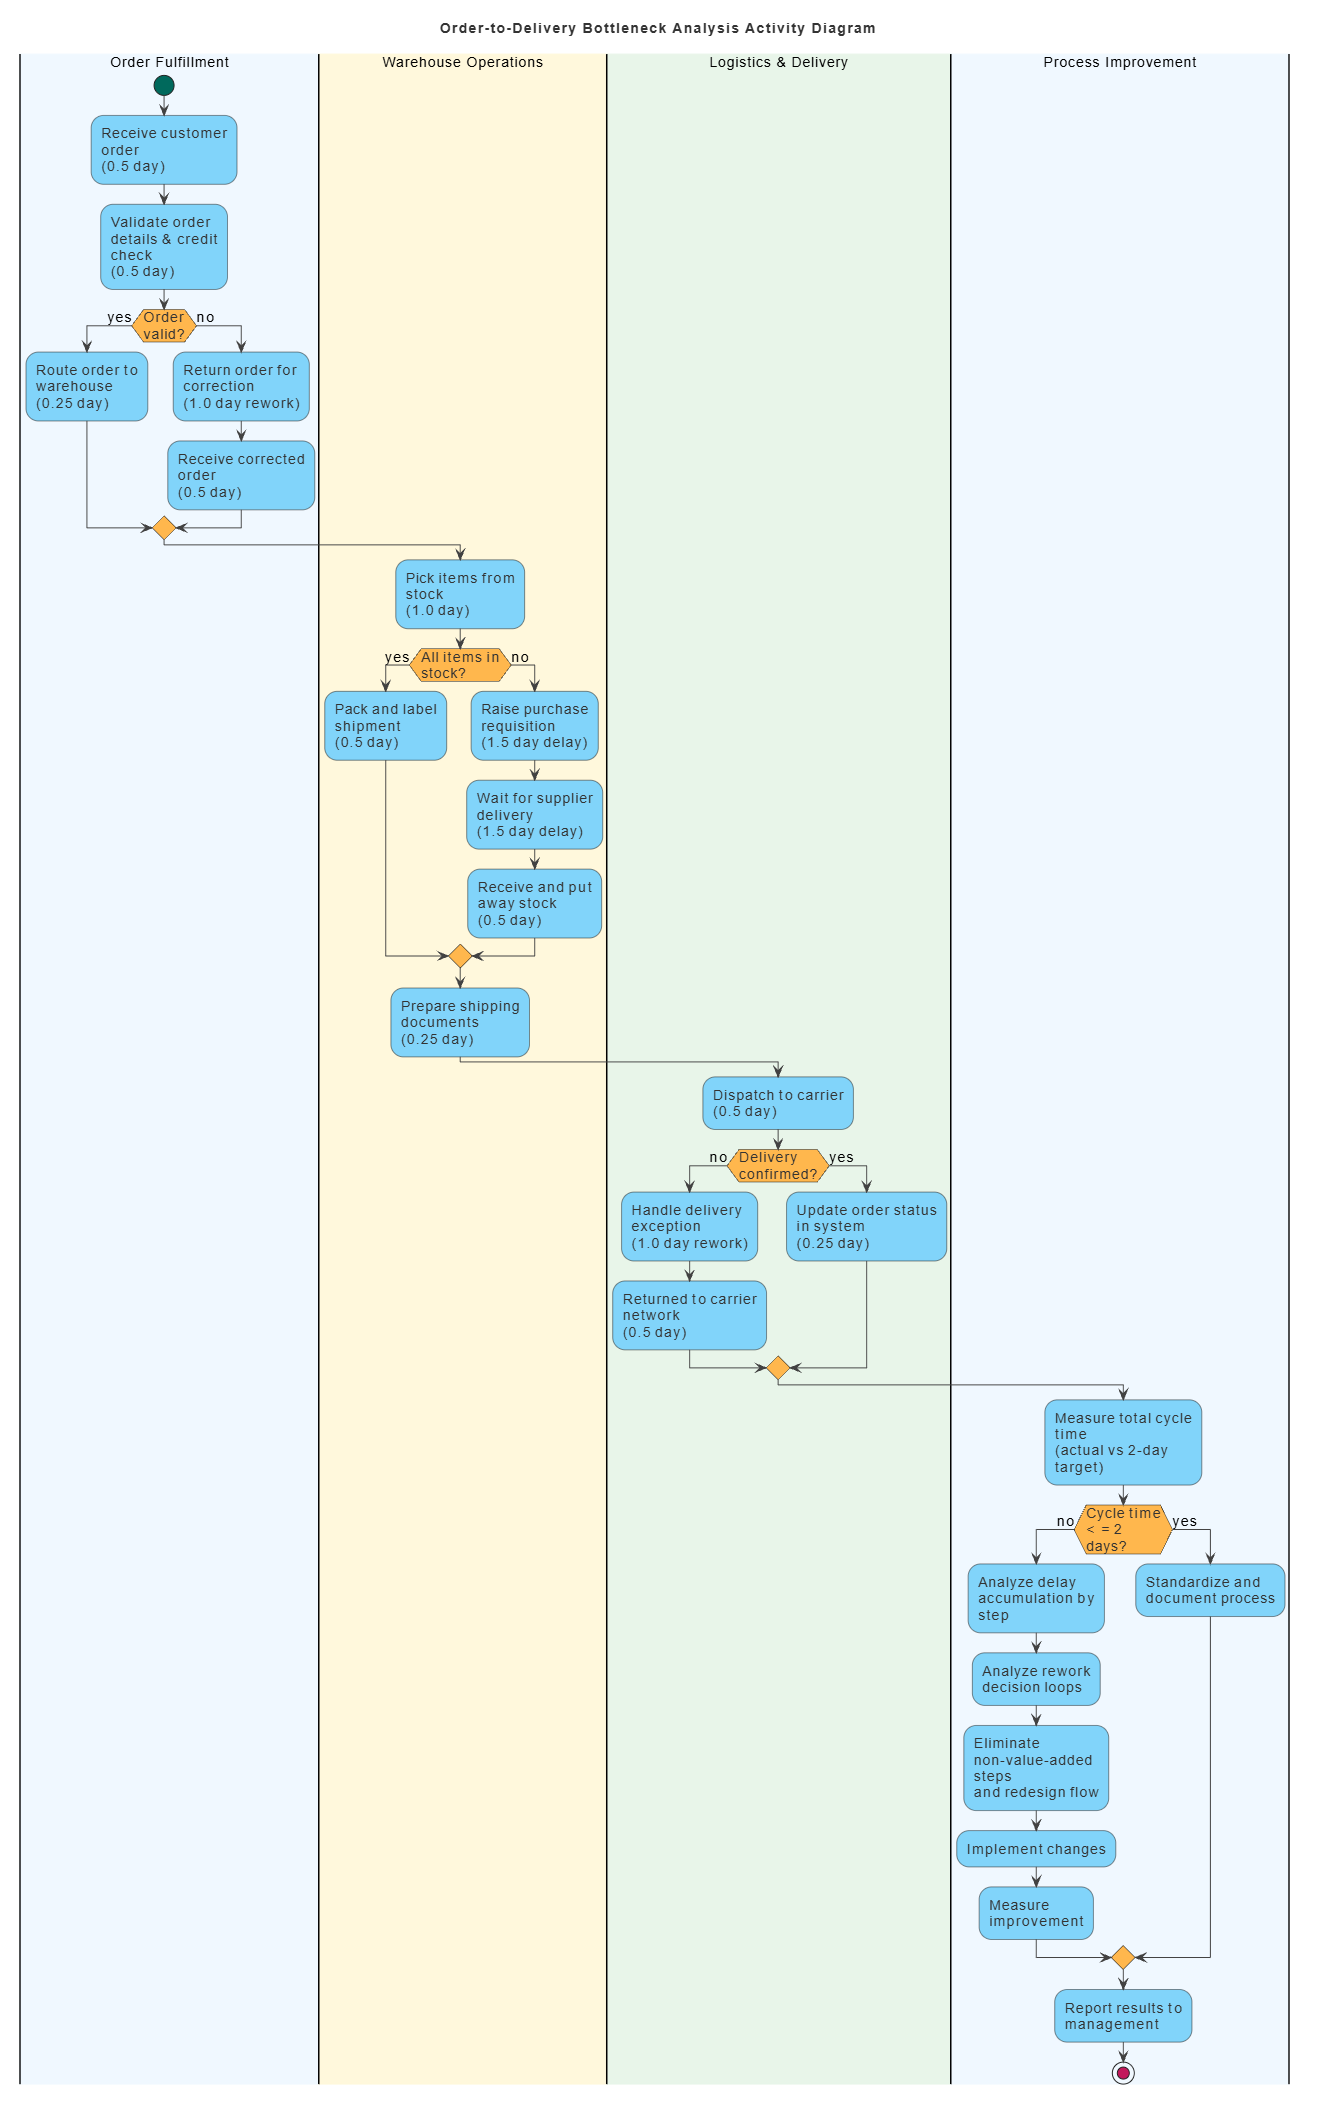
@startuml
skinparam defaultFontSize 14
skinparam defaultFontColor #333333
<style>
  element { MaximumWidth 100 }
  start   { Backgroundcolor #00695C }
  stop    { Backgroundcolor #C2185B }
  activity{ Backgroundcolor #81D4FA; MaximumWidth 150 }
  diamond { Backgroundcolor #FFB74D; MaximumWidth 80 }
  arrow   { LineColor #424242; Fontcolor #000000 }
  swimlane{ Fontcolor #000000; FontSize 14 }
</style>

title Order-to-Delivery Bottleneck Analysis Activity Diagram

|#F0F8FF|Order Fulfillment|
start
:Receive customer order\n(0.5 day);
:Validate order details & credit check\n(0.5 day);
if (Order valid?) then (yes)
  :Route order to warehouse\n(0.25 day);
else (no)
  :Return order for correction\n(1.0 day rework);
  :Receive corrected order\n(0.5 day);
endif

|#FFF8DC|Warehouse Operations|
:Pick items from stock\n(1.0 day);
if (All items in stock?) then (yes)
  :Pack and label shipment\n(0.5 day);
else (no)
  :Raise purchase requisition\n(1.5 day delay);
  :Wait for supplier delivery\n(1.5 day delay);
  :Receive and put away stock\n(0.5 day);
endif
:Prepare shipping documents\n(0.25 day);

|#E8F5E9|Logistics & Delivery|
:Dispatch to carrier\n(0.5 day);
if (Delivery confirmed?) then (no)
  :Handle delivery exception\n(1.0 day rework);
  :Returned to carrier network\n(0.5 day);
else (yes)
  :Update order status in system\n(0.25 day);
endif

|#F0F8FF|Process Improvement|
:Measure total cycle time\n(actual vs 2-day target);
if (Cycle time <= 2 days?) then (no)
  :Analyze delay accumulation by step;
  :Analyze rework decision loops;
  :Eliminate non-value-added steps\nand redesign flow;
  :Implement changes;
  :Measure improvement;
else (yes)
  :Standardize and document process;
endif
:Report results to management;

stop
@endumlScenario 3: New Employee Onboarding
Challenge: New hires report confusion about who does what during their first week.
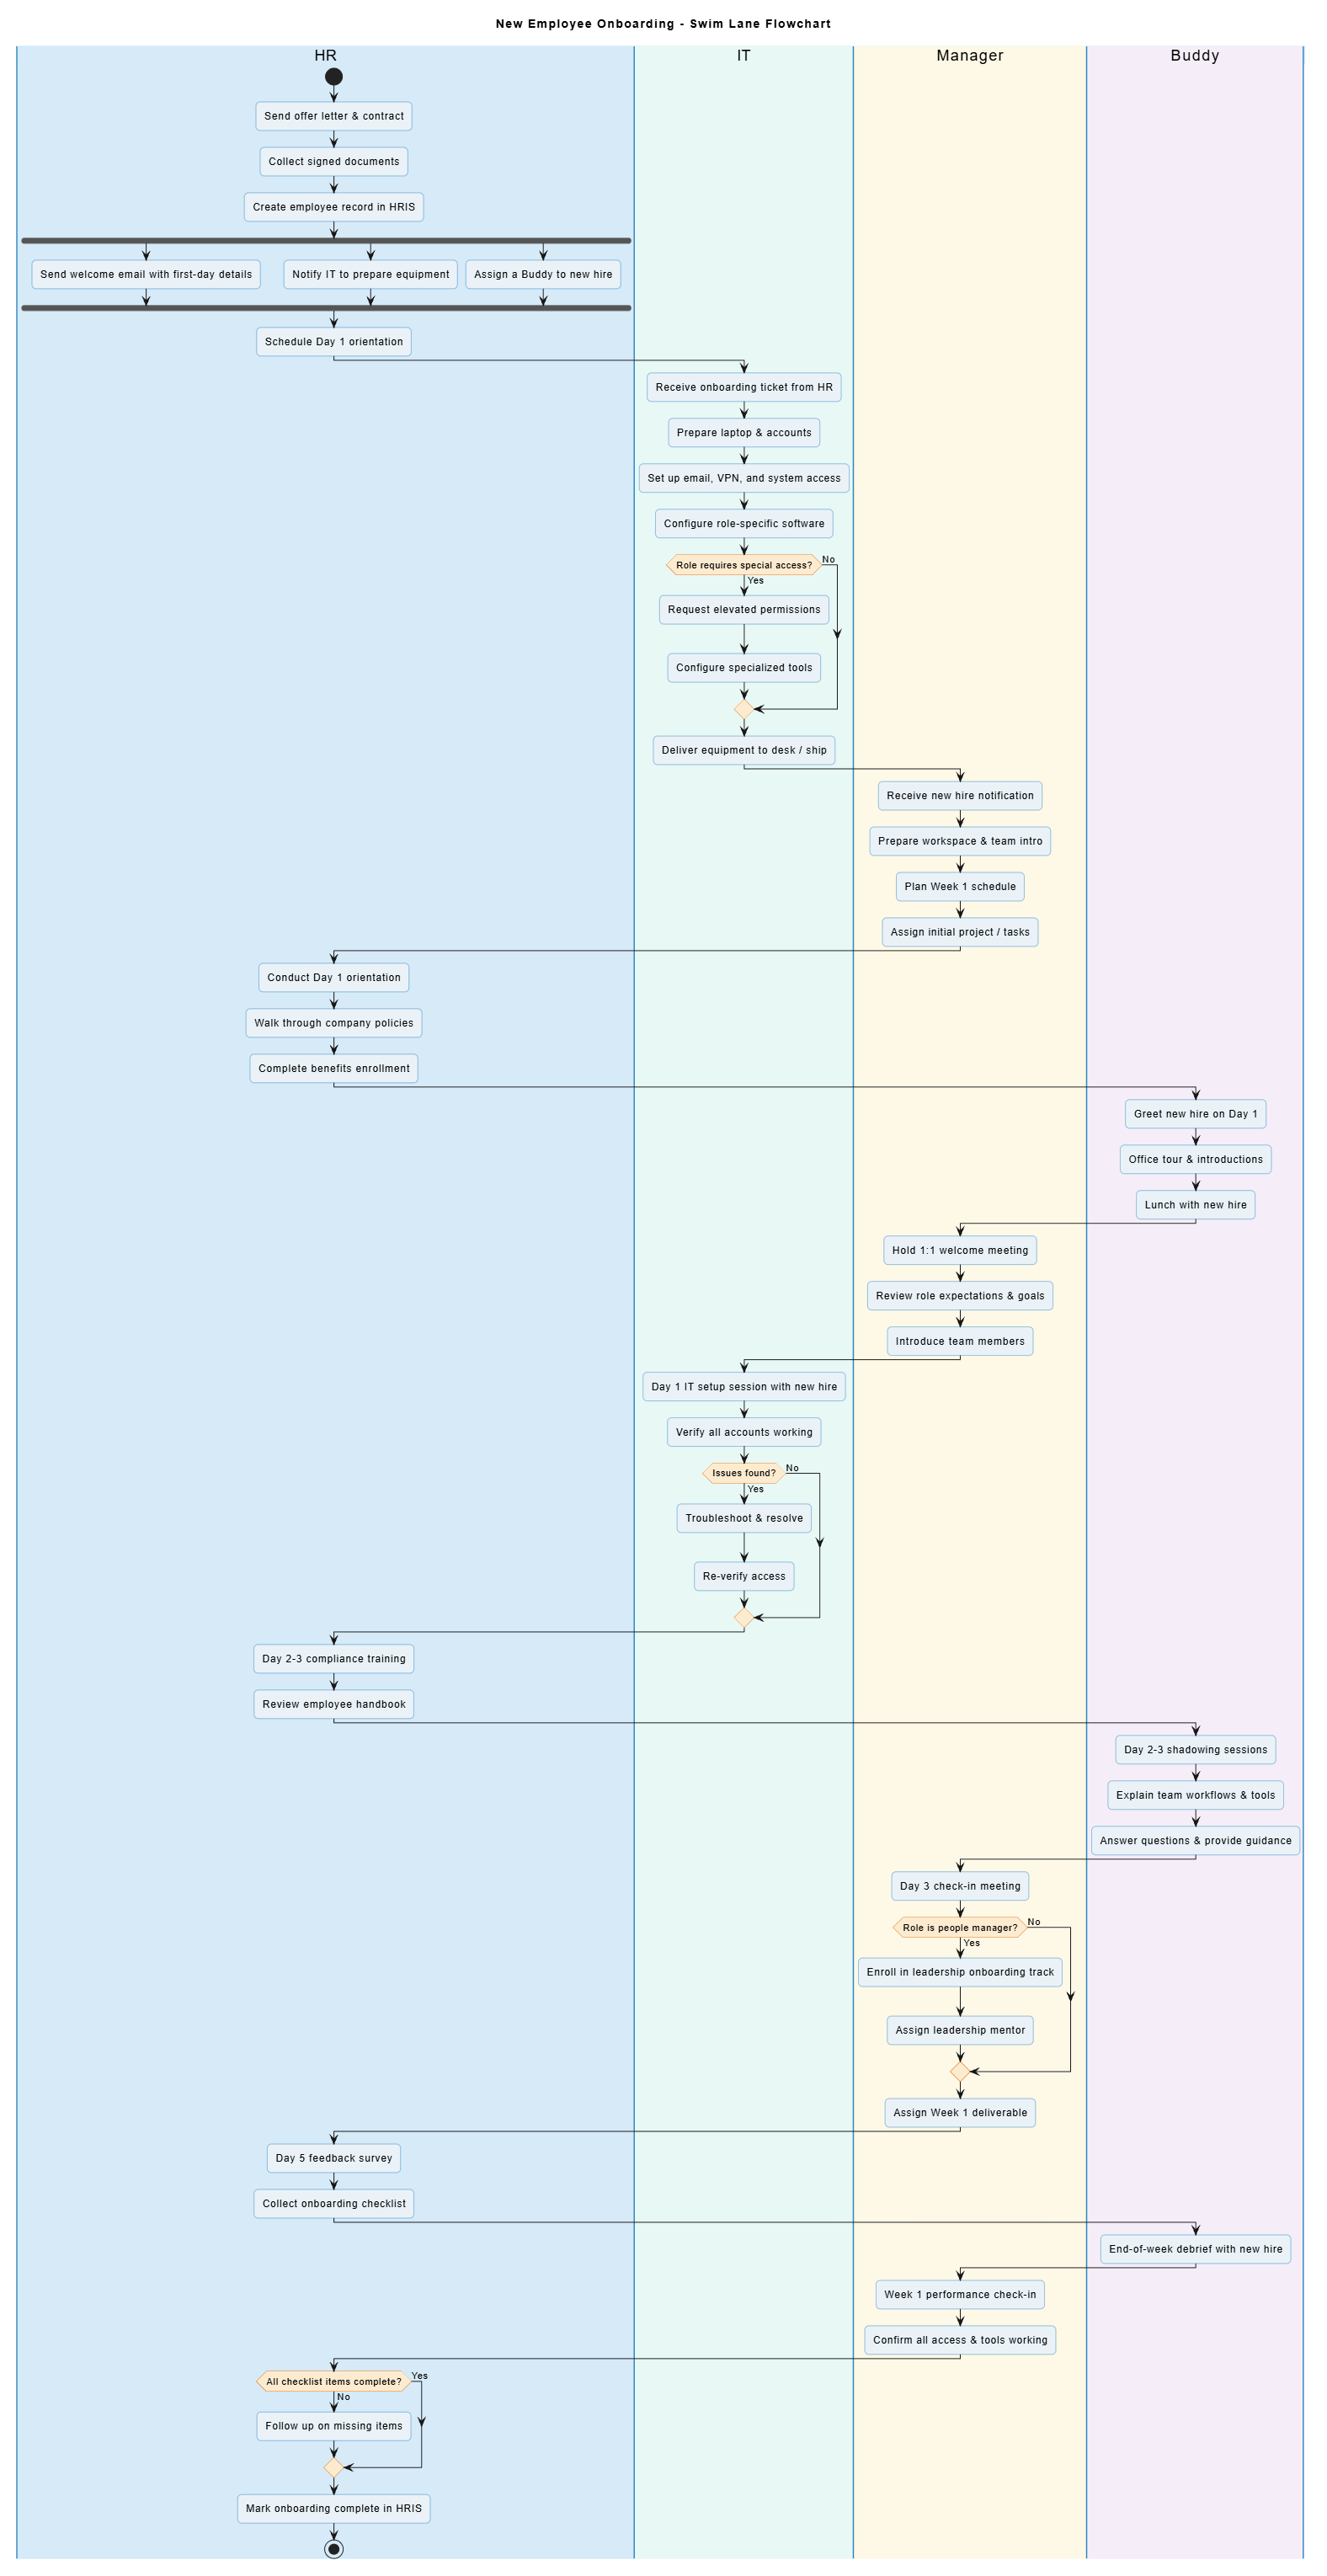
Solution:
-
Create a swim lane flowchart showing HR, IT, Manager, and Buddy responsibilities
-
Sequence activities chronologically with clear handoffs
-
Include decision points for role-specific variations
-
Publish the flowchart in the employee handbook
-
Use it as a checklist to ensure no steps are missed
@startuml
title New Employee Onboarding - Swim Lane Flowchart

skinparam defaultTextAlignment center
skinparam shadowing false
skinparam roundcorner 10
skinparam swimlaneBorderColor #2E86C1
skinparam swimlaneTitleBackgroundColor #D6EAF8
skinparam ActivityBackgroundColor #EAF2F8
skinparam ActivityBorderColor #2E86C1
skinparam ActivityDiamondBackgroundColor #FDEBD0
skinparam ActivityDiamondBorderColor #E67E22

|#D6EAF8|HR|
|#E8F8F5|IT|
|#FEF9E7|Manager|
|#F5EEF8|Buddy|

|HR|
start
:Send offer letter & contract;
:Collect signed documents;
:Create employee record in HRIS;

fork
  :Send welcome email with first-day details;
fork again
  :Notify IT to prepare equipment;
fork again
  :Assign a Buddy to new hire;
end fork

:Schedule Day 1 orientation;

|IT|
:Receive onboarding ticket from HR;
:Prepare laptop & accounts;
:Set up email, VPN, and system access;
:Configure role-specific software;

if (Role requires special access?) then (Yes)
  :Request elevated permissions;
  :Configure specialized tools;
else (No)
endif

:Deliver equipment to desk / ship;

|Manager|
:Receive new hire notification;
:Prepare workspace & team intro;
:Plan Week 1 schedule;
:Assign initial project / tasks;

|HR|
:Conduct Day 1 orientation;
:Walk through company policies;
:Complete benefits enrollment;

|Buddy|
:Greet new hire on Day 1;
:Office tour & introductions;
:Lunch with new hire;

|Manager|
:Hold 1:1 welcome meeting;
:Review role expectations & goals;
:Introduce team members;

|IT|
:Day 1 IT setup session with new hire;
:Verify all accounts working;

if (Issues found?) then (Yes)
  :Troubleshoot & resolve;
  :Re-verify access;
else (No)
endif

|HR|
:Day 2-3 compliance training;
:Review employee handbook;

|Buddy|
:Day 2-3 shadowing sessions;
:Explain team workflows & tools;
:Answer questions & provide guidance;

|Manager|
:Day 3 check-in meeting;

if (Role is people manager?) then (Yes)
  :Enroll in leadership onboarding track;
  :Assign leadership mentor;
else (No)
endif

:Assign Week 1 deliverable;

|HR|
:Day 5 feedback survey;
:Collect onboarding checklist;

|Buddy|
:End-of-week debrief with new hire;

|Manager|
:Week 1 performance check-in;
:Confirm all access & tools working;

|HR|
if (All checklist items complete?) then (No)
  :Follow up on missing items;
else (Yes)
endif

:Mark onboarding complete in HRIS;

stop

@enduml
Common Pitfalls to Avoid
-
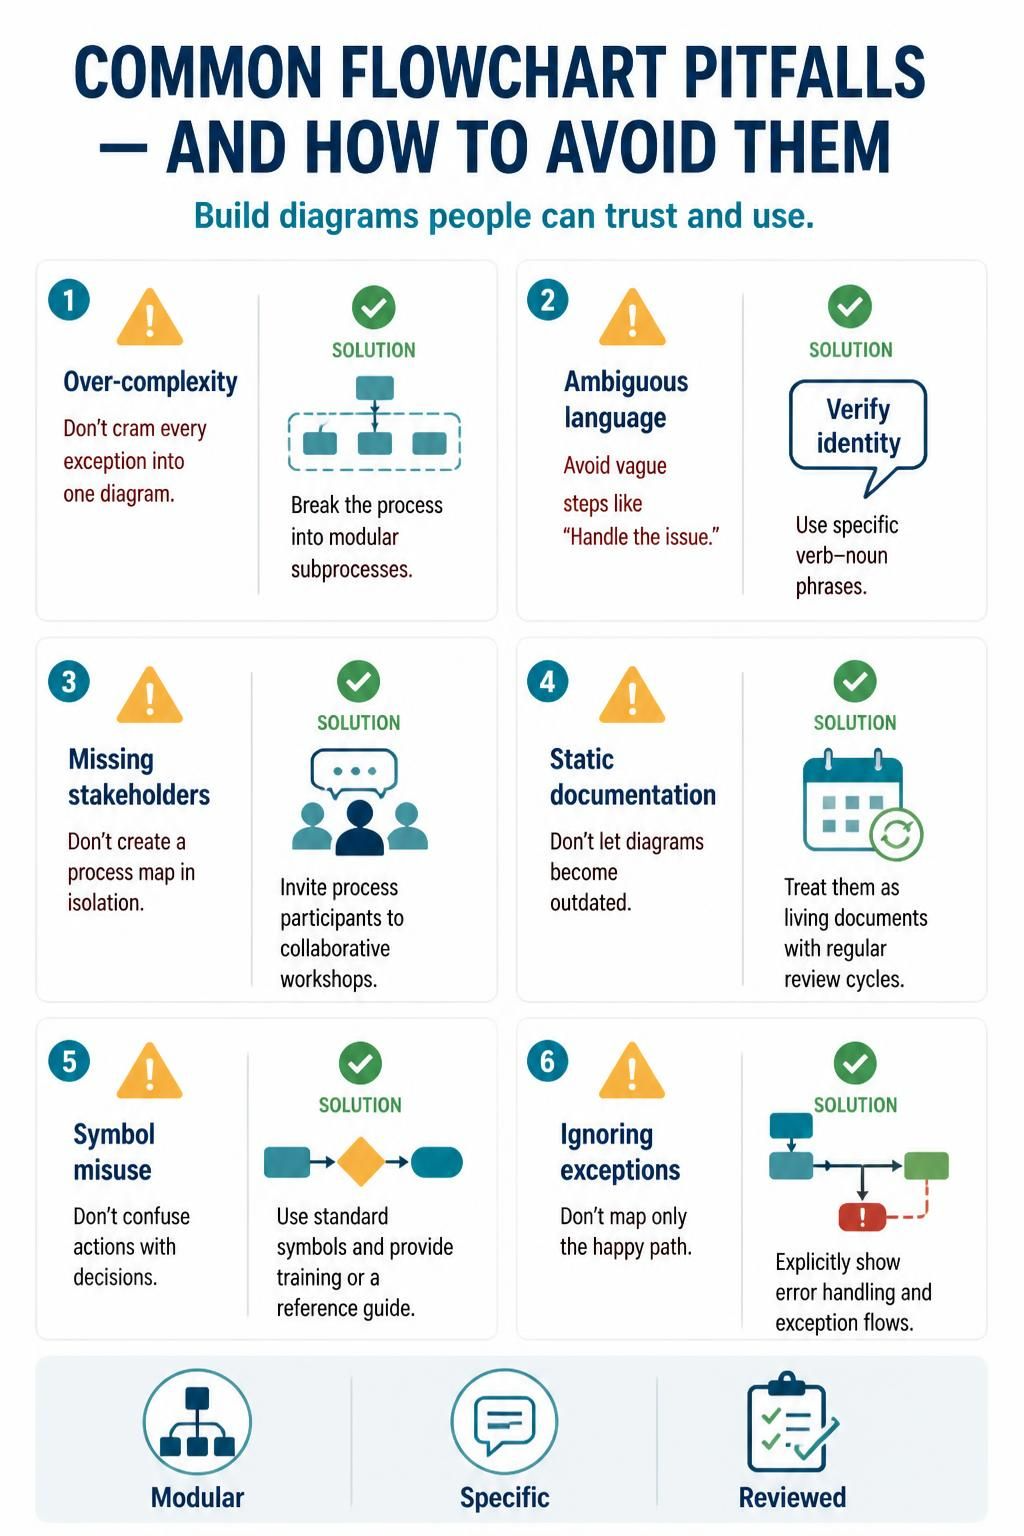
Over-Complexity: Trying to capture every exception in one diagram. Solution: Use sub-processes and modular design.
-
Ambiguous Language: Vague step descriptions like “Handle the issue.” Solution: Use specific verb-noun phrases.
-
Missing Stakeholders: Failing to involve process participants in flowchart creation. Solution: Conduct collaborative workshops.
-
Static Documentation: Creating flowcharts that quickly become outdated. Solution: Treat flowcharts as living documents with regular review cycles.
-
Symbol Misuse: Using incorrect symbols for actions vs. decisions. Solution: Provide training and reference guides.
-
Ignoring Exceptions: Only mapping the “happy path.” Solution: Explicitly document error handling and exception flows.
Conclusion
Flowcharting remains one of the most accessible yet powerful tools in the Business Process Management toolkit. By transforming abstract workflows into visual representations, flowcharts enable organizations to achieve shared understanding, identify improvement opportunities, and standardize operations across teams and departments.
The key to effective flowcharting lies not in artistic prowess but in disciplined adherence to best practices: starting with clear triggers, maintaining consistent symbolism, matching detail levels to audiences, and keeping diagrams modular and readable. Modern tools like Visual Paradigm, enhanced with VPasCode capabilities and AI assistance, make it easier than ever to create, maintain, and collaborate on professional-quality flowcharts.
Whether you’re optimizing a simple approval workflow or orchestrating complex multi-departmental processes, remember that the ultimate value of a flowchart is measured by its usability. A flowchart that stakeholders can understand, trust, and act upon is a flowchart that drives real business value.
Start simple, iterate based on feedback, and let your flowcharts evolve alongside your processes. In doing so, you’ll transform process documentation from a bureaucratic obligation into a strategic asset that powers continuous improvement and operational excellence.