


Investors review hundreds of proposals. They do not have time for vague promises or ambitious narratives without structural support. When a founder presents a Business Model Canvas, it serves as the foundational logic of the venture. It translates a vision into an operational reality. This document answers the critical question: How does this business create, deliver, and capture value?
Investors scrutinize every block of the canvas to assess risk, scalability, and coherence. They are looking for evidence that the founder understands the mechanics of the industry. They want to see that the revenue model aligns with the cost structure. They want to verify that the value proposition solves a genuine problem for a specific group of customers.
This guide details the specific elements investors analyze within the canvas. It outlines the signals of a robust model and the warning signs of a fragile one. Understanding these criteria allows founders to prepare a document that withstands rigorous due diligence.
1. Value Proposition: The Core of the Logic 💡
The Value Proposition block is the heart of the canvas. It defines the bundle of products and services that create value for a specific customer segment. Investors do not look for generic statements like “better” or “faster.” They look for differentiation that is defensible.
When analyzing this block, investors ask specific questions:
- Is the problem real? Does the solution address a pain point that customers are actively trying to solve?
- Is the solution unique? Why will customers switch from existing alternatives?
- Is the benefit tangible? Can the value be measured in time saved, money earned, or risk reduced?
A strong value proposition avoids ambiguity. It clearly states the specific benefit. For example, instead of “we offer efficient logistics,” a stronger statement is “we reduce last-mile delivery costs by 40% for urban retailers.” Investors prefer specificity over abstraction.
They also examine the Fit. Does the value proposition match the customer segment? A mismatch here indicates a fundamental flaw in the strategy. If the canvas suggests a premium product but targets price-sensitive students, the model is internally inconsistent.
2. Customer Segments: Who Pays? 👥
Revenue cannot exist without a defined customer. The Customer Segments block identifies the different groups of people or organizations an enterprise aims to reach and serve. Investors analyze this section to determine market size and accessibility.
Key indicators of a healthy segment include:
- Specificity: Broad segments like “everyone” are red flags. Investors want to know the exact profile of the buyer.
- Accessibility: Can the business actually reach these customers through defined channels?
- Willingness to Pay: Is there a proven history of spending in this segment?
Investors also look for Market Segmentation strategies. Are there multiple segments? If so, which one is the beachhead? A clear path to a primary segment demonstrates focus. Diversifying too early often dilutes resources and confuses the market message.
They assess the Customer Lifecycle as well. Are you targeting one-time buyers or recurring users? Recurring segments often command higher valuations due to predictable revenue streams.
3. Revenue Streams: How Money Flows 💰
The Revenue Streams block represents the cash a company generates from each customer segment. This is the most scrutinized area because it dictates financial viability. Investors want to see a clear path to profitability.
They evaluate the Pricing Mechanisms:
- Fixed Pricing: Simple to understand, but may leave money on the table.
- Dynamic Pricing: Adapts to demand, but requires robust data infrastructure.
- Subscription: Predictable cash flow, but requires high retention.
- Freemium: Low barrier to entry, but high conversion costs.
Investors calculate the Unit Economics here. They look at the relationship between the Lifetime Value (LTV) of a customer and the Customer Acquisition Cost (CAC). If the revenue stream relies on constant reinvestment to acquire new users without increasing retention, the model is unsustainable.
They also check for Revenue Concentration. If 80% of revenue comes from one client, the risk is high. A diversified revenue stream across multiple segments indicates resilience against market shifts.
4. Cost Structure: Efficiency and Scalability 📉
Revenue is vanity, profit is sanity. The Cost Structure block outlines the most important costs incurred to operate a business model. Investors analyze this to gauge operational efficiency.
They distinguish between:
- Fixed Costs: Salaries, rent, software licenses that remain constant regardless of output.
- Variable Costs: Costs that change with production volume, such as hosting fees or transaction fees.
The goal is to see Scalability. As revenue grows, do costs grow linearly, or does the cost per unit decrease? A business with high fixed costs and low variable costs often scales more efficiently once the break-even point is reached.
Investors also look for Cost Drivers. What are the primary factors driving costs? Is it human capital, technology, or raw materials? A heavy reliance on expensive human capital without automation can limit growth potential.
| Cost Characteristic | Investor Perspective |
|---|---|
| High Fixed Costs | Higher risk initially, but potential for high margins later. |
| High Variable Costs | Lower risk, but harder to scale margins. |
| Uncontrolled Burn Rate | Red Flag. Indicates poor financial discipline. |
| Efficient Unit Costs | Green Flag. Shows operational maturity. |
5. Key Resources and Activities: The Engine ⚙️
The Value Proposition is delivered through Key Resources and Key Activities. Resources are the assets required to offer and deliver the previously described elements. Activities are the most important things the company must do to make its business model work.
Investors look for Barriers to Entry within this section. Does the business own proprietary technology? Does it have exclusive partnerships? Does it have a unique brand reputation?
They assess Operational Complexity. If the Key Activities require constant manual intervention, the business may struggle to scale. Automation and technology-driven activities signal a modern approach to operations.
They also evaluate Talent Density. Are the resources human capital? If so, is the team capable of executing the strategy? A strong team with a weak model is better than a weak team with a strong model, but the canvas must show how resources are deployed.
6. Channels and Relationships: Reach and Retention 📣
Channels describe how a company communicates with and reaches its customer segments. Relationships describe the types of relationships a company establishes with specific customer segments.
Investors analyze Channel Efficiency:
- Owned Channels: Website, email list. High control, high effort.
- Partner Channels: Retailers, affiliates. Lower control, lower effort.
- Marketplaces: Amazon, App Store. High traffic, high fees.
The choice of channel impacts the Cost Structure and Revenue Streams. A channel with high fees reduces margins. A channel with low reach increases acquisition costs.
Regarding Relationships, investors look for Retention Strategies. Is the relationship personal (dedicated support) or automated (self-service)? Personal relationships are harder to scale but often lead to higher loyalty. Automated relationships are scalable but require excellent product quality.
They also check for Customer Support Costs. If the relationship block requires 24/7 human support for a low-cost product, the economics do not work.
7. Key Partnerships: Leverage and Risk 🤝
The Key Partners block outlines the network of suppliers and partners that make the business model work. Investors look for strategic alignment in partnerships.
They evaluate the Dependency Risk:
- Supplier Reliance: Does the business depend on a single vendor for critical components?
- Platform Risk: Does the business rely on a third-party platform (e.g., Google, Facebook) for traffic?
Strong partnerships can accelerate growth. They can provide distribution, technology, or funding. However, investors want to see that the company maintains control over its core value creation.
They also look for Competitive Moats created through partnerships. Exclusive agreements can prevent competitors from accessing the same resources.
8. Coherence and Logic: The Whole Picture 🧩
Beyond individual blocks, investors look at the connections between them. The canvas is a system. If one block changes, others must adjust.
For example, if a company wants to offer a premium product (Value Proposition), it cannot have a low-cost distribution channel (Channels) that dilutes the brand image. The model must be internally consistent.
Investors use the canvas to spot Logical Gaps:
- Does the revenue model support the cost of acquiring the customer?
- Does the technology capability match the service promise?
- Do the partnerships align with the strategic goals?
A coherent canvas reduces perceived risk. It shows that the founder has thought through the implications of their strategy.
Common Investor Red Flags in the Canvas 🚩
While every business is unique, certain patterns consistently raise concerns. Recognizing these can help founders avoid pitfalls during the pitch process.
- Vague Value Proposition: Using buzzwords without explaining the mechanism of value.
- Undefined Target Audience: Claiming to serve “everyone” without segmentation.
- Unrealistic Pricing: Pricing significantly below market without a clear cost advantage.
- High Customer Acquisition Costs: Showing that CAC exceeds LTV in the financial logic.
- Over-reliance on External Factors: Assuming future market conditions will solve current operational issues.
- Missing Key Activities: Failing to identify the essential work required to deliver the promise.
Preparing for Due Diligence with Your Canvas 🔍
When an investor shows interest, they will perform due diligence. The canvas is the starting point for this investigation. To prepare:
- Verify Assumptions: Ensure every block is backed by data or validated learning.
- Update Metrics: Keep the Revenue and Cost blocks updated with actuals, not just projections.
- Document Changes: If the model has pivoted, document why and how the canvas changed.
- Stress Test: Ask “What if” questions for each block. What if a partner leaves? What if costs double?
Investors appreciate transparency. If the model has weaknesses, address them proactively in the accompanying narrative. Hiding flaws in the canvas often leads to lost trust.
Strategic Alignment with Market Trends 📈
Investors also look for alignment with broader market trends. The canvas should reflect the current economic environment.
- Sustainability: Does the model account for environmental or social impact?
- Digital Transformation: Is the business leveraging technology to reduce costs or improve reach?
- Regulatory Compliance: Does the model account for legal requirements in the target market?
A model that ignores trends is a model that is already outdated. Investors want to see that the business is future-proofed.
Final Considerations on Model Maturity 🏗️
The state of the canvas often reflects the maturity of the company. Early-stage startups may have a high degree of uncertainty in the Cost and Revenue blocks. Later-stage companies should show detailed granularity.
Investors adjust their expectations based on this maturity. They do not expect a seed-stage company to have perfect unit economics. They do expect clarity on the path to achieving them.
The canvas is a living document. It should evolve as the business learns. Presenting a static canvas suggests a lack of adaptability. Presenting a canvas that shows iterative improvement demonstrates a learning organization.
Summary of Investor Expectations ✅
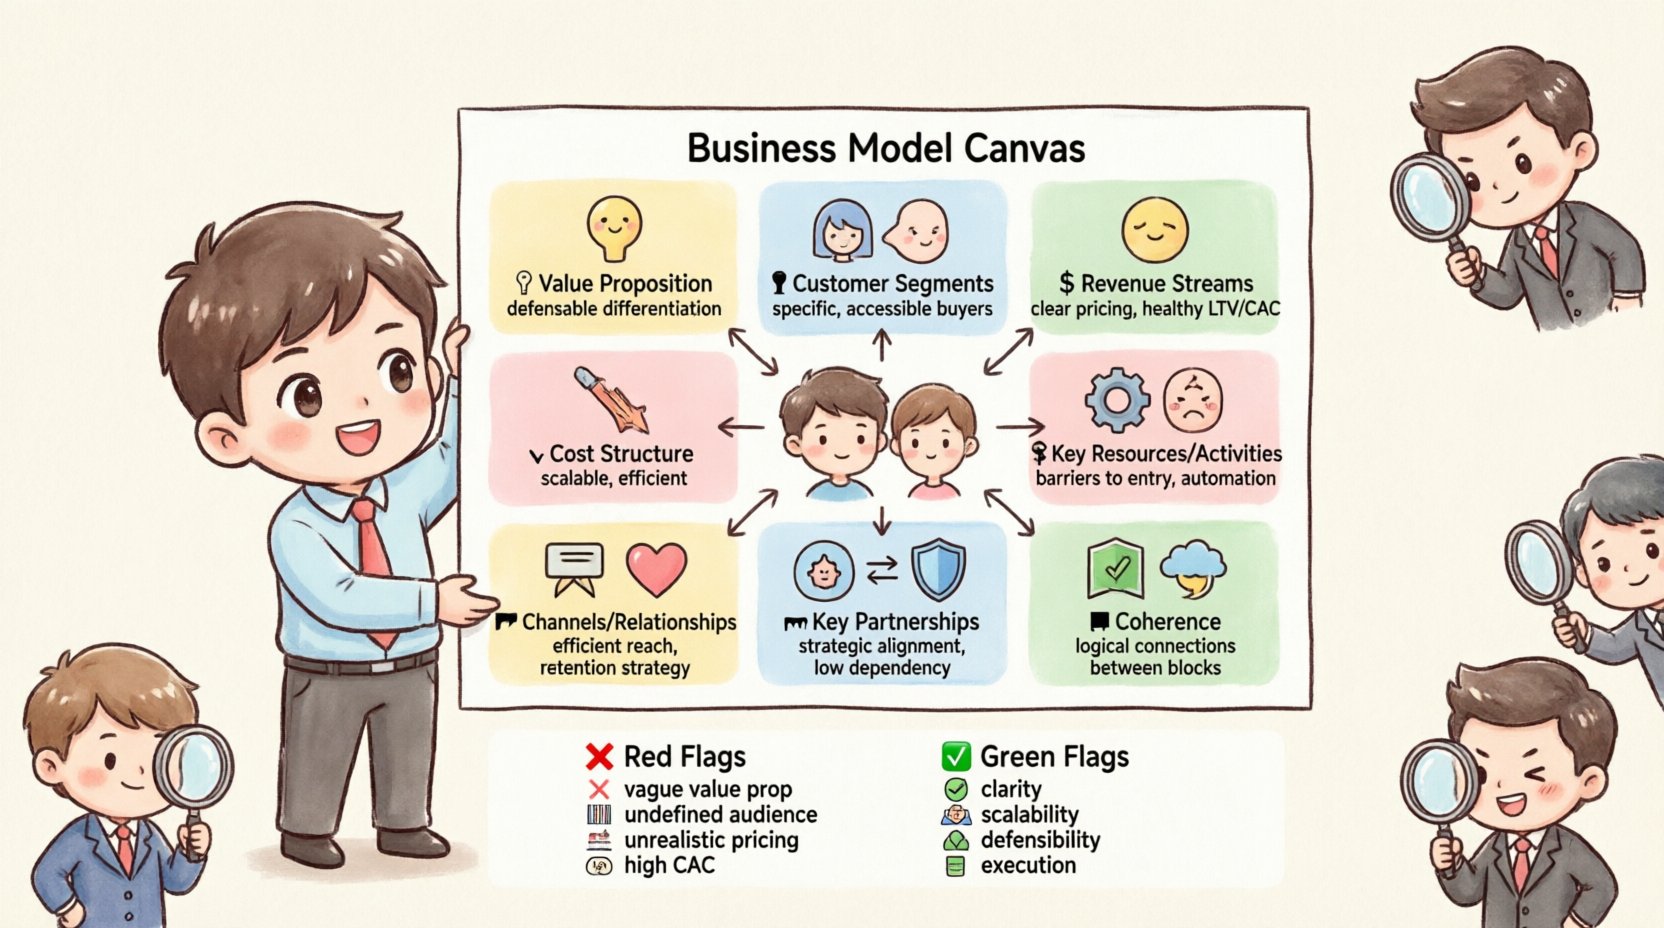
To summarize, investors use the Business Model Canvas to de-risk their investment. They are looking for:
- Clarity: A clear understanding of how the business works.
- Logic: Consistent connections between value, cost, and revenue.
- Scalability: The ability to grow without proportional cost increases.
- Defensibility: Barriers that protect the business from competition.
- Execution: A realistic plan for delivering the value.
By addressing these areas systematically, founders can create a canvas that commands confidence. The goal is not just to fill the boxes, but to tell a story of viability. When the logic holds up under scrutiny, the investment decision becomes a matter of timing and fit, rather than doubt about the fundamentals.
Investors invest in teams that understand their own business. The canvas is the proof of that understanding. Ensure every block is filled with intention. Ensure every connection is drawn with evidence. This approach transforms the canvas from a diagram into a strategic asset.

