


As software architectures become increasingly complex, the need for precise modeling tools intensifies. Among the Unified Modeling Language (UML) suite, the Composite Structure Diagram stands out for its ability to visualize the internal makeup of a classifier. While often overshadowed by sequence or class diagrams, its role is fundamental when designing systems where composition, delegation, and interaction are critical. This guide explores the trajectory of this diagram type, moving from static representations to dynamic, intelligent modeling capabilities.
Understanding the Core Anatomy of Composite Structure Diagrams 🧩
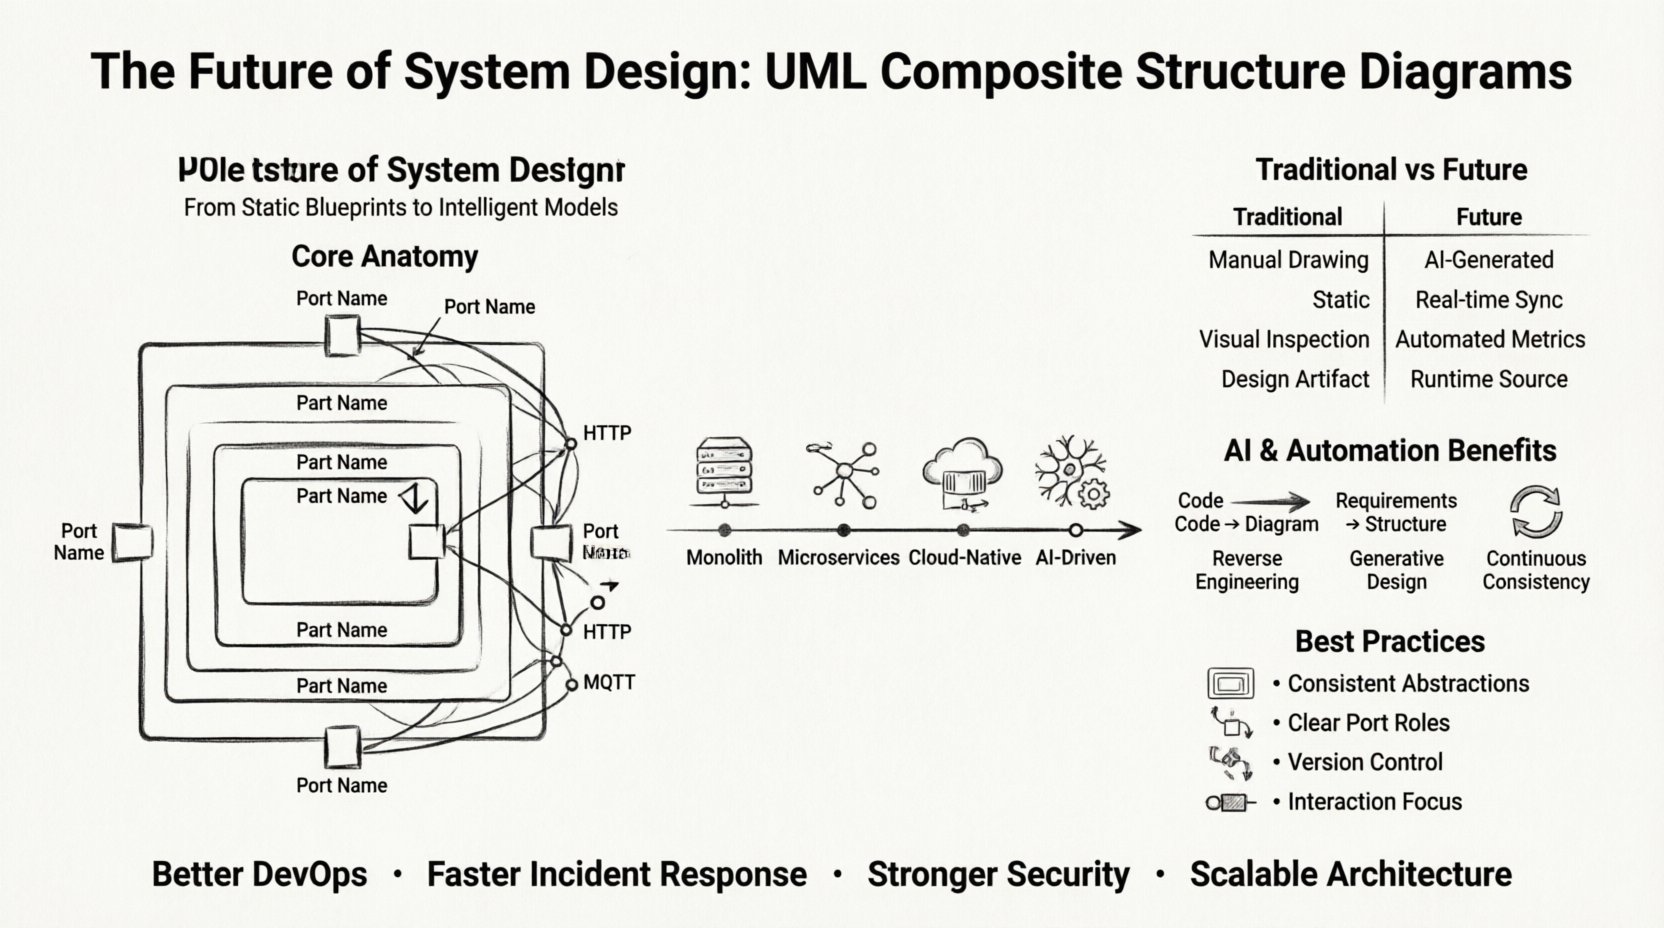
Before projecting into the future, we must establish a firm grasp of the present. A Composite Structure Diagram depicts the internal structure of a classifier, such as a class or component. It breaks down the system into parts, interfaces, and connections.
- Parts: These represent the instances of other classifiers that make up the whole. They show aggregation and composition relationships.
- Ports: Defined interfaces through which a part interacts with the outside world. They manage the flow of data and control signals.
- Connectors: These link ports together, defining how parts communicate internally.
- Interaction Points: Specific locations where protocols or messages are exchanged between components.
In traditional modeling, these diagrams served as blueprints for developers. They answered the question: “How do these pieces fit together inside the black box?” Today, the answer requires more than static lines. Modern systems demand dynamic visibility.
Why This Diagram Matters in Complex Systems 🏗️
Monolithic applications often hid their internal complexity. Modern distributed systems, however, expose their internal structure to the developer and the operations team. The Composite Structure Diagram provides the necessary granularity.
1. Clarifying Component Boundaries
When teams build microservices or modular monoliths, understanding the boundary between a component and its dependencies is vital. This diagram explicitly maps:
- Which parts are mandatory for the system to function.
- Which parts are optional or pluggable.
- How failure in one part affects the whole.
2. Defining Interface Contracts
Ports serve as the contract between the internal logic and external consumers. By modeling these ports:
- API changes can be anticipated before code is written.
- Versioning strategies for internal services become clearer.
- Security boundaries are visually represented at the port level.
3. Visualizing Data Flow Internally
While sequence diagrams show time-based interaction, composite structure diagrams show structural interaction. They answer questions about data ownership. If a piece of data moves from Part A to Part B, is it copied or referenced? The diagram helps define these architectural decisions.
The Shift from Monoliths to Distributed Architectures ☁️
The rise of cloud-native computing has changed how we apply UML. In the past, a class was a file. Today, a class might be a container, a serverless function, or a database instance. The Composite Structure Diagram must adapt to this reality.
Physical vs. Logical Representation
Historically, these diagrams were logical. They described what a system did. Now, they must describe where it lives. The future involves integrating deployment information directly into the structure diagram.
| Traditional Approach | Modern Cloud-Native Approach |
|---|---|
| Logical classes represented as boxes. | Logical classes mapped to Kubernetes Pods or Containers. |
| Connections represent method calls. | Connections represent network traffic or message queues. |
| Static relationships. | Dynamic relationships based on scaling and load. |
| Manual updates for deployment. | Automated updates via Infrastructure as Code. |
This shift means the diagram is no longer just a design document. It becomes a source of truth for deployment pipelines. If the diagram changes, the infrastructure configuration must reflect that change automatically.
Integration with Model-Based Systems Engineering (MBSE) 📊
MBSE is gaining traction in industries like automotive, aerospace, and healthcare. These sectors require rigorous verification and validation. The Composite Structure Diagram fits well here because it handles complexity.
Requirements Traceability
Each part or port can be linked back to a specific requirement. If a requirement changes regarding safety, the engineer can trace it to the specific port that handles the safety signal. This traceability is crucial for compliance.
Simulation and Verification
Future modeling tools will allow simulation based on the structure diagram. Instead of writing code first, engineers can simulate the flow of data between ports to identify bottlenecks or race conditions. This shifts testing left in the development lifecycle.
- Static Analysis: Checking for unused parts or dead connectors.
- Dynamic Simulation: Running the model to see latency between parts.
- Constraint Checking: Ensuring the architecture meets resource limits.
Future Capabilities: AI and Automation 🤖
The most significant evolution lies in automation. Manual modeling is prone to errors and falls out of sync with code. Artificial Intelligence (AI) and Machine Learning (ML) will bridge this gap.
Reverse Engineering
AI tools will analyze existing codebases and generate Composite Structure Diagrams automatically. This is particularly useful for legacy modernization. Engineers can visualize the current state of a complex system without reading thousands of lines of code.
- Pattern Recognition: Identifying common architectural patterns like Facade or Adapter.
- Dependency Mapping: Automatically detecting how modules depend on each other.
- Refactoring Suggestions: Proposing structural changes to improve cohesion.
Generative Design
Conversely, AI can generate the initial structure based on high-level requirements. A user specifies “I need a system that handles 10,000 concurrent users with low latency.” The tool suggests a composite structure with load balancers, caching layers, and database sharding.
Continuous Consistency
As code is pushed to a repository, the model should update automatically. If a developer adds a new class, the diagram updates. If a class is deleted, the diagram reflects that. This eliminates the “documentation drift” that plagues large projects.
Best Practices for Modern Implementation 🛠️
To leverage these diagrams effectively in a future-focused environment, teams must adopt specific practices. These are not just guidelines but necessary disciplines for maintainability.
1. Keep Abstractions Consistent
Do not mix high-level business logic with low-level implementation details in the same diagram. Use nested composite structures. A high-level view shows the main services. Clicking into a service reveals its internal composite structure.
2. Define Port Roles Clearly
Ports should have clear roles (e.g., “Client” or “Server”). This clarifies the direction of data flow. Ambiguity here leads to race conditions and security vulnerabilities.
3. Version Control the Diagrams
Treat diagrams as code. Store them in the same repository as the source code. Use branching strategies for architectural changes. This ensures that if a release is reverted, the architecture reverts with it.
4. Focus on Interaction, Not Just Structure
A static picture of parts is not enough. The diagram must hint at interaction. Use notation to show which ports are active during which states. This adds the dimension of time to the spatial representation.
Challenges in Adoption ⚠️
Despite the benefits, widespread adoption faces hurdles. Recognizing these challenges helps in planning for the future.
- Learning Curve: Understanding ports and connectors requires training. Many developers are comfortable with class diagrams but find composite structures abstract.
- Tooling Maturity: While many tools support basic UML, advanced features for composite structures are often clunky or proprietary.
- Scalability: A system with hundreds of components can result in a diagram that is too large to read. Aggregation and filtering features are essential.
- Cultural Resistance: Agile teams often prefer lightweight documentation. Convincing them that a detailed structural diagram adds value requires demonstrating ROI.
Comparison: Traditional vs. Future State 📈
To visualize the progress, consider the following comparison of how these diagrams are used today versus how they will be used in the near future.
| Feature | Traditional Usage | Future State |
|---|---|---|
| Creation | Manual drawing in tools. | Generated from code or requirements. |
| Updates | Manual synchronization with code. | Real-time synchronization. |
| Analysis | Visual inspection. | Automated metrics and alerts. |
| Deployment | Design time artifact only. | Runtime configuration source. |
| Collaboration | Static PDF or image sharing. | Interactive, multi-user model editing. |
Implications for DevOps and Site Reliability Engineering (SRE) 🛡️
The line between development and operations is blurring. Composite Structure Diagrams play a key role in this convergence.
Incident Response
When a system fails, SRE teams need to know where the failure originated. A well-maintained composite structure diagram helps pinpoint the failing port or part quickly. It acts as a map for troubleshooting.
Capacity Planning
By analyzing the connections between parts, teams can identify bottlenecks. If Part A feeds Part B, and Part B is slow, Part A is the upstream cause. The diagram helps visualize this dependency chain.
Security Architecture
Security teams can review the diagram to ensure that sensitive data does not pass through unsecured ports. It provides a high-level view of the trust boundaries within the system.
Final Thoughts on Architectural Evolution 🌟
The trajectory of UML Composite Structure Diagrams points toward integration, automation, and intelligence. They are evolving from static documentation into dynamic models that drive the software lifecycle. As systems grow in complexity, the need to understand their internal composition becomes non-negotiable.
Teams that invest in mastering these modeling techniques today will find themselves better equipped to handle the architectural challenges of tomorrow. The goal is not to create diagrams for the sake of diagrams, but to create models that serve the system. When the model drives the code and the code updates the model, we achieve a level of consistency that traditional methods cannot match.
Keep an eye on the tools emerging in this space. Look for platforms that support real-time collaboration and automated validation. The future of system design is not just about drawing lines; it is about defining the logic of the system in a way that machines can understand and execute.

