


Introduction
In the rapidly evolving landscape of software architecture, speed and precision are paramount. As systems become more complex—spanning microservices, IoT devices, and distributed hardware—the need to visualize internal structures has never been greater. Enter Visual Paradigm Desktop, now enhanced with a groundbreaking feature: AI-powered Composite Structure Diagram generation.
This guide serves as an absolutely beginner-friendly, step-by-step tutorial that walks you through how to leverage this new capability. Whether you’re a seasoned architect or just starting out in UML modeling, this review will show you why Visual Paradigm stands out, how to use its AI tools effectively, and how it can transform your workflow—from concept to canvas—in seconds.

We’ll also explore real-world use cases, key benefits, tips for maximizing efficiency, and even suggest ways to boost your business visibility using flipbook tracking via Google Analytics (more on that later). Let’s dive in.
Product & Feature Review: Why Visual Paradigm Stands Out
What Is a Composite Structure Diagram?
Before we jump into the AI magic, let’s clarify what we’re generating. A Composite Structure Diagram is a type of UML diagram used to depict the internal structure of a classifier (like a class or component), showing how parts, ports, and connectors interact at runtime. It’s essential for modeling:
-
Internal collaborations between components
-
Runtime behavior of systems
-
Physical or logical decomposition of modules
Traditionally, creating these diagrams manually was time-consuming and error-prone. That’s where Visual Paradigm’s AI comes in.
Key Features of the AI Generator
1. Instant Architecture Visualization
Describe your system in plain English—e.g., “A PaymentProcessor with validator, gateway, and logger communicating through defined ports”—and watch as the AI generates a fully structured diagram complete with parts, ports, and connectors.
✅ Benefit: Eliminates manual drawing; reduces setup time by up to 80%.
2. Conversational Refinement
After initial generation, refine your model conversationally:
-
Rename elements
-
Add attributes
-
Create new connections (“Connect booking details to room under hotel”)
💡 Tip: Use natural language commands like “Add a port named ‘auth’ to the UserModule” — the AI understands context!
3. Model Consistency Across Diagrams
The AI cross-references existing Class Diagrams to ensure consistency in properties, relationships, and naming conventions across your entire project.
Who Benefits? Teams working on large-scale projects needing alignment between design layers.
4. Automated Layout Optimization
No more tangled lines or overlapping shapes. The AI intelligently arranges internal connectors and communication flows for maximum clarity.
⚙️ Pro Trick: After auto-layout, fine-tune manually if needed—but start clean every time.
Step-by-Step Tutorial: How to Generate Your First AI-Powered Composite Structure Diagram
Follow these four simple steps within Visual Paradigm Desktop:
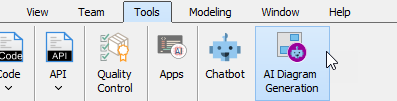
Step 1: Open AI Diagram Generation Tool
Navigate to the top menu bar → Select Tools > AI Diagram Generation
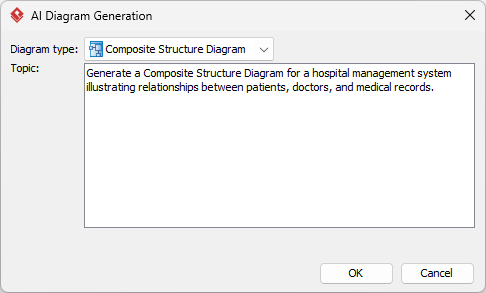
Step 2: Choose Diagram Type
From the dropdown list, select Composite Structure Diagram
Step 3: Enter Your Prompt
Type a clear description of your desired structure. Example:
“Generate a Composite Structure Diagram for a hospital management system illustrating relationships between patients, doctors, and medical records.”
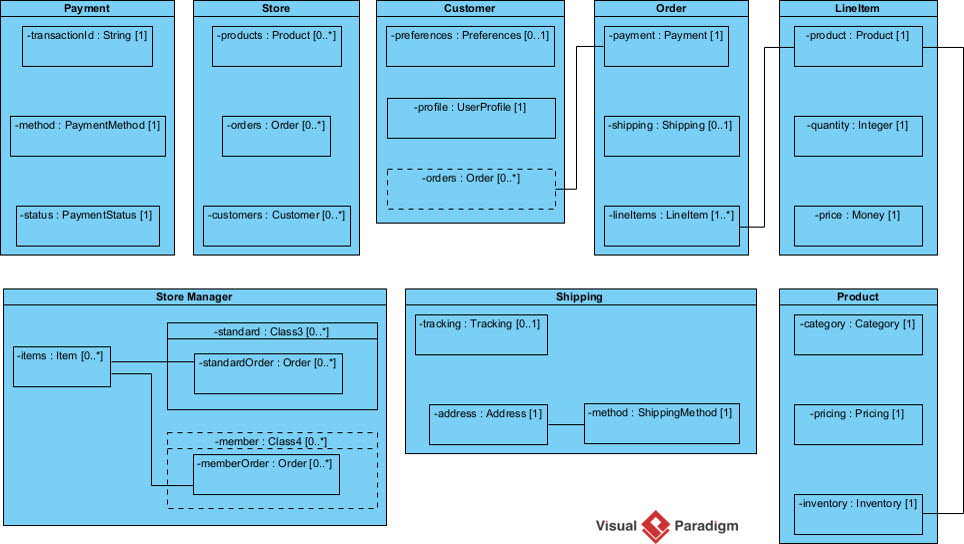
Step 4: Click OK & Watch Magic Happen
Click OK, wait a few seconds, and voilà—you have a professionally laid-out composite structure diagram ready for editing or presentation.
You can now edit, annotate, export, or integrate this diagram into documentation—all within Visual Paradigm’s robust environment.
Alternative Access Points: Beyond Desktop
While Desktop offers full control, Visual Paradigm provides multiple entry points for different workflows:
Option A: OpenDocs / Online Editor
Inside any document editor:
→ Go to Insert > Diagrams > Composite Structure Diagram
→ Click Create with AI button (top right)
→ Input prompt → Generate → Embed directly into docs
Perfect for technical writers embedding live diagrams into specifications or reports.
Option B: Standalone AI Chatbot
Visit https://chat.visual-paradigm.com/diagram/uml-composite-structure-diagram/
Use conversational interface to draft diagrams → Export → Import into VP Desktop/OpenDocs for refinement.
Ideal for quick prototyping or collaborative brainstorming sessions.
Real-World Use Cases: Where This Shines
1. Software Design – Microservice Internals
Model subcomponents inside controllers or services:
“Show me the internal structure of an OrderService with InventoryChecker, PaymentGateway, and NotificationHandler connected via async ports.”
2. IoT Systems – Device Collaboration
Visualize sensor networks and processors within embedded devices:
“Diagram a smart thermostat with temperature sensor, WiFi module, cloud connector, and local display—all interacting through defined interfaces.”
3. Hardware Configurations – Physical Component Mapping
Map physical chips, buses, memory units, and I/O ports:
“Create a composite view of a Raspberry Pi board showing CPU, RAM, GPIO pins, USB controller, and their interconnections.”
These aren’t hypotheticals—they’re actual prompts users are successfully deploying today.
Tips, Tricks & Best Practices
✅ Be Specific But Concise: Avoid vague terms like “make something cool.” Instead, say “show data flow from API Gateway to Auth Service to Database Layer.”
✅ Iterate Rapidly: Don’t aim for perfection on first try. Generate → Refine → Regenerate until satisfied.
✅ Leverage Existing Models: If you already have Class Diagrams, reference them explicitly: “Based on my existing Customer class, generate its internal runtime structure.”
✅ Export Early, Often: Save versions after each major iteration. You may want to compare layouts or revert changes.
✅ Collaborate Visually: Share generated diagrams with stakeholders early—even non-technical ones—to validate assumptions before coding begins.
Boost Business Traffic Using Flipbook Tracking + Google Analytics
Want to turn your beautifully generated diagrams into marketing assets? Here’s how:
Strategy Overview:
Convert your final diagrams into interactive flipbooks (using tools like Flipsnack, Issuu, or Adobe InDesign + PDF export) and embed them on your website/blog. Then track engagement using Google Analytics.
Why It Works:
Flipbooks increase dwell time, reduce bounce rates, and encourage social sharing—all signals Google loves for SEO ranking.
Implementation Steps:
-
Export your Composite Structure Diagram as high-res PNG/PDF.
-
Upload to flipbook platform → Get embed code.
-
Insert into blog post or landing page titled:
“How We Designed Our Microservice Architecture Using AI-UML Tools”
-
Set up GA Event Tracking:
-
Track clicks on flipbook player
-
Measure scroll depth within flipbook
-
Monitor referral traffic sources
-
-
Optimize based on metrics: Which diagrams get most views? Which prompts yield best results? Replicate success!
💰 Economical Advantage: No paid ads required. Just valuable content + analytics = organic growth engine.
📈 Result: Increased authority, backlinks, lead gen—all fueled by your own intellectual output.
Conclusion: The Future of Modeling Is Here
Visual Paradigm’s integration of AI into Composite Structure Diagram creation isn’t just incremental—it’s revolutionary. By transforming natural language into precise architectural models, it democratizes advanced UML techniques for beginners while accelerating delivery for experts.
Whether you’re designing enterprise systems, IoT ecosystems, or hardware configurations, this tool removes friction, enhances accuracy, and frees you to focus on innovation rather than mechanics.
And when paired with strategic digital marketing tactics like flipbook publishing and Google Analytics tracking, your technical work becomes not only functional but also promotional—a dual-purpose asset driving both productivity and visibility.
So go ahead—describe your next big idea in plain English, hit generate, and let AI do the heavy lifting. The future of modeling is here—and it speaks human.
Suggested New Article Title:
“From Text to Blueprint: Mastering AI-Driven Composite Structure Diagrams in Visual Paradigm – A Beginner’s Guide to Faster, Smarter System Design”
Reference List (Markdown Format)
- Enhanced AI Composite Structure Diagram Generation – Visual Paradigm AI Chatbot: Official release announcement detailing improvements to AI-powered internal structure modeling.
- Visual Paradigm Desktop Product Updates: General product update log including recent enhancements to desktop features.
- UML Composite Structure Diagram – AI Chatbot Interface: Direct access point for generating diagrams via conversational AI.
- Guide to AI-Powered Internal Structure Modeling: Comprehensive documentation explaining capabilities and usage patterns.
- Polish Language Version of AI Guide: Localized version catering to Polish-speaking users.
- YouTube Demo Video – AI Diagram Generation Walkthrough: Visual walkthrough demonstrating step-by-step process of generating diagrams using AI.
- OpenDocs Release Notes – AI Composite Structure Generator: Details specific updates related to online document integration.
- Integrated AI Platforms Overview – VP Desktop vs OpenDocs: Comparison table highlighting differences between platforms.
- Main AI Composite Structure Generator Landing Page: Central hub for all information regarding the core AI generator feature.
- Additional OpenDocs Integration Notes: Further elaboration on embedding AI-generated diagrams into collaborative documents.
- Final Documentation Link – Full Feature Breakdown: Most detailed technical guide available publicly.
Let us know if you’d like sample prompts tailored to your industry—or help setting up flipbook analytics!
