


Software systems have become increasingly complex. As teams grow and applications expand, the gap between what is built and what is understood widens. Developers, stakeholders, and architects often find themselves discussing the same system but visualizing entirely different structures. This disconnect leads to technical debt, misaligned expectations, and inefficient development cycles. To bridge this divide, a standardized approach to visualizing software architecture is essential.
The C4 Model provides a structured method for creating software architecture diagrams. It offers a hierarchy of abstraction that allows teams to communicate effectively at different levels of detail. By focusing on shared understanding, this framework helps teams align on how a system is structured without getting bogged down in unnecessary complexity.
This guide explores the C4 Model in depth, examining its levels, benefits, and practical application. We will discuss how to implement this approach to improve communication, reduce ambiguity, and maintain clarity throughout the software development lifecycle.
🧩 What Is the C4 Model?
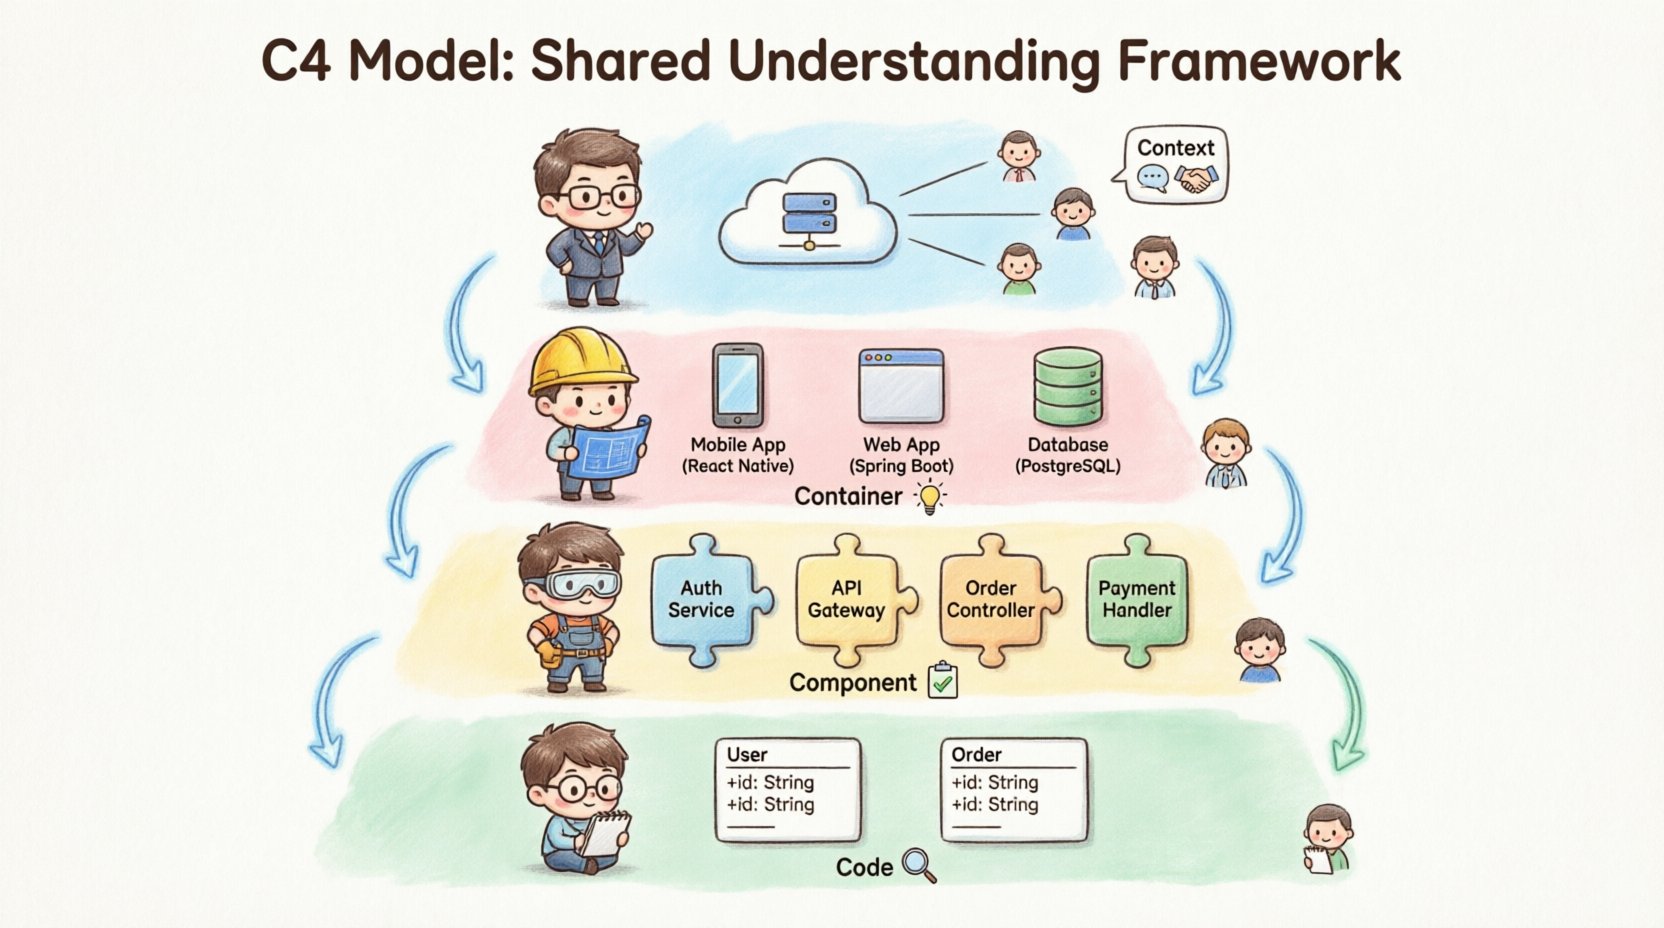
The C4 Model is a conceptual model for visualizing software architecture. It stands for Context, Container, Component, and Code. These four levels represent a hierarchy of abstraction, moving from high-level system overview to detailed internal logic.
Unlike other diagramming approaches that often mix levels of detail or focus too heavily on implementation specifics, the C4 Model enforces strict boundaries between each layer. This discipline ensures that diagrams remain readable and useful for their intended audience.
- Context: Shows the system in its environment.
- Container: Shows the high-level technology choices.
- Component: Shows the internal structure of a container.
- Code: Shows the relationships between classes and interfaces.
The primary goal is not just drawing pictures, but facilitating conversation. When everyone agrees on what a diagram represents, discussions become more productive. Decisions are made faster because the visual language is consistent.
📉 The Hierarchy of Abstraction
Understanding the C4 Model requires grasping the concept of abstraction. Abstraction hides complexity to focus on what matters. In software architecture, different stakeholders need different levels of detail.
- Executives and Product Owners need to see the big picture. They care about business capabilities and external integrations.
- Architects and Team Leads need to understand the technology stack and data flow between major systems.
- Developers need to know how functions interact within a specific service or module.
- Code Reviewers need to see how classes and methods relate to one another.
The C4 Model addresses these needs by providing distinct views. It prevents the common mistake of trying to cram all information into a single diagram. Instead, it encourages a drill-down approach where you start broad and zoom in only where necessary.
🌍 Level 1: Context Diagram
The Context Diagram is the starting point for any architectural documentation. It provides a high-level overview of the system being designed and its relationship with the outside world.
📌 Key Elements
- System of Interest: The main application or service you are documenting.
- People: Users, administrators, or external actors interacting with the system.
- Software Systems: External services, databases, or third-party APIs that the system communicates with.
📌 Purpose and Audience
This diagram is typically the first thing a new team member looks at. It answers the question: “What does this system do, and who does it talk to?”
The audience includes stakeholders who do not need technical details. They need to understand the scope of the project. If the diagram is too detailed, it loses its value. If it is too vague, it fails to inform.
📌 Best Practices
- Keep the number of people and systems manageable. If there are too many, group them logically.
- Use clear labels for relationships. Indicate the type of data flowing between entities.
- Focus on business value. Show how the system supports user goals.
- Avoid showing internal implementation details. This is not the place for classes or methods.
📦 Level 2: Container Diagram
Once the context is established, the next step is to break down the system of interest into its major building blocks. The Container Diagram reveals the technology choices and high-level structure.
📌 Key Elements
- Containers: These are distinct deployable units. Examples include web applications, mobile apps, microservices, or databases.
- Technology Stack: Each container should be labeled with the technology used, such as a programming language or database type.
- Connections: Show how containers communicate. This includes protocols like HTTP, gRPC, or message queues.
📌 Purpose and Audience
This diagram is crucial for architects and developers. It helps them understand the deployment topology. It answers questions about scalability, security boundaries, and technology dependencies.
For example, if a system uses a mobile app and a backend API, the container diagram shows how the app talks to the API. It also shows if there is a separate database container for data persistence.
📌 Best Practices
- Group related containers logically. If a service has multiple instances, show them as a single logical container to avoid clutter.
- Label technologies clearly. Knowing a container runs on Java vs. Python changes how you approach development.
- Indicate security zones. Show which containers are public-facing and which are internal.
- Avoid showing components inside containers here. Keep the focus on the container level.
⚙️ Level 3: Component Diagram
The Component Diagram drills down further into a single container. It shows the internal structure of a specific application or service.
📌 Key Elements
- Components: These are logical groupings of functionality. Examples include controllers, repositories, services, or modules.
- Responsibilities: Each component should have a clear purpose, such as handling authentication or processing payments.
- Dependencies: Show how components interact within the container.
📌 Purpose and Audience
This diagram is primarily for developers. It helps them understand the code structure without reading the source code. It aids onboarding and helps identify potential bottlenecks or tight coupling.
When starting a new feature, developers can look at this diagram to see where their code fits. They can identify which components handle related data and which interfaces they need to implement.
📌 Best Practices
- Group components by function. Avoid grouping them by file or folder structure, as these change frequently.
- Use consistent naming conventions. Component names should reflect their business logic.
- Limit the number of components. If a diagram becomes too crowded, consider splitting it into multiple views.
- Focus on interfaces. Show how components talk to each other rather than how they are implemented.
💻 Level 4: Code Diagram
The Code Diagram represents the lowest level of abstraction. It maps directly to the source code.
📌 Key Elements
- Classes: The individual units of code.
- Methods: The functions within classes.
- Interfaces: The contracts between classes.
📌 Purpose and Audience
This level is rarely created manually. It is often generated automatically from the codebase. It is useful for understanding complex algorithms or legacy code refactoring.
Because code changes frequently, manual diagrams at this level are hard to maintain. They are best used as a reference for specific, complex problems rather than general system documentation.
📌 Best Practices
- Use automated tools to generate these diagrams. Manual updates will quickly become outdated.
- Focus on specific areas. Do not try to diagram the entire codebase at once.
- Use them for debugging or onboarding new developers to a specific module.
- Keep them private or team-specific. They are not usually needed by non-technical stakeholders.
📊 Comparing the Levels
To clarify the differences between the levels, we can compare them based on their scope, audience, and maintenance requirements.
| Level | Focus | Audience | Maintenance Effort |
|---|---|---|---|
| Context | System in environment | Stakeholders, Product Owners | Low |
| Container | High-level technology | Architects, Team Leads | Medium |
| Component | Internal structure | Developers | Medium to High |
| Code | Classes and methods | Senior Developers | High (Automated) |
As you can see, the maintenance effort increases as you go deeper. This reinforces the need to only create diagrams at the level of detail required for the task at hand.
👥 Who Uses This?
The C4 Model is not limited to a specific role. It is designed to be used across the entire software development lifecycle.
- Architects: Use it to design the system and ensure it meets requirements.
- Developers: Use it to understand the codebase and plan new features.
- Project Managers: Use it to track progress and identify risks.
- Quality Assurance: Use it to understand test scope and coverage.
- Operations: Use it to understand deployment and infrastructure needs.
By adopting a common visual language, teams can reduce the time spent explaining concepts. A diagram speaks louder than a long email thread. It allows remote teams to collaborate effectively without constant meetings.
🛠️ Building Effective Diagrams
Creating diagrams is one thing. Creating useful ones is another. Here are strategies to ensure your diagrams add value.
📌 Start with the Context
Never skip the Context Diagram. It sets the stage. If you do not know what the system is supposed to do, you cannot design how it does it. Start here and work your way down.
📌 Keep It Updated
Outdated diagrams are worse than no diagrams. They create a false sense of security. Integrate diagram updates into your workflow. If a container changes, update the diagram. If a component is removed, remove it from the view.
📌 Use Consistent Notation
Establish a style guide for your team. Define how you represent people, systems, and data flows. Consistency makes it easier for anyone to read the diagrams without a legend.
📌 Focus on Readability
Clutter is the enemy. If a diagram is too hard to read, it is not useful. Use whitespace effectively. Group related items. Avoid crossing lines where possible.
📌 Leverage Tooling
There are various tools available to help create these diagrams. Some allow you to generate diagrams from code, while others require manual drawing. Choose a tool that fits your team’s workflow. The goal is to reduce friction, not add to it.
⚠️ Common Pitfalls
Even with a good framework, mistakes happen. Being aware of common pitfalls can help you avoid them.
- Mixing Levels: Do not show component details inside a context diagram. Keep the levels separate.
- Over-Engineering: Do not try to document every single class. Focus on the important ones.
- Ignoring Change: Systems evolve. If you do not plan for change, your diagrams will rot.
- Too Much Detail: A diagram with too many lines is confusing. Simplify where possible.
- Ignoring Audience: Do not show code diagrams to business stakeholders. They do not need that level of detail.
🔄 Integration with Agile
The C4 Model fits well into Agile methodologies. Agile emphasizes iterative development and continuous feedback. Diagrams should support this, not hinder it.
Instead of creating massive documents upfront, create diagrams as you build. Start with a rough Context Diagram. As you define the architecture, refine the Container Diagram. As you write code, update the Component Diagram.
This approach ensures documentation stays relevant. It also allows the team to visualize the impact of changes immediately. If you add a new service, you can see how it affects the system context and container structure.
🔍 Enhancing Shared Understanding
The ultimate goal of the C4 Model is shared understanding. This means everyone in the team has the same mental model of the system.
When a new developer joins, they can look at the Context Diagram to understand the business domain. They can look at the Container Diagram to understand the technology stack. They can look at the Component Diagram to understand where to write their code.
This reduces the cognitive load. New hires can become productive faster. Existing developers can onboard others more easily. Knowledge is not siloed in one person’s head; it is visualized and accessible.
Furthermore, shared understanding reduces errors. When everyone agrees on how the system works, integration issues decrease. Security risks are easier to identify. Performance bottlenecks become visible earlier.
🌱 Conclusion
Software architecture is not just about code; it is about communication. The C4 Model offers a proven path to better communication. By breaking down complexity into manageable layers, it allows teams to focus on what matters.
Adopting this framework requires discipline. It requires a commitment to keeping diagrams updated and relevant. However, the payoff is significant. Teams that use the C4 Model report faster decision-making, better collaboration, and clearer system designs.
Start by drawing your Context Diagram. Then, gradually build out the rest of the model as needed. Do not worry about perfection. Worry about clarity. With the right tools and mindset, you can transform how your team visualizes and understands software architecture.

