


Software architecture is often misunderstood as purely technical implementation. In reality, it is a communication tool. The C4 Model provides a structured way to visualize software architecture at different levels of abstraction. This guide explores the layers, benefits, and practical application of the C4 Model for technical teams and stakeholders.
Effective documentation does not require complex notation or obscure symbols. It requires clarity, consistency, and the right level of detail for the intended audience. The C4 Model addresses this by breaking down system design into four distinct levels of abstraction. Each level serves a specific purpose and targets a specific group of readers.
🧩 Understanding the Core Concept
The C4 Model was developed to solve the problem of documentation becoming outdated or too complex to maintain. Traditional approaches often resulted in massive diagrams that nobody read or diagrams that were too detailed to be useful for high-level planning. The C4 Model introduces a hierarchy of diagrams.
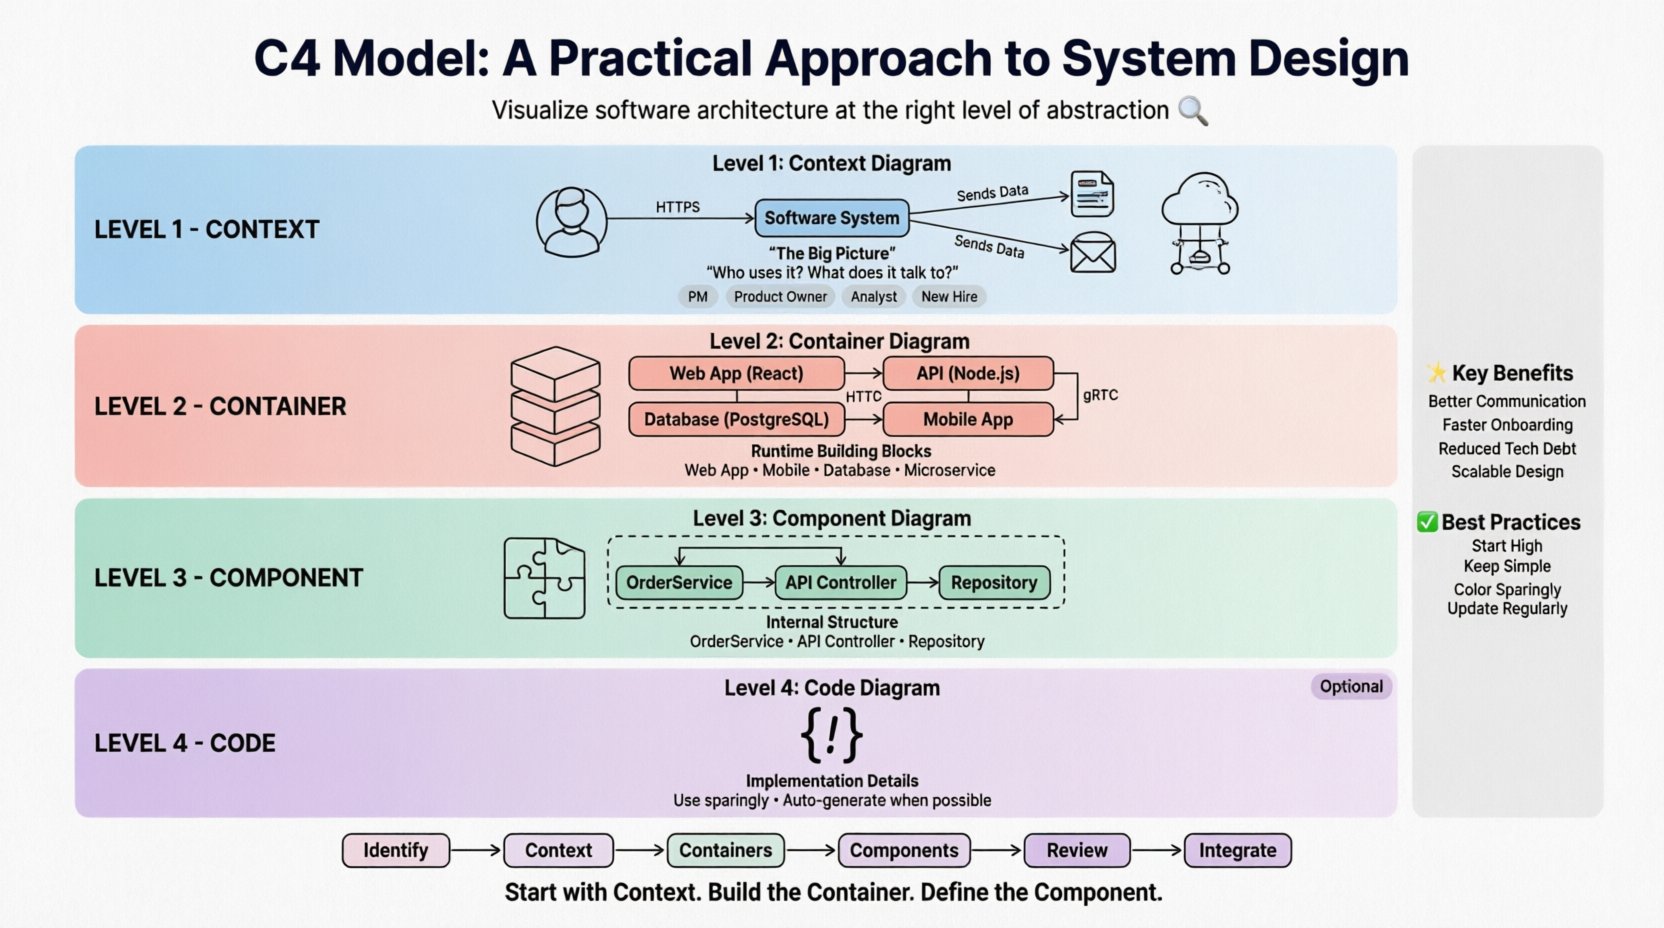
- Context Level: The big picture. Who uses the system and what external systems does it talk to?
- Container Level: The building blocks. What are the major runtime environments (web apps, databases, mobile apps)?
- Component Level: The internal structure. How do the containers break down into smaller, logical units?
- Code Level: The implementation details. This is usually optional and used sparingly.
This hierarchy allows architects to zoom in and out without losing context. It ensures that a stakeholder looking at the Context diagram does not see code details, while a developer working on a specific module sees the Component diagram.
🌐 Level 1: The Context Diagram
The Context Diagram is the starting point. It defines the boundaries of the system being designed. It is often the first diagram created and the most important for non-technical stakeholders.
👥 Who is this for?
- Project Managers
- Product Owners
- Business Analysts
- New Employees
🔑 Key Elements
- Software System: The main box representing the application. It should have a simple name.
- People: Users interacting with the system. These can be human actors like administrators or customers.
- Software Systems: External systems that interact with the main system. These could be payment gateways, email services, or legacy databases.
- Relationships: Lines connecting the system to actors and other systems. These lines are labeled with the protocol or data flow (e.g., “HTTPS”, “Sends Order Data”).
A well-crafted Context Diagram answers the question: “What does this system do, and who uses it?” It should be simple enough to fit on a single page or slide.
📦 Level 2: The Container Diagram
Once the system boundary is clear, the Container Diagram dives deeper. It shows the high-level technical decisions made for the system. Containers represent distinct, deployable units of software.
⚙️ What is a Container?
A container is a runtime environment or deployment unit. It is not a specific technology, but a logical grouping. Examples include:
- A Web Application (running in a browser or server)
- A Mobile Application (running on a device)
- A Microservice (running in a container or serverless function)
- A Database (storing persistent data)
- A Command Line Tool (running on a developer machine)
🔑 Key Elements
- Containers: Boxes representing the runtime environments. Each box should have a name and a short description.
- Technologies: While the C4 Model is technology-agnostic, it is helpful to note the stack (e.g., “Java”, “Node.js”, “PostgreSQL”) in the description.
- Connections: Lines showing how containers communicate. Labels should indicate the protocol (HTTP, gRPC, TCP) and the data being exchanged.
This diagram is crucial for understanding the infrastructure. It helps identify where security boundaries exist and how data flows between different parts of the system.
📊 Comparison: Context vs. Container
| Feature | Context Diagram | Container Diagram |
|---|---|---|
| Focus | Business scope and external interactions | Technical implementation and runtime |
| Audience | Stakeholders, Management | Developers, DevOps, Architects |
| Detail Level | High | Medium |
| Complexity | Low | Medium |
🧱 Level 3: The Component Diagram
The Component Diagram zooms into a single container. It shows the logical structure of the software within that container. Components are modular parts of the software that can be deployed independently.
🛠️ What is a Component?
A component is a logical unit of code. It is not a physical file, but a functional grouping. Examples include:
- Service classes (e.g., “OrderService”)
- API Controllers
- Database Repositories
- Background Job Workers
- UI Widgets
🔑 Key Elements
- Components: Boxes inside the container. They represent functionality.
- Interfaces: Lines showing how components interact. Labels describe the API or method calls.
- Data Stores: If a component manages data, it is often shown as a cylinder or specific icon within the container.
This level is the most common for developers. It helps teams understand dependencies and ownership. It answers the question: “How is this container built internally?”
💻 Level 4: The Code Diagram
The Code Diagram is the most detailed level. It shows the implementation details, such as classes, functions, and variables. This level is often generated automatically from source code or created manually for complex algorithms.
⚠️ When to Use It
This level is rarely maintained manually because code changes frequently. It is best used for:
- Complex algorithms that need explanation
- Legacy systems where documentation is missing
- Specific onboarding for new features
For most projects, stopping at the Component level is sufficient. Code diagrams should be generated dynamically if needed, rather than maintained as static images.
🔄 Maintaining the Model
One of the biggest challenges with architecture documentation is keeping it up to date. If the diagrams do not match the code, they become useless. Here are strategies to maintain the C4 Model effectively.
📝 Living Documentation
Documentation should be treated as code. It should be version controlled in the same repository as the source code. This ensures that changes to the architecture are tracked alongside changes to the implementation.
- Version Control: Store diagrams in Git. Commit changes when the architecture changes.
- Automated Generation: Where possible, generate diagrams from code annotations or configuration files.
- Review Process: Include diagram updates in the pull request review process. If a PR changes the architecture, the diagram must be updated.
🚫 Avoiding Over-Engineering
Do not attempt to document every single class. Focus on the high-level structures. A diagram that is too detailed becomes a maintenance burden. The goal is clarity, not completeness.
🤝 Collaboration and Communication
The C4 Model is not just for architects. It is a shared language for the entire team. Using a standard set of diagrams reduces ambiguity.
🗣️ Team Alignment
When a team agrees on the C4 Model, discussions become more efficient. Instead of saying “the thing that handles the user data,” a developer can say “the User Repository component in the API container.”
📈 Onboarding New Hires
New employees can quickly understand the system by starting with the Context diagram and drilling down as needed. This reduces the time required to become productive.
🔍 Knowledge Transfer
When team members leave, the diagrams preserve the institutional knowledge. They provide a snapshot of the system design at a specific point in time.
🚧 Common Pitfalls and Best Practices
Avoiding common mistakes ensures the model remains useful over time.
❌ Common Mistakes
- Mixing Levels: Putting component details in a Context diagram. Keep the layers separate.
- Too Many Labels: Overloading diagrams with text. Let the diagram speak for itself where possible.
- Inconsistent Naming: Using different names for the same concept in different diagrams. Maintain a glossary.
- Ignoring Relationships: Drawing boxes without showing how they connect. The lines are as important as the boxes.
✅ Best Practices
- Start High: Begin with the Context diagram. Fill in details later.
- Keep it Simple: Use standard shapes for people (stick figures) and software (rounded rectangles).
- Use Color Sparingly: Use color to indicate status or type, not decoration. Consistency is key.
- Update Regularly: Treat diagram updates as part of the definition of done.
📋 Implementation Workflow
Here is a practical workflow for introducing the C4 Model into a project.
- Identify the System: Define what is being modeled. Is it a new project or an existing legacy system?
- Create the Context Diagram: Map out the users and external systems. Get stakeholder approval.
- Drill into Containers: Identify the major runtime units. Define the technology stack.
- Break Down Components: For complex containers, define the internal components.
- Review and Refine: Have the team review the diagrams for accuracy and clarity.
- Integrate with Workflow: Decide how and when diagrams are updated during development.
🌟 Benefits of the C4 Model
Adopting this structured approach offers several tangible benefits for an organization.
- Better Communication: Everyone speaks the same language regarding architecture.
- Faster Onboarding: New developers understand the system faster.
- Reduced Technical Debt: Clear architecture helps identify bad decisions early.
- Scalability: The model scales from small scripts to large enterprise systems.
- Focus on Abstraction: Teams focus on design rather than implementation details until necessary.
🔗 Conclusion
The C4 Model is a pragmatic tool for software architecture. It balances the need for detail with the need for clarity. By adhering to the four levels of abstraction, teams can create documentation that is maintained, useful, and understandable. The key is consistency and treating the diagrams as living artifacts of the system.
Start with the Context. Build the Container. Define the Component. Avoid the Code unless necessary. This simple hierarchy provides the foundation for effective system design communication.

