


Software systems have become increasingly complex. As applications grow, the challenge of communicating their structure to stakeholders, developers, and architects intensifies. Traditional documentation often fails to bridge the gap between high-level business goals and low-level implementation details. This is where the C4 Model emerges as a practical solution. It provides a standardized approach to documenting software architecture, creating a shared vocabulary that technical teams can rely on without getting lost in unnecessary syntax.
Whether you are onboarding a new engineer, planning a major refactoring, or explaining system boundaries to non-technical stakeholders, visual clarity is essential. This guide explores the C4 Model in depth, examining its four levels, its benefits over traditional methods, and best practices for implementation.
📚 What is the C4 Model?
The C4 Model is a collection of diagrams and a notation system designed to document software architecture. It was created to address the confusion often found in UML (Unified Modeling Language) diagrams, which can be overly complex and difficult to maintain. The C4 Model focuses on abstraction. It allows architects to zoom in and out of a system, revealing more detail only when necessary.
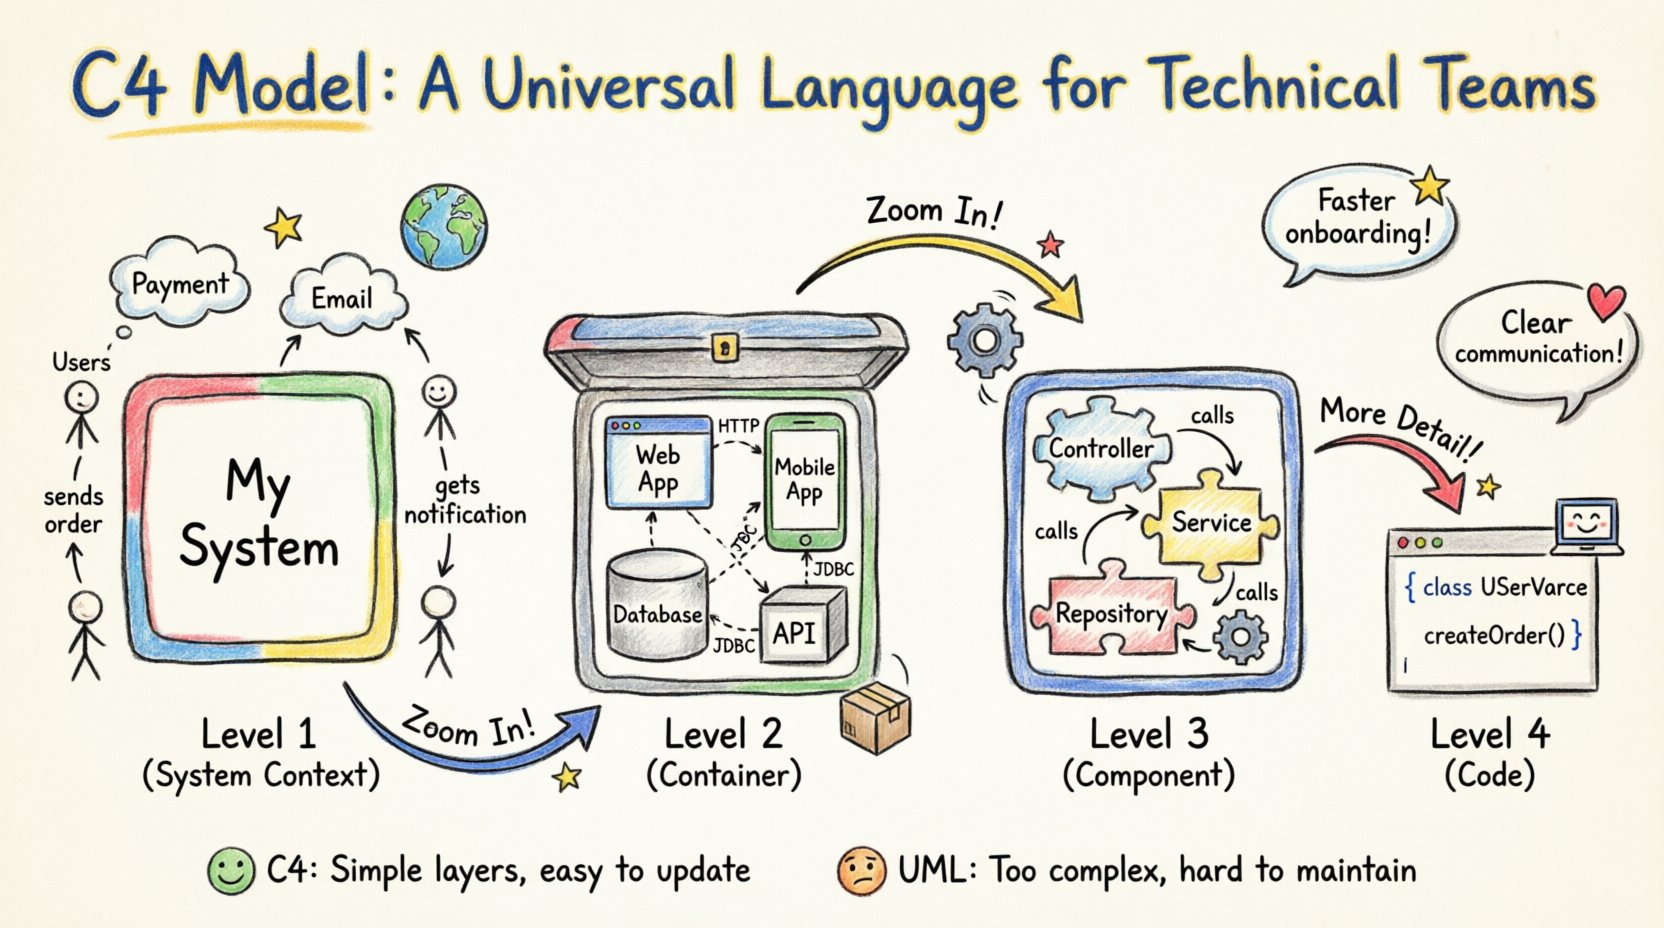
At its core, the model consists of four hierarchical levels:
- Level 1: System Context Diagram 🌍
- Level 2: Container Diagram 📦
- Level 3: Component Diagram ⚙️
- Level 4: Code Diagram 💻
Each level serves a specific audience and answers a specific set of questions. By separating concerns this way, teams can maintain a clear mental model of the system without being overwhelmed by every line of code or every API endpoint.
🔍 Level 1: System Context Diagram
The System Context Diagram provides the highest level of abstraction. It shows the software system as a single box and illustrates its relationships with users and other systems. This is the first diagram a stakeholder should look at to understand the scope of the project.
🎯 Purpose and Audience
The primary audience for this diagram includes:
- Business stakeholders
- Product managers
- New developers joining the team
- External system architects
It answers questions such as:
- Who uses the system?
- What external systems does it interact with?
- What is the data flow at a macro level?
🔑 Key Elements
This diagram typically includes:
- The System: Represented as a central box labeled with the application name.
- Users: Represented as stick figures or labeled boxes indicating roles (e.g., Admin, Customer).
- External Systems: Represented as boxes (e.g., Payment Gateway, CRM, Email Service).
- Relationships: Lines connecting the system to users and external systems, labeled with the type of interaction (e.g., “Creates Order”, “Receives Notification”).
By keeping this diagram simple, teams ensure that everyone understands the boundaries of the software before diving into internal mechanics.
📦 Level 2: Container Diagram
Once the system boundaries are established, the next step is to break the system down into its runtime components. The Container Diagram shows the high-level technical building blocks of the system. A “container” is a runtime process that holds code and data.
🎯 Purpose and Audience
This level is crucial for:
- Developers
- DevOps engineers
- System Architects
It answers questions like:
- What technologies are we using?
- How is the system deployed?
- What are the communication protocols between parts of the system?
🔑 Key Elements
Common containers include:
- Web Applications: Browser-based interfaces.
- Mobile Applications: iOS or Android native apps.
- APIs: RESTful or GraphQL endpoints.
- Databases: SQL, NoSQL, or caching layers.
- Background Processes: Scheduled jobs or microservices.
Relationships in this diagram define how containers talk to each other. For example, a Web Application container might connect to an API container via HTTP. The API container might connect to a Database container via JDBC. This visualization helps teams identify potential bottlenecks or security risks in the data flow.
⚙️ Level 3: Component Diagram
As the complexity within a container grows, a single box is no longer sufficient. The Component Diagram zooms in on a specific container to show its internal structure. Components are logical groupings of functionality within a container.
🎯 Purpose and Audience
This level is primarily for:
- Backend Developers
- Frontend Developers
- Technical Leads
It answers questions such as:
- What are the main responsibilities of this service?
- How is the code organized?
- What interfaces does this component expose?
🔑 Key Elements
Components might include:
- Controllers: Handle incoming requests.
- Services: Contain business logic.
- Repositories: Manage data persistence.
- Interfaces: Define how components interact.
Unlike the Container level, the Component level focuses on logical grouping rather than runtime processes. It does not need to show every class, but rather the major modules that make up the system. This helps developers understand where to place new code and how to refactor existing modules without breaking dependencies.
💻 Level 4: Code Diagram
The fourth level, often referred to as the Code Diagram, dives into the implementation details. It shows classes, interfaces, and methods within a component. This level is rarely required for high-level architecture but is vital for specific debugging or onboarding scenarios.
🎯 Purpose and Audience
This level is for:
- Senior Developers
- Code Reviewers
- Algorithm Specialists
It answers questions like:
- What is the internal logic of this function?
- How do these classes interact in a sequence?
- What are the specific data structures used?
⚠️ Note on Usage
While the C4 Model defines this level, many teams choose to stop at Level 3. Code diagrams change frequently with every commit. Maintaining them can become a burden. If used, they should be generated automatically from the code or kept very specific to critical paths.
📊 Comparison: C4 vs. Traditional UML
Many teams wonder why they should adopt the C4 Model instead of sticking with standard UML diagrams. The difference lies in abstraction and maintainability.
| Feature | C4 Model | Traditional UML |
|---|---|---|
| Abstraction | Focuses on layers of detail (Context → Code) | Often mixes levels in one diagram |
| Maintainability | Easy to update; focuses on key elements | Can become outdated quickly |
| Audience | Clear separation for different roles | Often assumes technical expertise |
| Complexity | Low complexity, high clarity | High complexity, many symbols |
| Scope | Explicitly defined system boundaries | Boundaries can be ambiguous |
The C4 Model removes the need for complex notations like state machines or activity diagrams in most cases. It prioritizes communication over strict standardization. This makes it accessible to a wider range of team members.
🚀 Implementing the Model in Your Workflow
Adopting the C4 Model requires a shift in mindset. It is not just about drawing pictures; it is about thinking about the system structure before writing code. Here is how to integrate it into your development lifecycle.
1. Start with the System Context
Before writing a single line of code, draft the Level 1 diagram. Define who the users are and what external systems you depend on. This prevents scope creep later. If a feature request falls outside the boundaries defined in this diagram, it triggers a review of the system scope.
2. Update During Design Reviews
Use Level 2 and Level 3 diagrams during technical design reviews. When proposing a new microservice or a database change, update the diagram. This ensures that the documentation reflects the intended architecture, not just the historical one.
3. Automate Where Possible
While manual drawing offers flexibility, some teams prefer automation. Generating diagrams from code or configuration files ensures that the visual representation stays in sync with the actual implementation. However, ensure that the generated diagrams are readable and not just raw dumps of data.
4. Store in Version Control
Treat diagrams as code. Store them in your version control system alongside your source code. This allows you to track changes to the architecture over time. You can see how the system evolved from version to version.
🛑 Common Pitfalls and How to Avoid Them
Even with a clear model, teams often struggle with execution. Here are common issues and how to mitigate them.
📉 Over-Detailing
A common mistake is trying to draw every class in a Component Diagram. This defeats the purpose of abstraction. Remember that Level 3 is about logical grouping, not implementation specifics. If a diagram looks like a spreadsheet of classes, simplify it.
🔄 Stale Documentation
Diagrams are useless if they do not match the code. If you deploy a change but forget to update the diagram, trust in the documentation erodes. To avoid this, make diagram updates a part of the Definition of Done for relevant tickets. If the architecture changes, the diagram must change.
🎨 Inconsistent Notation
Using different colors or shapes for the same types of elements creates confusion. Define a style guide for your team. For example, always use blue boxes for databases and green boxes for web applications. Consistency helps readers scan the diagram quickly.
📦 Mixing Levels
Do not put component details inside a container box in a Container Diagram. Keep the levels distinct. Level 2 shows the containers; Level 3 shows the components inside one container. Mixing them creates a cluttered view that is hard to interpret.
🌟 The Value of Visual Abstraction
Why invest time in these diagrams? The answer lies in cognitive load. Human brains are not designed to hold complex system states in memory. Visual representations offload this burden.
- Faster Onboarding: New hires can grasp the system in hours instead of weeks.
- Better Decisions: Architects can see dependencies and risks more clearly.
- Reduced Errors: Misunderstandings about data flow are caught early.
- Improved Communication: Everyone speaks the same visual language.
When a developer points to a diagram and says, “This API connects to the Database,” everyone understands exactly what is meant. There is no ambiguity about protocols, ports, or data structures. This shared understanding reduces friction in daily work.
🛠️ Maintaining Diagrams Over Time
Architecture is not static. Systems evolve. To keep the C4 Model effective, maintenance is key. Treat diagrams as living documents.
Regular Reviews
Schedule periodic reviews of the diagrams. Ask the team if the documentation still matches the reality of the codebase. This is especially important after major refactoring projects.
Link to Code
Whenever possible, link diagrams to specific parts of the codebase. If a component diagram mentions a specific service, link it to the repository or the deployment pipeline. This creates a traceability chain between the design and the implementation.
Feedback Loops
Encourage team members to suggest changes to the diagrams. If a developer sees a diagram that is confusing or inaccurate, they should feel empowered to correct it. This fosters a culture of ownership over the architecture.
🤝 Collaboration Strategies
The C4 Model is not just for architects. It is a tool for collaboration. Use diagrams during planning meetings, sprint reviews, and retrospectives.
- Planning: Use Level 1 and 2 diagrams to scope features.
- Development: Use Level 3 diagrams to guide implementation.
- Debugging: Use Level 3 or 4 diagrams to trace issues.
- Knowledge Transfer: Use Level 1 diagrams to explain the system to management.
By integrating diagrams into every stage of the lifecycle, they become a natural part of the workflow rather than an afterthought.
📝 Summary
The C4 Model offers a structured, scalable approach to documenting software architecture. By separating concerns into four distinct levels, it allows teams to communicate complex ideas simply. It avoids the pitfalls of overly technical diagrams while retaining enough detail to be useful for developers.
Implementing this model requires discipline and commitment to maintenance. However, the payoff is significant. Teams that adopt the C4 Model find that their communication improves, their onboarding processes speed up, and their system design becomes more robust. In an industry where complexity is the norm, clarity is the ultimate competitive advantage. 🚀

