


Software architecture is often described as the fundamental structure of a system. Yet, for many engineering teams, that structure remains a mental model that exists only in the minds of senior staff. When knowledge leaves a developer, the architecture degrades. This is where visualization becomes a critical tool for communication and clarity. The C4 Model offers a standardized approach to creating software architecture diagrams that scale from high-level overviews to granular details. By adopting this framework, teams can align their understanding of complex systems without getting lost in technical noise. 🧠
The Challenge of Architecture Documentation 📝
Creating documentation for software systems has historically been a struggle. Engineers often default to Unified Modeling Language (UML), which can be overly verbose and time-consuming to maintain. Alternatively, teams might rely on whiteboard sketches that fade away once the meeting ends. The result is a disconnect between what is built and what is understood.
Effective documentation must serve a purpose. It should answer questions about how data flows, where responsibilities lie, and how different parts of the system interact. The C4 Model addresses these needs by introducing a hierarchy of abstraction. This hierarchy allows architects and developers to zoom in and out of the system as needed, ensuring that every stakeholder sees the level of detail relevant to their role. 🎯
What is the C4 Model? 🔍
The C4 Model is a conceptual model for visualizing the structure of software systems. It was developed by Simon Brown to provide a lightweight, scalable way to document architecture. The model is built around four levels of abstraction, each with its own set of standard elements and relationships.
Unlike rigid methodologies, the C4 Model is a guide rather than a rulebook. It encourages consistency in notation while allowing flexibility in how teams choose to represent their specific infrastructure. The core philosophy is to focus on the what and why, rather than the how.
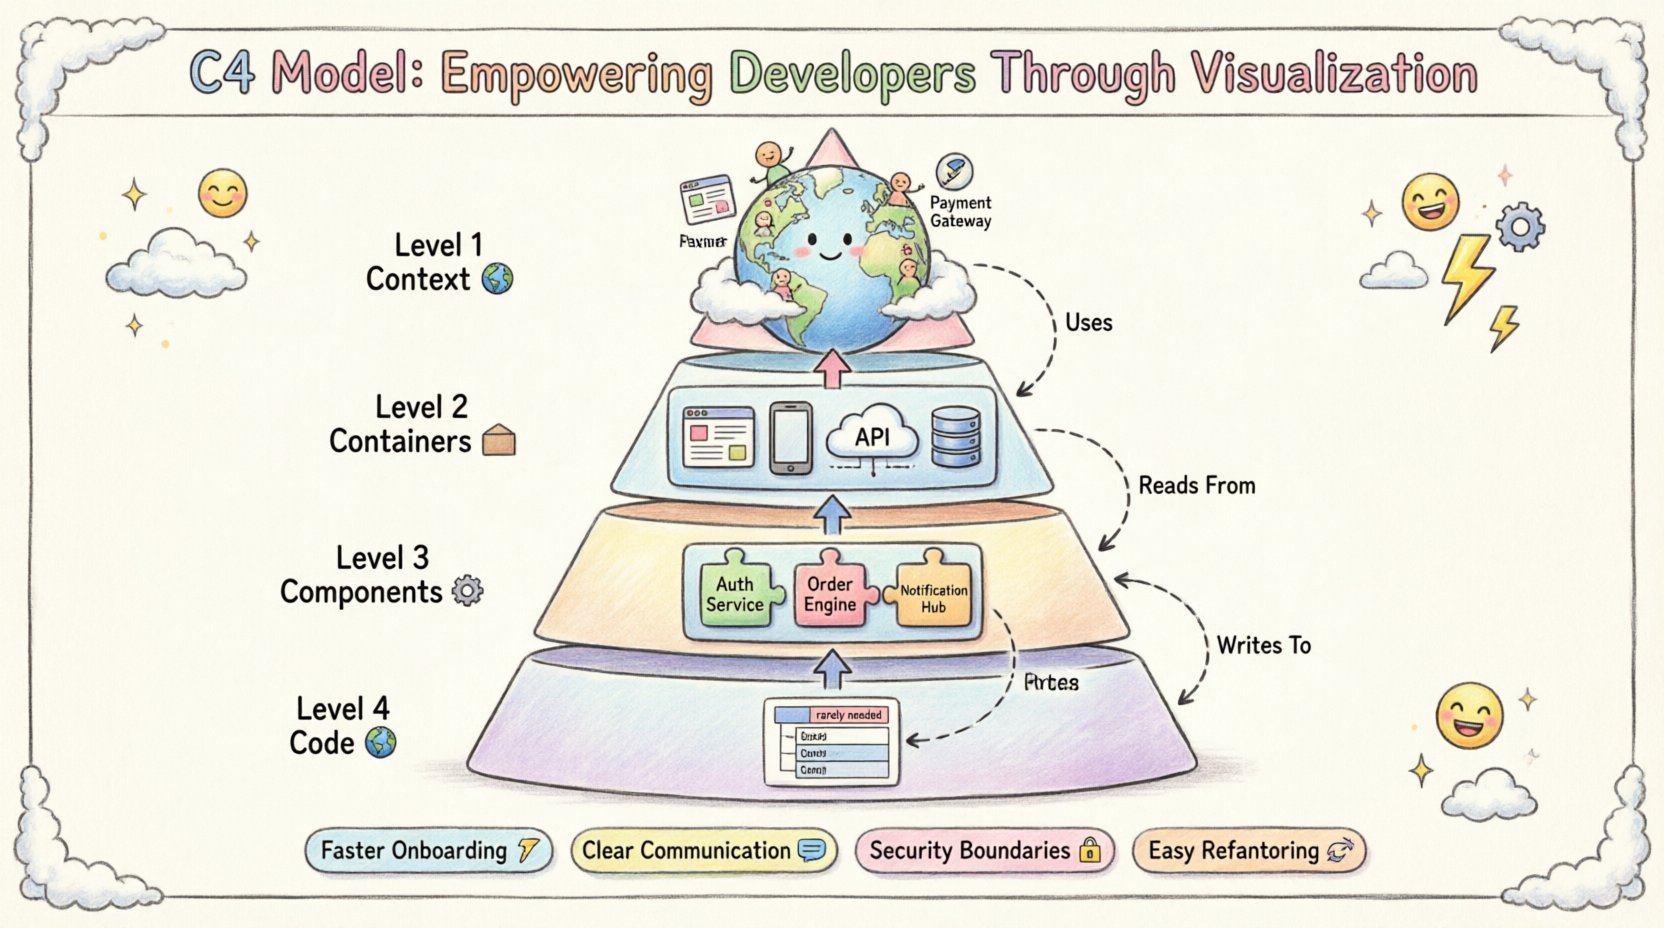
The Hierarchy of Abstraction
The model is divided into four distinct levels. Each level builds upon the previous one, offering more detail without overwhelming the viewer.
- Level 1: Context 🌍 – The big picture. Who uses the system and what are the external dependencies?
- Level 2: Containers 📦 – The runtime environments where the code executes.
- Level 3: Components ⚙️ – The high-level building blocks within a container.
- Level 4: Code 🧩 – The actual classes, functions, and modules (rarely needed).
Level 1: System Context Diagram 🌍
The System Context diagram is the starting point for any architectural discussion. It provides a high-level overview of the software system being documented and the people and systems that interact with it. This diagram is typically one page and should be understandable by anyone, from management to new hires.
Key Elements in a Context Diagram
- The System Being Documented: Represented as a large box in the center. This is the boundary of your application.
- People: Users, administrators, or operators who interact with the system. Examples include “Customer” or “System Admin”.
- Other Systems: External services or legacy systems that communicate with your application. Examples include “Payment Gateway” or “Legacy CRM”.
- Relationships: Arrows connecting the system to people or other systems. These arrows should be labeled with the type of interaction, such as “Uses” or “Manages”.
This level answers the question: Where does this system fit in the wider ecosystem? It defines the trust boundaries and the scope of the project. By isolating the system from its surroundings, teams can clearly identify dependencies that might cause failure points.
Level 2: Container Diagram 📦
Once the context is understood, the next step is to look inside the system. The Container diagram breaks down the central box from Level 1 into distinct runtime environments. A container is a deployed unit of software, such as a web application, a mobile app, or a database.
Understanding Containers
A container is not a microservice or a component in the code sense; it is a physical or logical deployment unit. Common examples include:
- Web Applications: Client-side code running in a browser.
- Mobile Applications: Native apps on iOS or Android devices.
- API Servers: Backend services handling HTTP requests.
- Database Systems: Persistent data stores like SQL or NoSQL databases.
- File Stores: Object storage services for images or documents.
Mapping Relationships
The relationships between containers are critical. They represent the flow of data and the protocols used. For example, a web application might communicate with an API server using HTTP. An API server might query a database using a specific driver protocol.
Key considerations for this level include:
- Technology Stack: Specify the technology used (e.g., Node.js, PostgreSQL, React).
- Data Flow: Indicate if data is read, written, or both.
- Security: Note if authentication is required for the connection.
This level helps developers understand the infrastructure requirements and the boundaries between different parts of the technology stack. It bridges the gap between the business view and the technical implementation.
Level 3: Component Diagram ⚙️
Containers are often too coarse for detailed design work. The Component diagram zooms in on a single container to reveal the high-level building blocks within it. A component is a cohesive unit of functionality, such as a module, a library, or a service within the application.
Defining Component Boundaries
Unlike containers, components do not necessarily have a runtime boundary. They represent logical separation of concerns. For a web application, components might include:
- Authentication Service: Handles user login and session management.
- Order Processing Engine: Manages the logic for creating and updating orders.
- Notification Hub: Sends emails or push notifications to users.
- Reporting Module: Generates data analytics and dashboards.
Components communicate with each other through interfaces. These interfaces define the methods or APIs available for interaction. The goal is to reduce coupling. If a component changes, the impact should be contained within that component as much as possible.
When to Stop at Level 3
For most projects, the Component diagram is the most detailed level required. It provides enough information for developers to understand the logic without getting bogged down in syntax. If a component is simple enough, it might not need a Level 4 diagram. However, for complex algorithms or shared libraries, deeper detail might be necessary.
Level 4: Code Diagram 🧩
The Code level represents the actual implementation details. This includes classes, functions, variables, and database schemas. While useful for specific design reviews, this level is generally discouraged for general architecture documentation.
Why Skip Level 4?
- Maintenance Overhead: Code changes frequently. Diagrams lag behind code.
- Information Density: Code diagrams become cluttered quickly.
- Readability: Developers can read the code directly for these details.
However, there are exceptions. If a specific algorithm requires explanation, or if a database schema is complex, a focused diagram at this level can be helpful. The key is to treat these as snapshots rather than living documents.
Standardizing Relationships and Notation 🛑
To ensure consistency across the team, the C4 Model defines standard ways to depict relationships. These relationships describe how elements interact with one another.
Types of Relationships
| Relationship | Description | Example |
|---|---|---|
| Uses | A system or component relies on another to function. | Mobile App uses API Server |
| Reads From | Data is consumed but not modified. | Reporting Module reads from Database |
| Writes To | Data is created or updated. | Order Service writes to Database |
| Communicates With | Generic communication without data ownership implication. | Microservices communicating via Message Queue |
| Authenticates With | Security verification is required. | Internal Service authenticates with Identity Provider |
Arrows should be labeled clearly. Ambiguity leads to miscommunication. If a connection is secure, indicate the protocol (e.g., HTTPS, TLS). If it is asynchronous, indicate the mechanism (e.g., Event, Queue). This level of detail is vital for security audits and performance tuning.
Benefits for Engineering Teams 🚀
Adopting a structured modeling approach yields tangible benefits for the organization. It moves architecture from an abstract concept to a concrete asset.
- Improved Onboarding: New developers can grasp the system landscape within days rather than months. Diagrams serve as a map for exploration.
- Better Communication: Architects and developers speak the same language. Discussions about “the payment container” are unambiguous.
- Refactoring Support: When planning a migration, the current state is clearly documented. Impact analysis becomes easier.
- Security Auditing: Trust boundaries are visible. Teams can identify where data encryption or access control is needed.
- Design Reviews: Teams can critique designs before writing code. This prevents expensive rework later in the lifecycle.
Maintaining Living Documentation 🔄
One of the biggest risks with architecture diagrams is drift. As the code evolves, the diagrams can become outdated, leading to confusion. To prevent this, teams must integrate diagramming into their workflow.
Strategies for Maintenance
- Code-First Documentation: Some teams generate diagrams from the codebase using automated tools. This ensures the diagram always matches the reality.
- Design Review Gates: Require updated diagrams as part of the Pull Request process for significant changes.
- Single Source of Truth: Store diagrams in the repository alongside the code. This ensures they are versioned and reviewed with the software.
- Regular Audits: Schedule quarterly reviews to ensure the diagrams reflect the current state of the infrastructure.
It is better to have a slightly outdated diagram than no diagram at all, but the goal should always be accuracy. If a diagram takes too long to update, it is likely too detailed and should be simplified.
Handling Complex Systems 🧱
Large enterprises often manage multiple systems that interact. The C4 Model scales well for these scenarios by treating the entire ecosystem as a collection of Context diagrams.
System Landscape
Instead of one giant diagram, create a portfolio of Context diagrams. Each application in the organization gets its own Level 1 diagram. These diagrams can be linked together to show how the enterprise connects. This modular approach keeps individual diagrams clean and focused.
Microservices Architecture
In microservices environments, the Container diagram is particularly useful. It shows which services run in which environments and how they communicate. It helps identify circular dependencies and overly coupled services. If Service A calls Service B, which calls Service C, and Service C calls Service A, the diagram makes this loop immediately visible.
Security and Trust Boundaries 🔒
Security is not an afterthought. The C4 Model includes specific conventions for trust boundaries. A trust boundary represents a point where authentication or authorization might change.
Visualizing Trust
Draw dashed lines around groups of elements that share a trust level. For example, all internal services might share a high-trust boundary, while external users are outside it. This visual cue helps security teams identify where to place firewalls or API gateways.
- External Trust: Users, third-party APIs.
- Internal Trust: Services within the same network.
- High Security: Systems handling sensitive data like PII or financial records.
By explicitly marking these boundaries, teams ensure that security requirements are met at the architectural level, not just in the code.
Common Pitfalls to Avoid ⚠️
Even with a good model, teams can stumble. Awareness of common mistakes helps maintain the quality of the documentation.
- Over-Engineering: Trying to document everything in Level 4 creates noise. Stick to the level necessary for the audience.
- Ignoring Updates: Letting diagrams rot is worse than not having them. Commit to the maintenance cost.
- Too Many Tools: Use one tool for the entire team. Inconsistent notation confuses readers.
- Lack of Standards: Define naming conventions early. If one person calls it “User Service” and another calls it “Auth Service,” confusion arises.
Integrating into the Workflow 🛠️
The C4 Model is not a separate activity; it is part of the development lifecycle. It fits naturally into planning, design, and review phases.
Planning Phase
During sprint planning or feature design, sketch the Context or Container changes. This ensures that new features do not introduce architectural debt.
Design Phase
Create the Component diagrams before writing code. This acts as a blueprint. It allows peers to review the logic before implementation begins.
Review Phase
Use the diagrams during code reviews. If the code deviates from the diagram, investigate why. This keeps the implementation aligned with the design.
Conclusion on Value
Visualizing software architecture is not about drawing pretty pictures. It is about creating a shared understanding that enables teams to build better systems. The C4 Model provides the structure needed to make this possible without overwhelming the team with complexity. By focusing on Context, Containers, and Components, developers can communicate effectively, onboard faster, and maintain systems with confidence. When the architecture is clear, the code follows. 🏁
Final Thoughts on Implementation 🌱
Starting a C4 initiative requires commitment. Begin with a pilot project. Document one system using the four levels. Gather feedback from the team. Adjust the notation if needed. Once the process is stable, expand to other systems. The goal is a culture where documentation is valued and maintained. With practice, the C4 Model becomes a natural extension of the engineering process, empowering teams to navigate complexity with clarity. 🌟

