


Software architecture often suffers from miscommunication. Developers focus on code structure, while operations teams concentrate on deployment, monitoring, and reliability. This disconnect can lead to fragile systems and slow incident resolution. The C4 Model provides a structured approach to documenting software architecture that serves both perspectives effectively. By visualizing systems at different levels of abstraction, teams can align their understanding without getting lost in technical minutiae.
This guide explores how the C4 Model facilitates collaboration between development and operations. It breaks down the four levels of the model, explains why they matter, and offers a practical path for implementation. Whether you are managing a monolith or a distributed microservice ecosystem, consistent documentation is vital for long-term success.
Understanding the C4 Model Hierarchy 📊
The C4 Model is a hierarchy of diagrams that describe a system. It was created to solve the problem of documentation that is either too high-level to be useful or too detailed to be readable. The model consists of four distinct levels, each serving a specific purpose in the lifecycle of a software project.
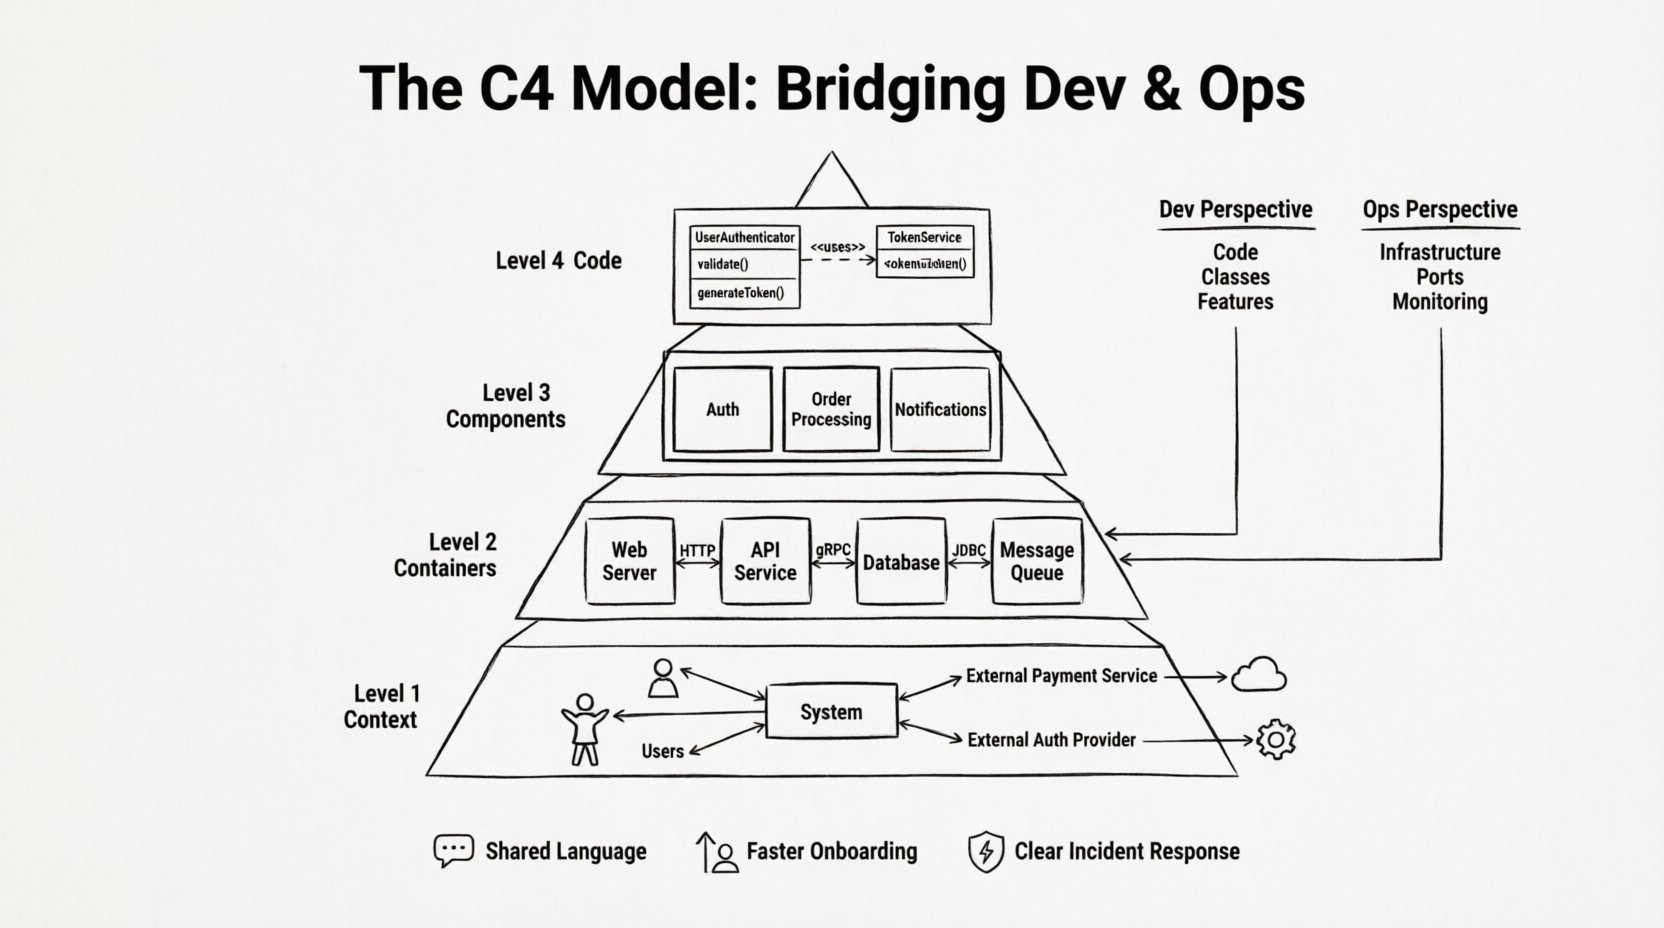
- Level 1: Context – Shows the system as a single box and its relationships with external users and systems.
- Level 2: Containers – Breaks the system down into running processes, such as web applications or databases.
- Level 3: Components – Details the major pieces of logic within a single container.
- Level 4: Code – Focuses on the internal structure of a specific component, often mapping to code classes.
Each level answers a different question. The Context diagram asks, “What does the system do?” The Containers diagram asks, “How is the system built?” The Components diagram asks, “How does it work inside?” and the Code diagram asks, “How is the logic organized?”
Why This Hierarchy Matters for Operations
Operations teams often struggle with documentation that focuses solely on code. When a server goes down, they need to know which container is affected, not which specific class is throwing an exception. The C4 Model supports this by providing a clear mapping from infrastructure to logic.
Conversely, developers need to understand the boundaries of their services. Knowing how a container interacts with external APIs or databases is crucial for writing stable code. This model ensures that the operational constraints are visible during the design phase.
Level 1: The System Context Diagram 🌍
The first level provides a bird’s-eye view. It places your system in the wider environment. This is the most important diagram for stakeholders who do not know the technical details but need to understand the scope.
Key Elements
- The System – A single box representing the software you are building or maintaining.
- People – End users, administrators, or other roles interacting with the system.
- Other Systems – Third-party APIs, databases, or legacy services that connect to your system.
- Relationships – Lines showing data flow or interaction between the system and its neighbors.
For DevOps teams, this diagram clarifies dependencies. If an external system changes its API, the impact is immediately visible. If a new user role is introduced, the flow of information is clear. This prevents “shadow IT” where teams connect to systems without formal oversight.
Practical Example
Imagine a payment processing system. The Context diagram shows the “Payment System” box. It connects to “Customers” (people) and “Banking Gateway” (other system). It also connects to the “Notification Service” to send emails. Operations teams can see that if the Banking Gateway is down, the system cannot process payments. This is critical for setting up alerts and failover strategies.
Level 2: The Container Diagram 📦
A container is a distinct, runnable unit of software. It could be a web application, a mobile app, a microservice, or a database. This level is where the architecture becomes tangible. It bridges the gap between the logical system and the physical deployment.
Defining Containers
Containers are defined by their purpose and technology stack. Examples include:
- A web server (e.g., Nginx or Apache instance)
- A backend API service (e.g., a Node.js or Java process)
- A database (e.g., PostgreSQL or Redis)
- A batch processing job
This level is vital for Operations. It maps directly to infrastructure. When you deploy a new version, you are updating a container. When you scale resources, you are scaling a container. The diagram shows how these containers talk to each other.
Communication Protocols
The lines between containers show the protocol used. This is crucial for networking configuration.
- HTTP/HTTPS – Common for web traffic and API calls.
- gRPC – High-performance internal communication.
- Database Drivers – Specific protocols like JDBC or ODBC.
- Message Queues – Asynchronous communication via AMQP or Kafka.
Knowing the protocol helps Operations teams configure firewalls and load balancers correctly. If a container talks to another via a specific port, that port must be open in the security group.
Level 3: The Component Diagram 🧩
Once you drill down into a single container, you need to see how it is organized. Components are logical groupings of functionality within a container. They are not physical files on a disk, but cohesive units of behavior.
Responsibilities
Components should have a single responsibility. A “User Management Component” handles authentication and profiles. A “Order Processing Component” handles the transaction logic. Keeping these separate helps both developers and operators.
For developers, this clarifies where to put new code. If you need a new feature, you know which component to touch. For operators, this helps with monitoring. If the “Order Processing Component” is slow, you can target specific metrics for that logic.
Interfaces and Dependencies
Components interact through defined interfaces. These are the points where data enters and leaves the component. Diagramming these interactions reveals hidden dependencies. Sometimes, a component seems isolated but relies on a shared utility library that is not obvious.
Table: Comparing Container vs. Component Views
| Aspect | Container Level | Component Level |
|---|---|---|
| Focus | Infrastructure and Runtime | Logic and Functionality |
| Who Reads It | DevOps, Architects | Developers, QA |
| Granularity | High (Process/Service) | Medium (Module/Class Group) |
| Change Frequency | Low (Infrastructure changes) | Medium (Feature updates) |
| Primary Use | Deployment & Networking | Development & Refactoring |
Level 4: The Code Diagram 💻
This is the most detailed level. It maps directly to the codebase. It shows classes, interfaces, and methods within a specific component. While this level is primarily for developers, it has value for operations during deep-dive troubleshooting.
When to Use This Level
Do not document every class. This level is reserved for complex logic that is difficult to understand from the component diagram alone. It is useful when onboarding new developers to a critical part of the system.
For Operations, this level can be referenced during incident analysis. If a specific error trace points to a class, the Code diagram shows the relationships and dependencies of that class. This helps identify if the issue is isolated or if it affects other parts of the system.
Bridging the Dev and Ops Divide 🤝
The main value of the C4 Model lies in its ability to create a shared language. Developers and Operations often speak different dialects. Devs talk about classes and functions. Ops talk about instances and ports. The C4 Model translates between these dialects.
Shared Documentation Standards
When both teams agree to use the C4 Model, documentation becomes a living part of the workflow rather than a side task. It becomes a single source of truth. This reduces the “it works on my machine” syndrome because the deployment context is clearly defined.
Incident Management
During an outage, time is critical. A team member needs to know the impact immediately. The Context and Container diagrams provide this overview. They allow the team to identify which services are down and which are affected downstream.
- Identification – Which container is reporting errors?
- Impact Analysis – Which user flows are broken?
- Resolution – Which component needs restarting or rollback?
Onboarding New Team Members
New hires often spend weeks trying to understand the system architecture. The C4 Model accelerates this. A new developer can start with the Context diagram to understand the ecosystem. They can move to Containers to understand the services they need to deploy. Finally, they can look at Components to understand the code they will write.
Implementation Strategy 🛠️
Adopting the C4 Model does not require a massive overhaul. It can be introduced incrementally. The goal is to improve clarity, not to create bureaucracy.
Step 1: Start with Context
Draw the Context diagram for your most critical system. Identify the main users and external dependencies. This takes a few hours and provides immediate value. Share this with the Operations team to validate the infrastructure assumptions.
Step 2: Map Containers
Once the context is clear, break down the system into containers. Map these to your current deployment environment. Are there databases you forgot about? Are there background jobs running that no one tracks? This step often reveals technical debt.
Step 3: Document Critical Components
You do not need to diagram every component. Focus on the ones that are complex or prone to change. Use the Component diagram to clarify the boundaries of your microservices.
Step 4: Integrate into Workflow
Documentation should not be static. Update the diagrams when the system changes. This can be done during code reviews or architecture decision records. If a new API endpoint is added, the diagram should reflect it.
Common Pitfalls to Avoid ⚠️
While the C4 Model is powerful, it can be misused. Teams often fall into traps that reduce its effectiveness.
Pitfall 1: Over-Engineering
Do not create diagrams for every small change. If a feature adds a single line of code, the architecture has not changed. Focus on structural changes. Over-documentation leads to stale diagrams that no one trusts.
Pitfall 2: Ignoring the Ops Perspective
Developers sometimes create diagrams that look perfect logically but are impossible to deploy. The Container level must reflect reality. If a container is split across two regions, the diagram should show that. If a database is sharded, the diagram should reflect the shards.
Pitfall 3: Static Documentation
Digital diagrams that live in a wiki and are never updated become liabilities. They mislead new hires and confuse the team. Treat diagrams as code. Store them in version control. Review them in pull requests.
Pitfall 4: Confusing Levels
Do not put database tables in the Container diagram. Do not put infrastructure details in the Component diagram. Keep the levels distinct. Mixing them creates confusion. A container is a runtime unit, not a code module.
Maintaining the Documentation 🔄
Documentation is a maintenance task. It requires effort to keep it accurate. However, the cost of not having it is much higher. Teams spend hours hunting for information that should be visible on a diagram.
Automation and Tooling
Some tools can generate C4 diagrams from code repositories. This reduces the manual effort. However, automated generation is not perfect. It often misses business context. Use tools to generate the base, but refine manually to add the meaning.
Review Cycles
Schedule a quarterly review of your architecture diagrams. Ask the Operations team if the diagrams match the current infrastructure. Ask the Developers if the diagrams match the current code. Update what is outdated.
Conclusion on Architecture Clarity 🎯
Effective software architecture documentation is a foundation for stability. The C4 Model offers a proven framework to achieve this. By separating concerns across four levels, it allows teams to focus on what matters at each stage of the lifecycle.
For Developers, it clarifies boundaries and responsibilities. For Operations, it defines infrastructure and dependencies. Together, they create a shared understanding that reduces friction and accelerates delivery. When both teams look at the same diagrams and see the same reality, collaboration improves naturally.
Start small. Draw one Context diagram. Share it. Update it. Let the model evolve with your system. This disciplined approach to visualization ensures that your software remains maintainable as it grows.

