


Software architecture documentation often suffers from a simple problem: it is either non-existent or so detailed that no one reads it. Teams spend weeks building massive wikis that become outdated the moment the code changes. The C4 Model offers a pragmatic solution. It provides a structured way to visualize software architecture at different levels of abstraction. By focusing on the system context, containers, components, and code, you can create documentation that is useful, maintainable, and valuable for your entire team.
This guide walks you through the C4 Model from the ground up. You will learn how to document complex systems without getting bogged down in technical minutiae. Whether you are onboarding a new developer or refactoring a legacy application, this approach ensures your documentation scales with your software.
🤔 What is the C4 Model?
The C4 Model is a hierarchical approach to software architecture documentation. It was created to address the limitations of traditional UML diagrams, which often become too complex too quickly. Instead of trying to capture every class and interface in a single diagram, C4 breaks the system down into manageable layers. Each layer answers a specific question about the system.
This hierarchy ensures that stakeholders can find the information they need without being overwhelmed. A manager might only need to see the System Context. A developer working on a specific module might need to see the Component Diagram. The model adapts to the audience, not the other way around.
The Four Levels of Abstraction
To implement the C4 Model effectively, you must understand the four distinct levels. Each level represents a different scope and audience.
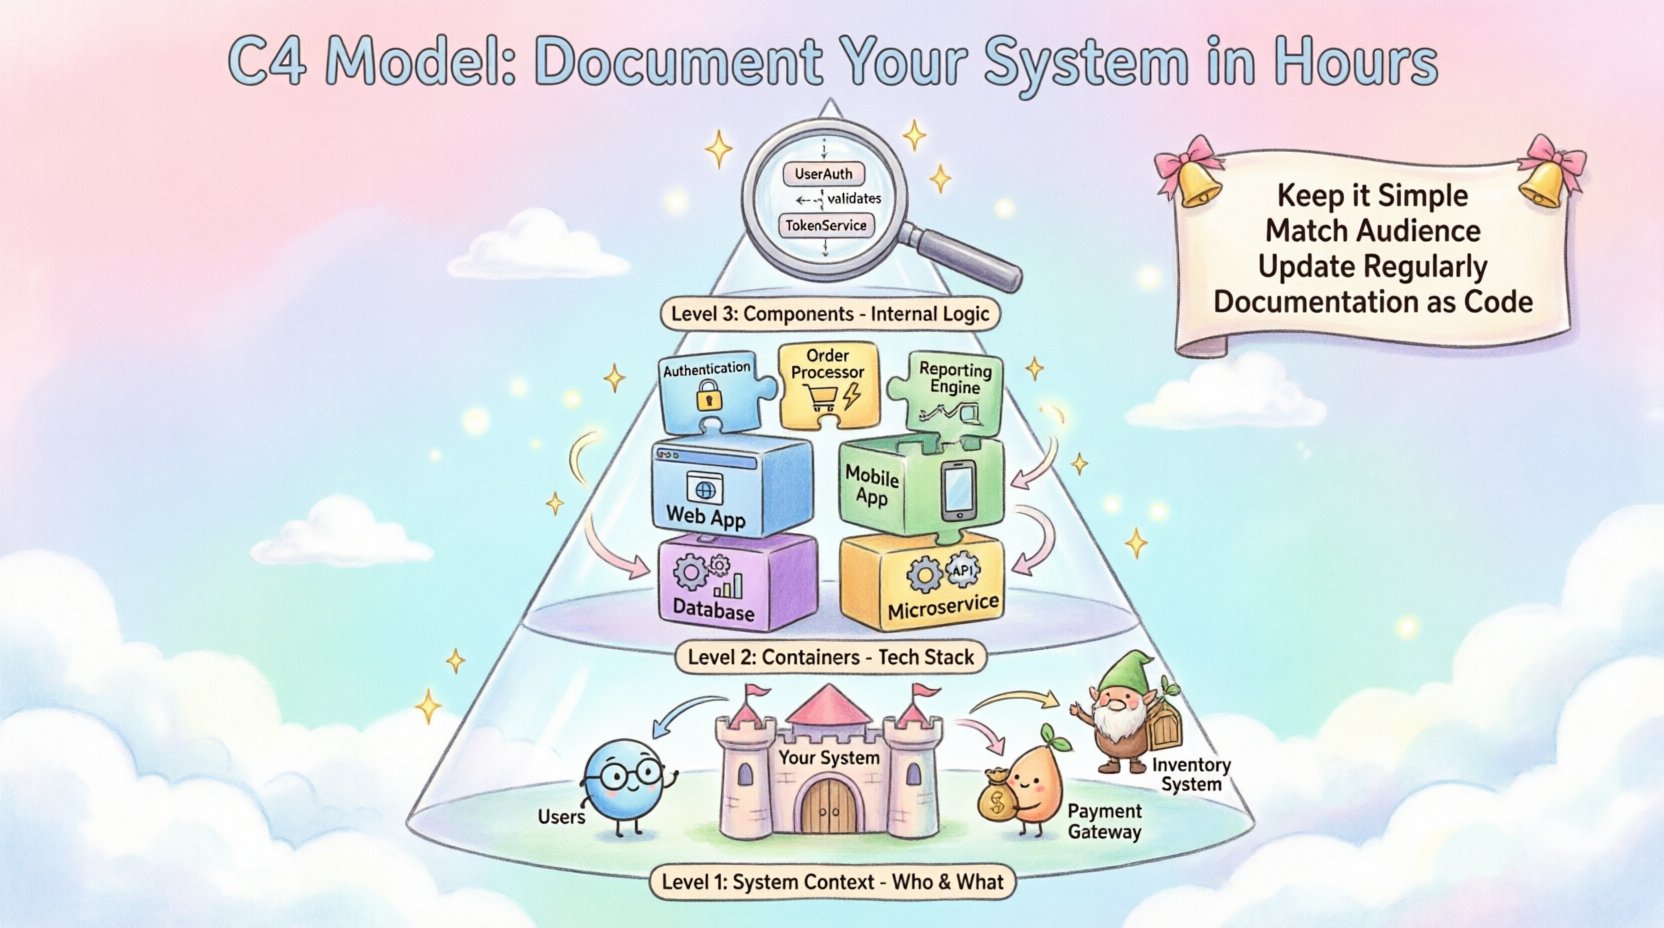
- Level 1: System Context Diagram – The big picture. Shows your system and its users.
- Level 2: Container Diagram – The technology stack. Shows the high-level building blocks.
- Level 3: Component Diagram – The internal logic. Shows the parts within a container.
- Level 4: Code Diagram – The implementation details. Shows classes and relationships.
Most teams find that Levels 1 through 3 cover 95% of their documentation needs. Level 4 is optional and often reserved for complex algorithms or specific architectural patterns.
🌍 Level 1: System Context Diagram
The System Context Diagram is your starting point. It answers the fundamental question: What does this system do, and who uses it?. This diagram is designed for non-technical stakeholders, including business owners, product managers, and new hires.
In this view, your system is represented as a single box in the center. Surrounding this box are the external entities that interact with it. These entities include people (like users or administrators) and other software systems (like payment gateways or third-party APIs).
Key Elements to Include
- People: Who interacts with the system? (e.g., Customer, Administrator, Support Agent)
- Systems: What other software does your system talk to? (e.g., Email Service, Database, CRM)
- Relationships: How do they interact? Use arrows to show data flow.
- Labels: Clearly label the direction and type of data being exchanged.
Keep this diagram simple. Do not include internal details. If you find yourself adding internal components, you are drifting into Level 2 territory. The goal is to establish the boundaries of your system clearly.
Example Scenario
Imagine an E-commerce platform. In the System Context Diagram, you would see the “E-commerce Platform” box. You would see a “Customer” box connecting to it for placing orders. You would see a “Payment Gateway” box connecting to it for processing transactions. You would see a “Inventory System” box connecting to it for stock checks. That is the entire scope of Level 1.
📦 Level 2: Container Diagram
Once the boundaries are set, you can zoom in. The Container Diagram reveals the high-level technology stack. A container is a deployable unit of software. Examples include web applications, mobile applications, databases, and microservices.
This diagram is crucial for developers. It shows how the system is physically or logically separated. It helps answer questions like: “Is the backend a monolith or microservices?” or “What database technology are we using?”
Defining Containers
When drawing this diagram, identify the distinct technologies used. Each container should represent a distinct runtime environment.
- Web Application: Typically runs in a browser or server.
- Mobile Application: Runs on a user’s device.
- Database: Stores persistent data.
- Microservice: A standalone service with its own deployment.
Connect these containers with arrows to show communication paths. Label these connections with the protocol used, such as HTTP, TCP, or SQL.
Best Practices for Level 2
- Group by Technology: If you have multiple instances of the same technology, group them logically.
- Show Boundaries: Clearly indicate which container belongs to your system and which belongs to an external service.
- Focus on Communication: The arrows are as important as the boxes. They show the data flow and dependencies.
⚙️ Level 3: Component Diagram
Now you go deeper. The Component Diagram breaks down a single container into its internal parts. A component is a logical grouping of functionality within a container. It is not a physical file, but a cohesive unit of behavior.
This level is for the developers working inside the system. It helps them understand the internal architecture without needing to read the source code. It answers: “How is this application organized internally?”
Identifying Components
Components should be logical groupings of classes or functions. Examples include:
- Authentication Service: Handles user login and session management.
- Order Processor: Handles the logic for creating orders.
- Reporting Engine: Generates data summaries.
Do not list every class. Only list the components that matter for architectural understanding. If a component is too small, it might be better to ignore it at this level.
Mapping Relationships
Just like the previous levels, show how components interact. Use arrows to indicate dependencies. Label the arrows with the method calls or interfaces used.
| Diagram Level | Audience | Focus | Detail Level |
|---|---|---|---|
| Level 1: System Context | Stakeholders, Managers | Boundaries & Users | High |
| Level 2: Containers | Developers, DevOps | Tech Stack | Medium |
| Level 3: Components | Developers | Internal Logic | Low |
| Level 4: Code | Senior Developers | Classes & Interfaces | Very Low |
💻 Level 4: Code Diagram
The final level dives into the implementation details. This diagram shows classes, interfaces, and their relationships. It is essentially a class diagram.
For most projects, this level is unnecessary. It changes too frequently and is hard to maintain. If you need to understand the code, you should read the code. However, for complex algorithms or critical security modules, this level can be useful.
When to Use Level 4
- Complex Algorithms: When the logic is non-trivial and needs visual explanation.
- Security Critical Paths: Where understanding the data flow is vital for security audits.
- Legacy Systems: When documentation is missing and code is the only source of truth.
If you find yourself spending more time drawing Level 4 diagrams than writing code, you are likely over-documenting. Use this level sparingly.
🛠️ Creating the Diagrams
You do not need expensive tools to create these diagrams. The C4 Model is tool-agnostic. You can use text editors, generic diagramming software, or code-based definition languages. The key is consistency.
The Process
- Start with Level 1: Define your system boundary.
- Move to Level 2: Identify your containers and technologies.
- Drill Down to Level 3: Break down your containers into components.
- Review: Check if the diagrams align with the code.
- Update: Change the diagrams whenever the architecture changes.
Tooling Considerations
- Text-Based: Write your diagrams in text files. This allows version control.
- Visual Editors: Use drag-and-drop tools for quick sketches.
- Code-Based: Define diagrams in code. This keeps them in sync with the repository.
Whatever you choose, ensure your team agrees on the standard. Consistency is more important than the specific tool.
🔄 Maintenance and Evolution
Documentation dies if it is not maintained. A common pitfall is creating diagrams once and never updating them. To prevent this, integrate documentation into your workflow.
Documentation as Code
Store your diagrams in the same repository as your source code. This ensures they are versioned together. When you merge a pull request, you should ideally update the diagrams as well.
Automating Updates
If you use code-based definitions, you can automate the generation of images. This reduces the friction of keeping diagrams up to date. However, manual review is still necessary to ensure the logic is correct.
Scheduling Reviews
- Quarterly: Schedule a review session to check diagram accuracy.
- During Refactoring: Update diagrams as part of the refactoring task.
- New Features: Update diagrams when introducing significant new features.
🚫 Common Pitfalls
Even with a structured model, teams make mistakes. Being aware of these pitfalls will save you time and frustration.
1. Over-Detailing
Do not try to show every class in Level 3. This leads to clutter and confusion. Stick to high-level components. If a developer needs details, they look at the code.
2. Ignoring the Audience
Do not show Level 3 diagrams to a Product Manager. They do not care about components. Show them Level 1. Tailor the diagram to the reader.
3. Stale Data
Do not let diagrams become outdated. If the diagram does not match the code, it is worse than no diagram at all. It creates false confidence.
4. Mixing Levels
Do not mix Level 1 and Level 2 on the same page. Keep the hierarchy clear. If you need to show more detail, create a new diagram.
💡 Best Practices for Success
To get the most out of the C4 Model, follow these guidelines. They will help you maintain a healthy documentation culture.
- Keep it Simple: Use simple shapes and labels. Avoid complex notation.
- Use Consistent Colors: Use color to indicate status or type, but keep it consistent across all diagrams.
- Focus on Flow: Emphasize how data moves through the system, not just how it is stored.
- Iterate: Start with a rough sketch. Refine it over time.
- Share: Put diagrams in your wiki or repository. Make them accessible to everyone.
🤝 Integrating with Development Workflow
Documentation should not be a separate task. It should be part of the development process. This ensures that the architecture is considered from the start.
Design Reviews
Hold design reviews before writing code. Use the C4 diagrams as the primary communication tool. This helps catch architectural issues early.
Onboarding
Use Level 1 and Level 2 diagrams for new hires. This helps them understand the system quickly without reading thousands of lines of code.
Refactoring
Before refactoring, update the diagrams. This helps you understand the impact of the changes. After refactoring, verify the diagrams match the new structure.
🌟 Conclusion
The C4 Model is a powerful tool for managing software architecture documentation. It provides a clear structure that scales with your system. By focusing on the right level of detail for the right audience, you can create documentation that is actually used.
Start with the System Context. Define your boundaries. Then drill down as needed. Keep your diagrams up to date. And remember, the goal is communication, not perfection. With these practices in place, you can document your system in hours, not weeks.

