


Software architecture is inherently complex. As systems grow, the mental models required to understand them expand exponentially. Without a structured approach, communication between developers, stakeholders, and architects breaks down. The C4 Model provides a standardized way to visualize software architecture using a hierarchy of diagrams. This guide walks you through creating your first C4 diagrams, focusing on clarity, audience, and intent.
The C4 Model is not a rigid standard but a flexible framework. It was developed to help teams communicate effectively about how software is structured. By breaking down architecture into four distinct levels, you can zoom in on details only when necessary. This tutorial focuses on the practical application of these concepts, ensuring you build diagrams that convey meaning rather than just technical specifications.
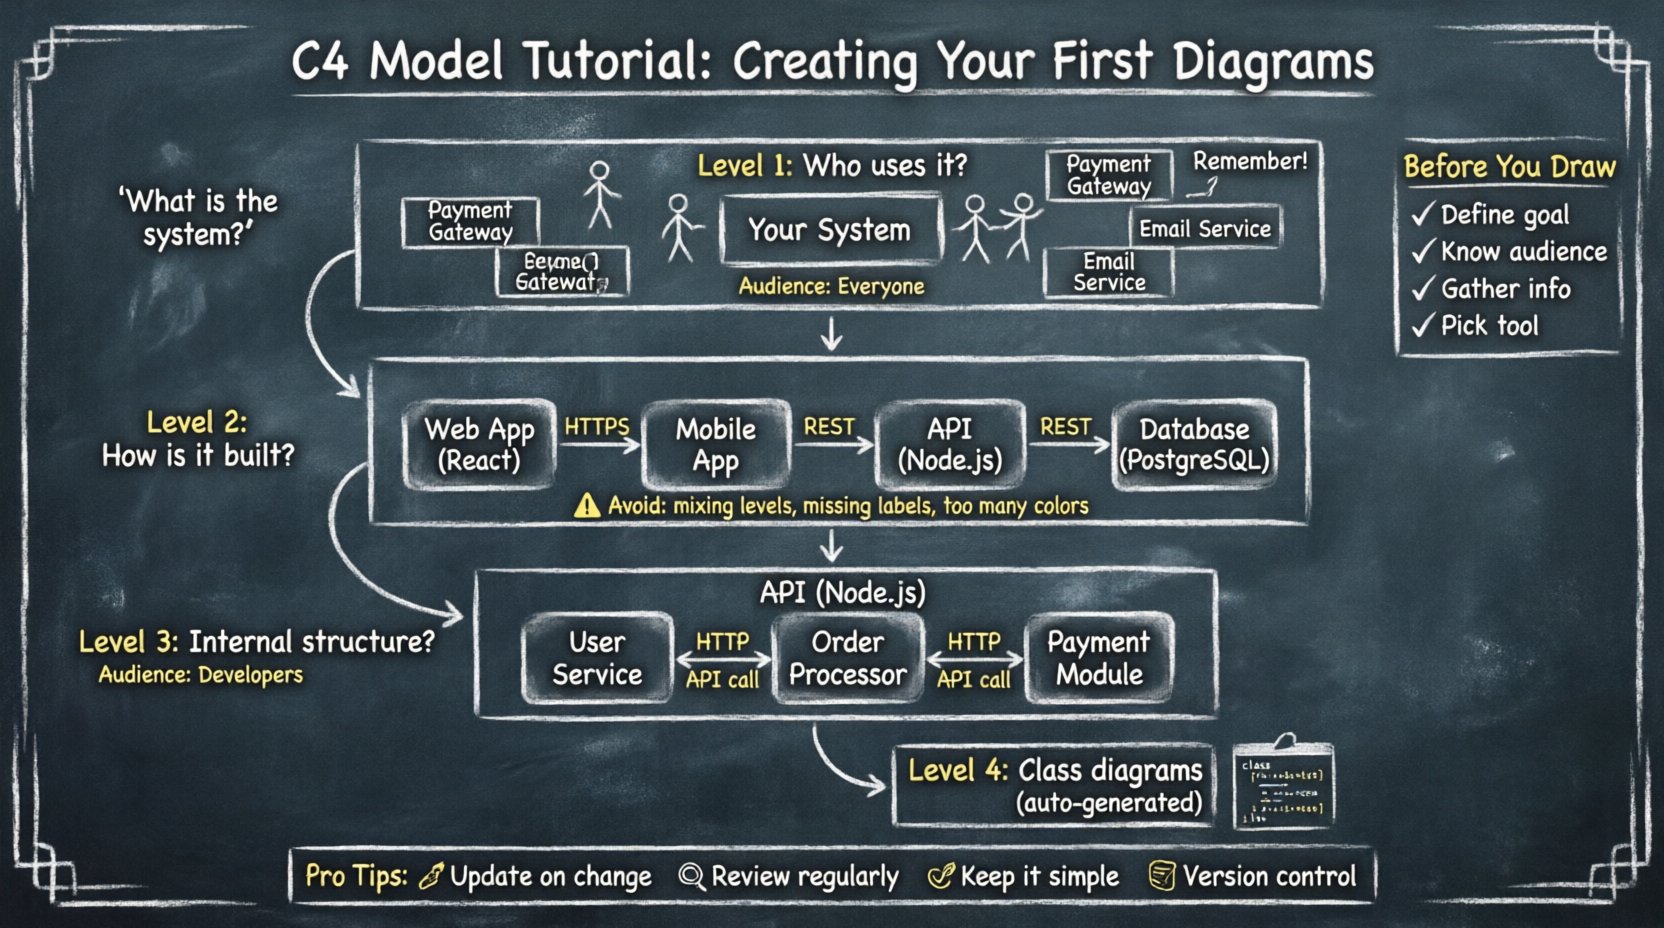
🧩 Understanding the Four Levels
The core of the C4 Model lies in its four hierarchical levels. Each level serves a different audience and answers a specific set of questions. Moving from Level 1 to Level 4 represents moving from high-level context to granular implementation details.
When creating diagrams, it is crucial to know which level you are drawing. Mixing levels or drawing too much detail at the wrong time leads to confusion. Below is a breakdown of the scope and purpose for each stage.
| Level | Diagram Name | Primary Audience | Key Question |
|---|---|---|---|
| 1 | System Context | Everyone (Stakeholders, Developers) | What is the system and who uses it? |
| 2 | Container | Developers, Architects | How is the system built? |
| 3 | Component | Developers | How is the software structured internally? |
| 4 | Code | Developers | How do classes interact? |
Level 1: System Context Diagram
This is the starting point for any architecture visualization. It provides a bird’s-eye view of the software system in question. The goal is to show the system as a single black box and its relationships with the outside world.
- Scope: The entire application or service.
- Elements: People, roles, and external systems.
- Connections: Data flow or interaction protocols.
When drawing this diagram, avoid technical jargon. Focus on business value and interaction. A system context diagram answers the question: “Where does this fit in the ecosystem?”
Level 2: Container Diagram
Once the context is established, you zoom in. A container represents a distinct runtime environment. It is a physical deployment unit, such as a web application, a mobile app, a database, or a microservice.
- Scope: The internal structure of the system.
- Elements: Technologies like Node.js, PostgreSQL, Angular, or AWS Lambda.
- Connections: Protocols like HTTP, TCP, or SQL.
This level bridges the gap between business requirements and technical implementation. It helps developers understand where data lives and how services communicate without diving into code.
Level 3: Component Diagram
Inside a container, there are components. These are logical groupings of functionality. They are not physical files but conceptual boundaries within the software.
- Scope: Specific functionality within a container.
- Elements: Modules, libraries, or classes that perform specific tasks.
- Connections: API calls, method invocations, or internal messaging.
Component diagrams are most useful for onboarding new developers or refactoring specific parts of the codebase. They show how responsibilities are divided.
Level 4: Code Diagram
This level deals with class diagrams and internal logic. While often generated automatically by development tools, it is rarely manually drawn in the C4 process. It is too granular for most architectural discussions.
🛠️ Preparing for Your First Session
Before opening any diagramming software, preparation is key. Rushing into drawing without a plan often results in cluttered and confusing visuals. Follow these preparatory steps to ensure a smooth workflow.
- Identify the Goal: Why are you creating this diagram? Is it for onboarding, documentation, or planning a migration?
- Define the Audience: Who will read this? Executives need Level 1. Developers need Level 2 and 3.
- Gather Information: Talk to the team. Understand the current state of the system. Review existing documentation.
- Choose a Tool: Select a diagramming application that supports the shapes and connectors required by the C4 standard.
Remember that these diagrams are living documents. They should evolve as the system evolves. Do not treat them as one-time artifacts.
🌍 Creating Your First System Context Diagram
Level 1 is the foundation. Without a clear context, the rest of the architecture lacks perspective. Here is a step-by-step approach to building this diagram.
Step 1: Define the System Boundary
Draw a box to represent the software system you are documenting. Label this box clearly with the name of the application. Ensure the name is consistent with how the team refers to it in daily conversation.
- Use a simple rectangle.
- Place the name in the center.
- Do not include internal details here.
Step 2: Identify People and Roles
Who interacts with this system? These are typically end-users, administrators, or external services.
- Use stick figures for human users.
- Label them with their role (e.g., “Customer”, “Admin”, “Support Team”).
- Group similar users if there are many of them.
Step 3: Identify External Systems
What other software does this system talk to? These could be payment gateways, email services, or legacy databases.
- Use standard boxes for software systems.
- Label them with their function (e.g., “Payment Provider”, “CRM”).
- Indicate if they are internal or external.
Step 4: Draw Connections
Draw lines connecting the people and external systems to your main system box. These lines represent data flow.
- Label the lines with the type of data or action (e.g., “Place Order”, “Send Email”).
- Use arrows to show the direction of data flow.
- Keep lines straight or orthogonal to reduce visual noise.
Review the diagram with a non-technical stakeholder. If they understand the flow, you have succeeded.
📦 Creating Your First Container Diagram
Once the context is clear, you need to show how the system is built. This requires breaking the main system box from Level 1 into smaller runtime units.
Step 1: List the Containers
Identify the distinct technologies running the application. A typical web application might have a web server, a mobile app, and a database.
- Draw boxes for each container.
- Label them with the technology name (e.g., “React App”, “PostgreSQL”).
- Group related containers if they share a deployment boundary.
Step 2: Define Relationships
Connect the containers to show how they interact. These connections should reflect the runtime architecture.
- Use arrows to indicate the direction of the request.
- Label the protocol (e.g., “HTTPS”, “REST API”).
- Avoid showing data entities at this stage; focus on the infrastructure.
Step 3: Add Contextual Notes
Include brief descriptions for complex containers. If a container has a specific security requirement or performance constraint, note it briefly.
- Keep notes concise.
- Use them to highlight critical architectural decisions.
- Ensure the diagram remains readable.
This diagram helps developers understand the deployment topology. It is essential for DevOps and infrastructure planning.
⚙️ Creating Your First Component Diagram
Level 3 dives deeper into the logic. This is where you explain how the software works internally. This level is often the most detailed and requires careful organization.
Step 1: Select a Container
Focus on one container at a time. Do not try to map the entire system at this level. Pick the most complex or critical container.
- Isolate the scope to one box from Level 2.
- This prevents the diagram from becoming overwhelming.
Step 2: Identify Responsibilities
Break the container down into functional areas. These are the components.
- Group classes or modules by responsibility (e.g., “User Service”, “Order Processor”).
- Use rounded rectangles for components.
- Keep names descriptive and business-oriented.
Step 3: Map Interactions
Show how components communicate. This includes API calls, event listeners, or data passing.
- Draw lines between components.
- Label the interface or method being called.
- Ensure the flow of control is clear.
Step 4: Avoid Over-Engineering
Do not draw every single class. Focus on the high-level structure. If a component is too complex, consider creating a sub-diagram for it.
- Use hierarchy to manage complexity.
- Hide implementation details that do not affect the overall architecture.
🔄 Maintenance and Evolution
Diagrams are only useful if they are accurate. Over time, software changes, and diagrams can become outdated. Maintaining them requires discipline and strategy.
- Update on Change: If a significant architectural change occurs, update the diagram immediately.
- Review Regularly: Schedule periodic reviews during sprint planning or architectural retrospectives.
- Keep it Simple: Remove deprecated elements. Do not clutter the diagram with historical data.
- Version Control: Store diagram files in the same repository as the code. This ensures traceability.
Common pitfalls include drawing diagrams that are too detailed or failing to document them at all. The goal is balance. A diagram that is 80% accurate and easy to read is better than a 100% accurate diagram that no one understands.
Common Mistakes to Avoid
When creating your first diagrams, watch out for these frequent errors.
- Level Mixing: Putting component details inside a system context diagram.
- Missing Labels: Drawing lines without explaining what flows through them.
- Too Many Colors: Using color for decoration instead of meaning.
- Ignoring Audience: Creating Level 3 diagrams for executive stakeholders.
- Static View Only: Focusing solely on structure without considering data flow or behavior.
📝 Final Thoughts
Mastering the art of architectural visualization takes practice. The C4 Model offers a structured path to clarity. By starting with the System Context and gradually zooming in, you create a narrative that guides your audience through the complexity of your software.
Remember that diagrams are a communication tool, not a design constraint. They should aid understanding, not restrict creativity. As you continue to build your skill, you will find that the act of drawing the diagram often reveals gaps in your own understanding of the system.
Start small. Document one system. Refine the process. Over time, these diagrams will become essential assets for your team, reducing onboarding time and minimizing miscommunication. The effort you put into creating these visuals now will pay dividends in clarity and collaboration later.

