


Software architecture is often described as the backbone of a system, yet describing it remains one of the most challenging tasks for technical professionals. Words frequently fail to capture the complexity, relationships, and boundaries of a software ecosystem. When teams rely solely on documentation or verbal explanations, ambiguity creeps in, leading to misalignment, rework, and friction between stakeholders. Visual models bridge this gap. They provide a shared language that transcends departmental silos.
The C4 Model offers a structured approach to creating these visualizations. It is a hierarchy of diagrams designed to communicate software architecture at different levels of detail. By adopting this model, teams can tailor their communication to the specific audience, ensuring that executives see the high-level business context while developers understand the intricate component interactions. This guide explores how to implement this model to improve clarity, reduce cognitive load, and foster better collaboration across your organization.
🧩 Understanding the C4 Model
The C4 Model is not a tool or a specific software product; it is a conceptual framework for documentation. It organizes architectural views into four distinct levels, each answering a specific set of questions. The hierarchy allows you to zoom in and out of your system without losing the context of the whole.
Traditional documentation often suffers from being either too abstract or too granular. A single document attempting to cover everything usually fails to serve anyone well. The C4 approach separates concerns. It acknowledges that a Product Manager does not need to see the same level of detail as a Database Administrator. By standardizing these views, teams can maintain consistency and ensure that the documentation remains relevant to the reader.
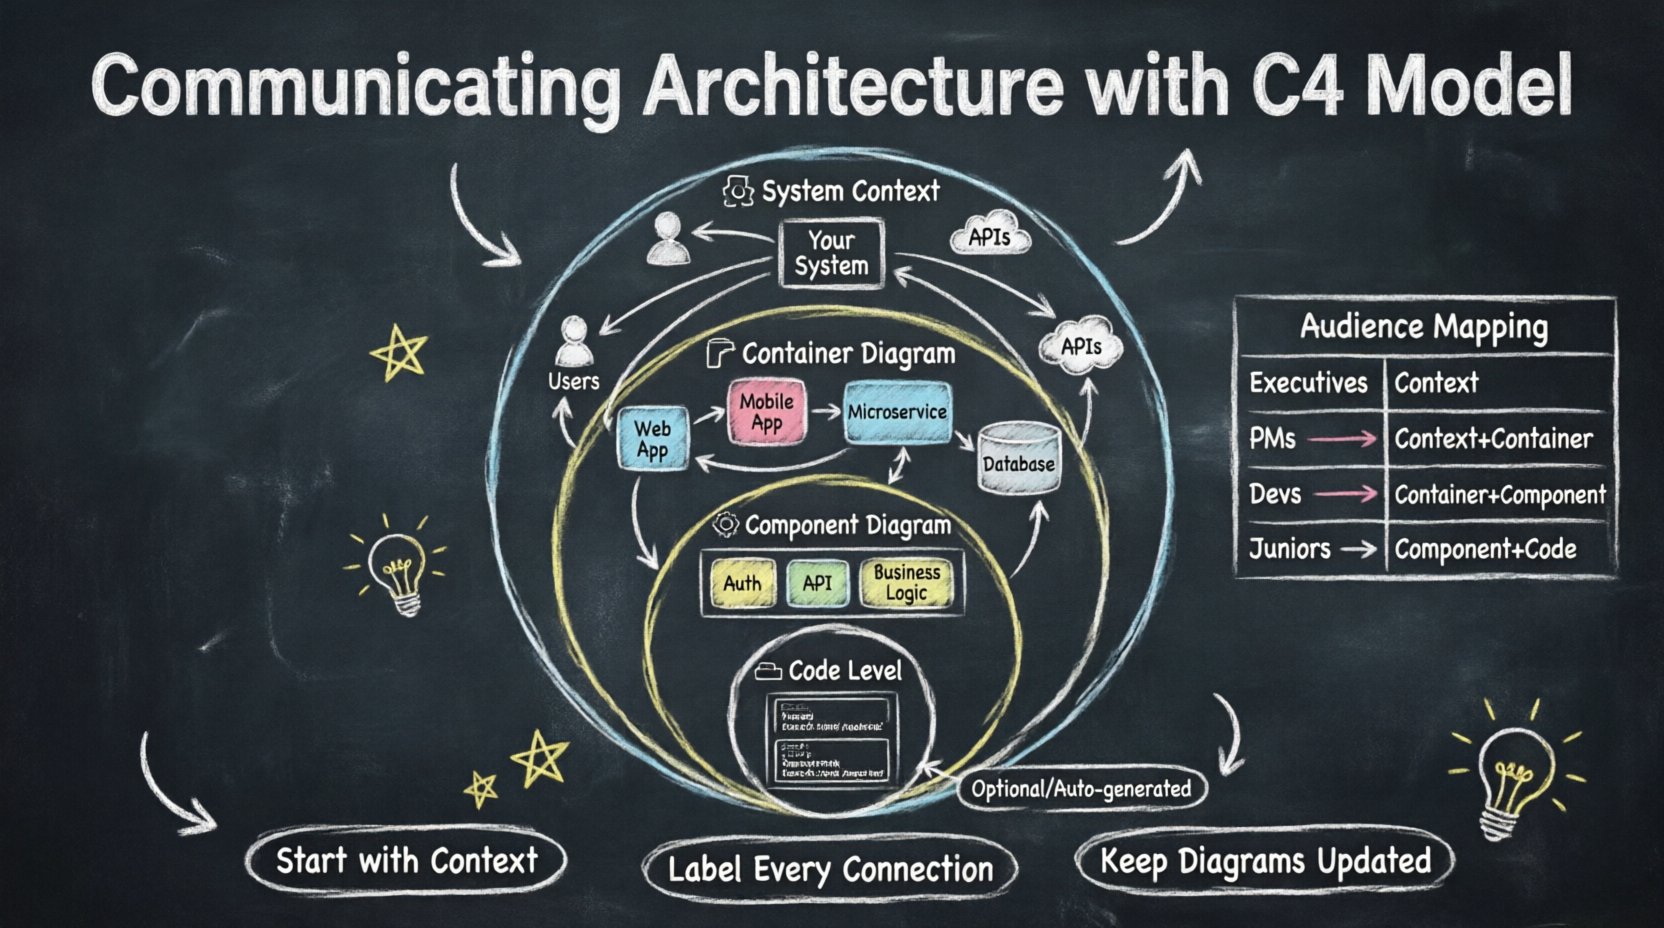
📐 The Four Levels of Abstraction
Each level in the C4 Model serves a specific purpose. Moving from the top level down involves adding more detail while narrowing the scope. Understanding the distinct characteristics of each level is crucial for effective communication.
1. System Context Diagram 🌍
The first level provides the highest-level overview. It depicts the system being built as a single box within a broader landscape. This diagram answers the question: “Where does this system sit in the world?”
- Scope: The entire system is represented as one box.
- Actors: People, systems, or organizations that interact with your system are shown outside the box.
- Relationships: Lines connect the system to these external actors, indicating how data or control flows between them.
This view is primarily for external stakeholders. It clarifies boundaries. It defines what is inside your responsibility and what is outside. It is particularly useful when onboarding new team members or explaining the project to non-technical leadership. It prevents scope creep by clearly marking the perimeter of the system.
2. Container Diagram 📦
The second level zooms into the system box from the first level. Here, the system is broken down into its major building blocks. A container is a distinct, deployable unit of software. It represents a technology choice or a major functional chunk.
- Containers: Examples include web applications, mobile apps, microservices, databases, or data warehouses.
- Technology: While you can mention the technology used, the focus should be on the role of the container, not the specific brand.
- Connections: Lines show how these containers communicate with each other and with the external actors defined in the context diagram.
This diagram is essential for developers and architects. It helps visualize the technology stack and the interaction between high-level services. It answers: “What are the main parts of this system and how do they talk to each other?” It is the most commonly used diagram for internal team alignment on system design.
3. Component Diagram ⚙️
The third level zooms further into a single container. A component represents a logical grouping of functionality within a container. It is a collection of related classes, functions, or modules that work together to fulfill a specific responsibility.
- Granularity: Components are more detailed than containers but less detailed than individual classes.
- Responsibility: Each component should have a clear, singular purpose.
- Interfaces: The diagram highlights the interfaces between components, showing how they depend on one another.
This view is critical for understanding the internal structure of a service. It helps developers understand where to place new code and how changes in one module might impact others. It answers: “How is this specific service organized internally?”
4. Code Diagram 💻
The fourth level zooms into a component to show the specific classes, interfaces, and data structures. In practice, this level is often optional. It is rarely updated manually and is usually generated from the codebase.
- Detail: Shows class names, methods, and relationships.
- Maintenance: Because code changes frequently, maintaining these diagrams manually is difficult.
- Usage: Best used for onboarding or deep-dive debugging sessions.
Most teams skip this level in favor of code comments or automated documentation tools. It is useful when the architecture is complex and requires a deep dive into specific logic flows.
👥 Mapping Diagrams to Audiences
Not every stakeholder needs every diagram. Using the wrong level of detail can confuse the audience or waste their time. The following table outlines the best fit for common roles within an organization.
| Role | Recommended Level | Focus Area |
|---|---|---|
| Executive / Leadership | System Context | Business value, boundaries, external dependencies |
| Product Manager | System Context & Container | Features, major services, user flow |
| DevOps / SRE | Container | Deployment units, infrastructure, data stores |
| Backend Developer | Container & Component | Service interaction, internal logic structure |
| Frontend Developer | Container | API interfaces, client-server boundaries |
| Junior Developer | Component & Code | Code structure, class relationships, onboarding |
Aligning the diagram with the audience ensures that the information is digestible. For example, showing a component diagram to a CTO might be overwhelming and miss the strategic point. Conversely, showing a context diagram to a lead engineer might be too vague to be useful.
🛠️ Best Practices for Diagramming
Creating diagrams is an art that requires discipline. There are common pitfalls that can degrade the value of the documentation over time. Adhering to a set of best practices ensures the diagrams remain a reliable source of truth.
- Start with the Context: Never begin with a component diagram. Establish the system boundaries first. This provides the necessary frame of reference for all subsequent diagrams.
- Use Consistent Notation: Define a standard for how boxes and lines are drawn. Use standard shapes for containers and lines for data flows. Consistency reduces cognitive load.
- Focus on Relationships: The most important part of a diagram is the connection. Explain how data moves. A diagram without relationships is just a list of boxes.
- Keep it Updated: An outdated diagram is worse than no diagram at all. It creates a false sense of security. Integrate diagram updates into the definition of done for features.
- Avoid Clutter: If a diagram becomes too busy, split it. It is better to have three simple diagrams than one complex wall of text and lines.
- Label Connections: Do not rely on the reader to guess what a line means. Label every connection with the type of data or protocol being used.
🔄 Maintenance and Lifecycle
Documentation is often treated as a one-time task. However, software architecture is dynamic. As features are added and technologies evolve, the diagrams must reflect these changes. Treating diagrams as living documents is key.
To maintain the health of your architectural documentation:
- Automate Where Possible: Use tools that can generate diagrams from code or configuration files. This reduces the manual effort required to keep the code diagram or container diagram accurate.
- Review During Sprint Planning: Allocate time during planning sessions to update the high-level diagrams. If a new service is added, update the container diagram immediately.
- Version Control: Store diagrams in the same repository as the code. This ensures that documentation changes are reviewed alongside code changes in pull requests.
- Assign Ownership: Designate specific team members responsible for keeping the architectural views current. This prevents the “everyone thinks someone else did it” scenario.
⚠️ Common Pitfalls to Avoid
Even with the best intentions, teams often fall into traps that reduce the utility of the C4 Model. Being aware of these common mistakes can save significant time and effort.
| Pitfall | Impact | Mitigation Strategy |
|---|---|---|
| Over-Engineering | Wastes time on unnecessary detail | Stop at the level of detail required for the audience |
| Diagram Drift | Docs no longer match the code | Integrate updates into CI/CD pipelines |
| Too Many Tools | Fragmented information | Stick to one platform for all diagrams |
| Ignoring Data Flow | Missing critical context | Always label arrows with data types |
| Lack of Context | Readers don’t understand scope | Always include the System Context diagram |
One of the most frequent errors is trying to draw everything at once. This leads to diagrams that are impossible to read. It is better to iterate. Start with the context, get agreement on that, then move to containers. Do not attempt to finalize the component diagram until the container boundaries are stable.
🤝 Integrating into Workflow
To truly communicate architecture effectively, the diagrams must be embedded into the daily workflow. They should not exist in a separate wiki or a static folder. They need to be part of the conversation.
When introducing a new feature, start by updating the relevant diagram. Discuss the changes in the design review. This makes the diagram a living artifact of the design process rather than a retrospective record. It encourages ownership and accountability.
Furthermore, use the diagrams during onboarding. New hires can study the context and container diagrams to understand the system landscape before diving into the code. This accelerates their time to productivity and reduces the burden on senior developers to explain the basics repeatedly.
📈 Measuring Success
How do you know if your architectural communication is improving? There are qualitative and quantitative indicators to watch for.
- Reduced Questions: If the number of “What does this do?” questions drops, the documentation is likely effective.
- Faster Onboarding: New team members should be able to navigate the system with fewer meetings.
- Better Design Decisions: Teams should make fewer architectural mistakes because the boundaries and interactions are clear.
- Stakeholder Alignment: Executives and developers should be able to discuss the system using the same terminology derived from the diagrams.
🚀 Moving Forward
Adopting the C4 Model is a shift in mindset. It requires discipline to maintain the diagrams and humility to acknowledge that documentation is a shared responsibility. However, the return on investment is significant. Clear communication reduces risk, speeds up development, and improves system reliability.
Start small. Create a system context diagram for your most complex service. Share it with the team. Gather feedback. Iterate. Over time, this practice will become second nature. The goal is not perfection, but clarity. By focusing on the right level of detail for the right audience, you transform architecture from a hidden complexity into a visible asset that drives the business forward.
Remember that the value lies in the understanding, not the drawing. Use the model as a tool to facilitate conversation, not as a replacement for it. When the diagrams and the team speak the same language, the architecture becomes a foundation for growth rather than a barrier to progress.

