


Software architecture is the backbone of any successful digital product. It defines how components interact, how data flows, and how the system scales. However, as systems grow in complexity, communication between developers, stakeholders, and business owners often breaks down. This is where the C4 Model comes in. It provides a standardized way to visualize and communicate software architecture using a hierarchy of diagrams. This guide will walk you through the C4 Model, explaining each level, how to create them, and why they matter for your team.
🤔 What Is the C4 Model?
The C4 Model is a conceptual model for visualizing the software architecture of a system. It was created to address the confusion surrounding different diagramming standards and the lack of a clear hierarchy. Instead of one massive, confusing diagram, the C4 Model breaks architecture down into four levels of abstraction. Each level zooms in closer to the code, providing the right amount of detail for a specific audience.
Think of it like a map. You wouldn’t use a street-level map to plan a cross-country road trip. Similarly, you wouldn’t use a detailed code diagram to explain a system to a project manager. The C4 Model ensures you have the right map for the right journey.
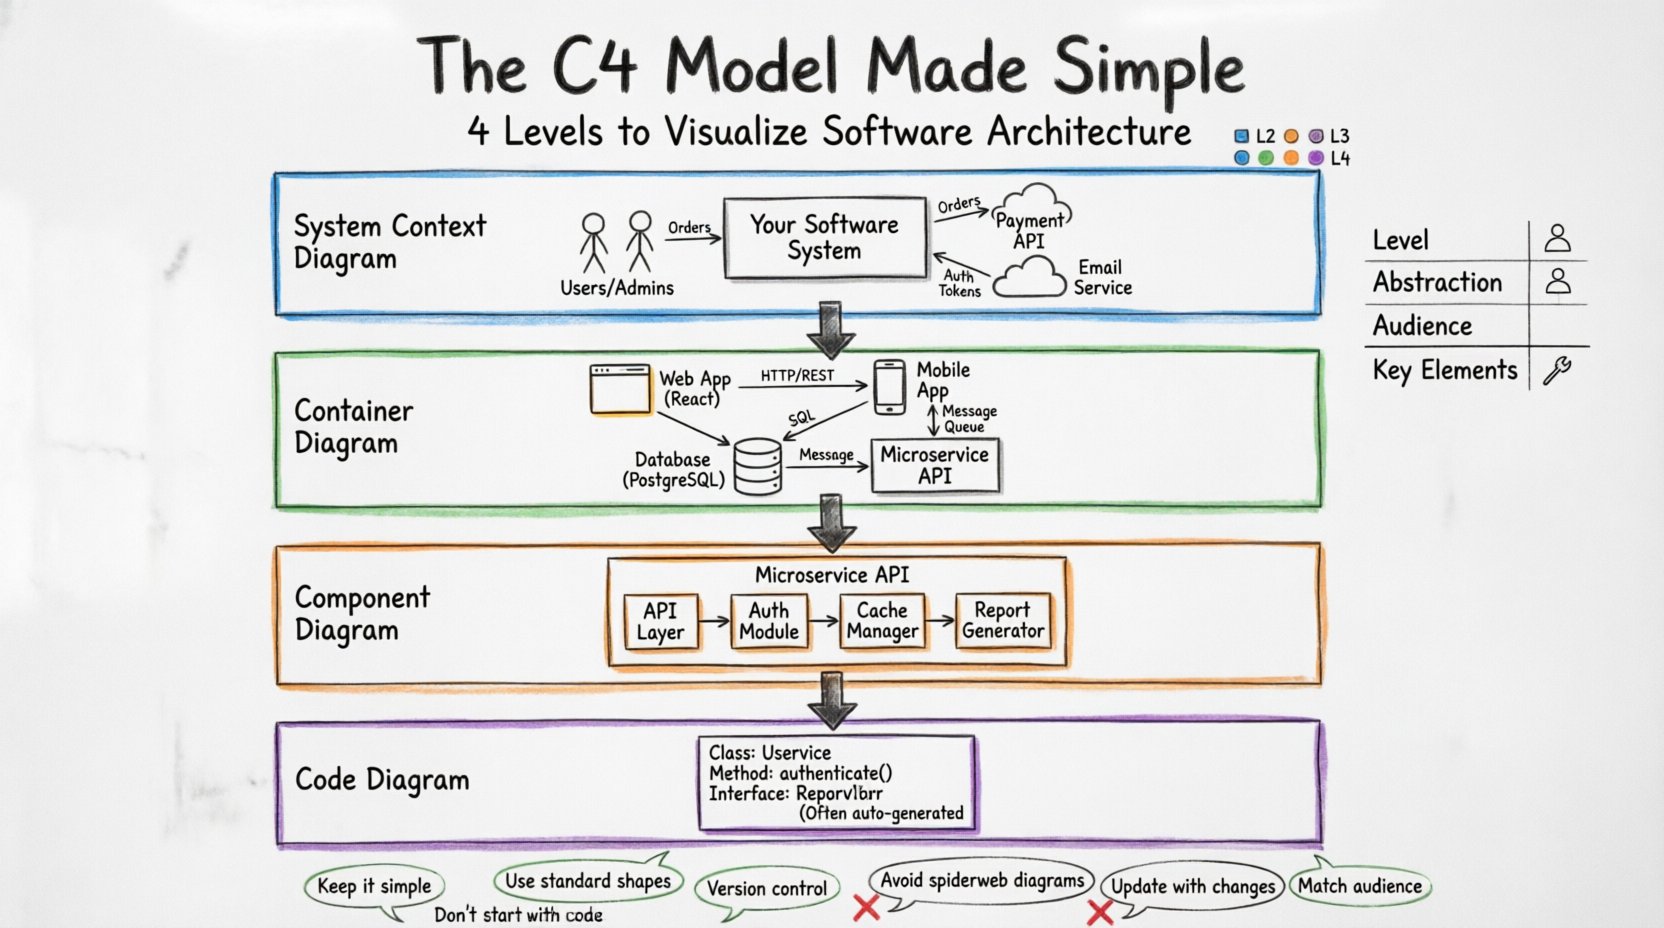
Here are the four levels:
Level 1: System Context Diagram – The big picture.
Level 2: Container Diagram – The high-level structure.
Level 3: Component Diagram – The internal logic.
Level 4: Code Diagram – The implementation details.
By using this hierarchy, teams can maintain documentation that stays relevant and readable. It prevents the common issue of diagrams becoming outdated or too complex to understand.
🌍 Level 1: System Context Diagram
The System Context Diagram is the entry point. It shows your software system as a single box in the middle of a wider landscape. This level is designed for people who need to understand the boundaries of the system without knowing how it works internally.
👥 Who Uses This Diagram?
Business Stakeholders
Project Managers
New Developers
External Partners
📦 What Goes Into the Diagram?
At this level, you focus on relationships with the outside world. You do not draw internal components. You only draw:
The System Itself: Represented as a central box. It usually has a name that describes the product or service.
People: Users, administrators, or operators who interact with the system directly.
External Systems: Other software systems that your system talks to. For example, a payment gateway, a database service, or a third-party API.
🔗 Understanding Relationships
Lines connect these elements. The lines are not just decoration; they describe the type of interaction. Common relationship types include:
Association: A person uses the system.
Communication: Data flows between systems. This could be an API call, a file transfer, or a message queue.
Dependency: One system relies on another to function.
Keep the labels on the lines clear. Instead of just drawing a line, write what is being exchanged. For instance, “Orders” or “Authentication Tokens”. This clarity helps stakeholders understand the data flow without needing technical expertise.
🏢 Level 2: Container Diagram
Once you understand the boundaries, you need to see what is inside. The Container Diagram zooms in on the system box from Level 1. It reveals the technology choices and high-level structures that make up the system.
👥 Who Uses This Diagram?
Developers
DevOps Engineers
Architects
Tech Leads
📦 What Are Containers?
A container is a high-level building block. It is not a single piece of code, but rather a deployable unit. Examples of containers include:
A Web Application (e.g., a React or Angular app running in a browser).
A Mobile Application (iOS or Android).
A Microservice (a backend API running in a container).
A Database (SQL or NoSQL).
A Scheduled Job (a background process that runs periodically).
A File Repository (storage for documents and media).
Each container is a distinct technology choice. This level helps developers understand the technology stack without getting bogged down in code.
🔗 How to Draw Connections
Just like in the System Context, you draw lines between containers. These lines represent data flow. It is important to specify the protocol or technology used for communication.
HTTP/REST: Standard web requests.
gRPC: High-performance remote procedure calls.
WebSocket: Real-time bidirectional communication.
SQL: Direct database queries.
Message Queue: Asynchronous communication via a broker like RabbitMQ or Kafka.
If a container talks to another, draw a line and label it. If they do not talk, do not draw a line. This negative space is also informative; it shows what is decoupled.
🧩 Level 3: Component Diagram
Now we zoom in further. The Container Diagram shows the major buckets. The Component Diagram shows what is inside those buckets. A component is a logical grouping of code. It represents a specific function or capability within a container.
👥 Who Uses This Diagram?
Developers working on specific features.
Code Reviewers
System Integrators
📦 What Is a Component?
A component is a cohesive unit of functionality. It is not a physical file, but a logical grouping. Examples include:
API Layer: Handles incoming requests and responses.
Database Layer: Manages data persistence and queries.
Authentication Module: Handles user login and permissions.
Report Generator: Creates PDFs or data exports.
Cache Manager: Handles temporary data storage.
This level is crucial for understanding how a single container is organized. It helps developers see the separation of concerns within a service or application.
🔗 Relationships Between Components
Components interact with each other. These interactions define the internal architecture. Common relationships include:
Dependency: Component A needs Component B to work.
Interface: Component A exposes an interface that Component B uses.
Usage: Component A calls a method in Component B.
Focus on the public interfaces. You do not need to show every private method. The goal is to show how the parts fit together to provide a service. If a component is too detailed, you might be drifting into code-level details.
💻 Level 4: Code Diagram
The final level is the Code Diagram. This is often the most detailed view. It shows the actual classes, functions, and methods. However, this level is often generated automatically from the codebase, as drawing it manually is time-consuming.
👥 Who Uses This Diagram?
Senior Developers
Debugging Specialists
Code Auditors
📦 What Is Included?
Classes
Interfaces
Methods
Properties
Data Structures
⚠️ When to Use This Level
Do not draw this level for every system. It is too detailed for most planning or communication tasks. Use it only when you are debugging a specific issue or analyzing a complex algorithm. Most of the time, Levels 1, 2, and 3 are sufficient.
Automated tools can generate this diagram from source code. This ensures the documentation is always up to date with the actual implementation.
📊 Comparing the Levels
To make the differences clear, here is a comparison table summarizing the four levels.
Level | Abstraction | Audience | Key Elements |
|---|---|---|---|
1. System Context | High | Stakeholders, Managers | People, Systems |
2. Container | Medium | Developers, Architects | Web Apps, Databases, Services |
3. Component | Low | Developers | Modules, Features, Logic |
4. Code | Very Low | Developers, Debugging | Classes, Methods |
🛠️ How to Create Your Own Diagrams
Creating these diagrams is a process. You should not try to draw everything at once. Follow a step-by-step approach to ensure clarity and accuracy.
🚀 Step 1: Start with the System Context
Begin at the highest level. Draw your system as a single box. Ask yourself: Who uses this? Who does it talk to? Draw the people and external systems. Label the lines with what is being exchanged. This sets the stage for everything else.
🚀 Step 2: Drill Down to Containers
Take the central system box from Step 1 and expand it. Inside, draw the containers. Ask: What technologies are we using? Is there a web app? A database? A mobile app? Draw the lines between them. Label the protocols. This defines the architecture.
🚀 Step 3: Expand the Components
Choose a complex container and expand it. Draw the components inside. Ask: What are the major functions? Where does the data come from? How is it processed? Draw the connections. This helps developers understand the internal logic.
🚀 Step 4: Review and Refine
Once the diagrams are drawn, review them. Are the labels clear? Is the technology stack accurate? Are the relationships correct? Update them as the system changes. Documentation should live alongside the code.
🧠 Best Practices for Documentation
Documentation often becomes stale. To prevent this, follow these best practices.
Keep it Simple: Avoid unnecessary detail. If a box can be merged, merge it. If a line is redundant, remove it.
Use Standard Notation: Stick to the C4 shapes. Use rectangles for systems, cylinders for databases, and stick figures for people. This makes diagrams instantly recognizable.
Version Control: Store your diagrams in the same repository as your code. This ensures they are updated with every commit.
Automate Where Possible: Use tools to generate diagrams from code for Level 4. Use templates for Levels 1-3 to save time.
Focus on the Audience: Do not show code details to business stakeholders. Do not show business logic to developers. Match the diagram level to the reader.
Regular Reviews: Schedule time during sprint reviews to update diagrams. Treat them as code that needs maintenance.
⚠️ Common Mistakes to Avoid
Even with a clear model, teams often make mistakes. Here are the most common pitfalls.
Starting with Code: Do not start at Level 4. It is too detailed. Start at Level 1 and work your way down.
Too Many Lines: If a diagram looks like a spiderweb, it is too complex. Reduce the number of connections. Focus on the critical paths.
Ignoring External Systems: Do not assume the system works in a vacuum. Always show how it connects to the outside world in Level 1.
Outdated Information: If the code changes and the diagram does not, the diagram is useless. Update it immediately.
Confusing Containers and Components: Remember, a container is a deployable unit (like a database). A component is a logical grouping (like a service). Do not mix them up.
Using Proprietary Shapes: Stick to standard shapes. Custom icons can confuse readers who are used to the standard model.
🔄 Maintaining the Model Over Time
Software architecture is not static. Systems evolve. Features are added. Technologies change. The C4 Model must evolve with them.
Establish a process for updates. When a new container is added, update the Level 2 diagram. When a new component is introduced, update the Level 3 diagram. Ensure that the documentation is part of the definition of done for every feature.
This integration ensures that the documentation reflects reality. It becomes a living asset rather than a forgotten artifact. Teams that maintain their architecture diagrams find it easier to onboard new members and debug complex issues.
🎯 Final Thoughts
The C4 Model offers a structured approach to software architecture documentation. By breaking down complexity into four distinct levels, it allows teams to communicate effectively across different roles and technical depths. It removes the ambiguity that often plagues system design discussions.
Start small. Begin with a System Context Diagram. Expand as needed. Do not over-engineer the documentation. The goal is clarity, not perfection. With consistent practice and maintenance, the C4 Model becomes a powerful tool for building better software.
Remember, the best diagram is the one that is actually used. Keep it relevant, keep it accurate, and keep it simple. This approach will serve your team well as your systems grow in scale and complexity.

