


Integrating a new developer into a complex software ecosystem is one of the most challenging tasks in technology leadership. The cost of time, the risk of introducing bugs due to misunderstanding, and the frustration of navigating opaque systems create significant friction. Traditional documentation often fails to bridge the gap between high-level business goals and low-level implementation details. This gap leaves new team members guessing, asking repetitive questions, and struggling to find their footing.
There is a structured approach to solving this problem that focuses on abstraction and clarity. By adopting the C4 model, organizations can create a visual narrative that guides new hires from the broad context of the system down to the specific code structures. This method reduces cognitive load and accelerates the time-to-productivity for incoming talent. This guide explores how to implement this strategy effectively without relying on specific tools, focusing instead on the principles of architecture visualization and knowledge transfer.
Understanding the C4 Model 📚
The C4 model provides a hierarchical framework for visualizing software architecture. It is not merely a drawing convention; it is a communication tool designed to separate concerns. By dividing the architecture into distinct levels of abstraction, it allows stakeholders to focus on what matters at their current stage of understanding. For onboarding, this is critical because a new hire does not need to understand every line of code on day one. They need to understand the system’s purpose, its boundaries, and how data flows through it.
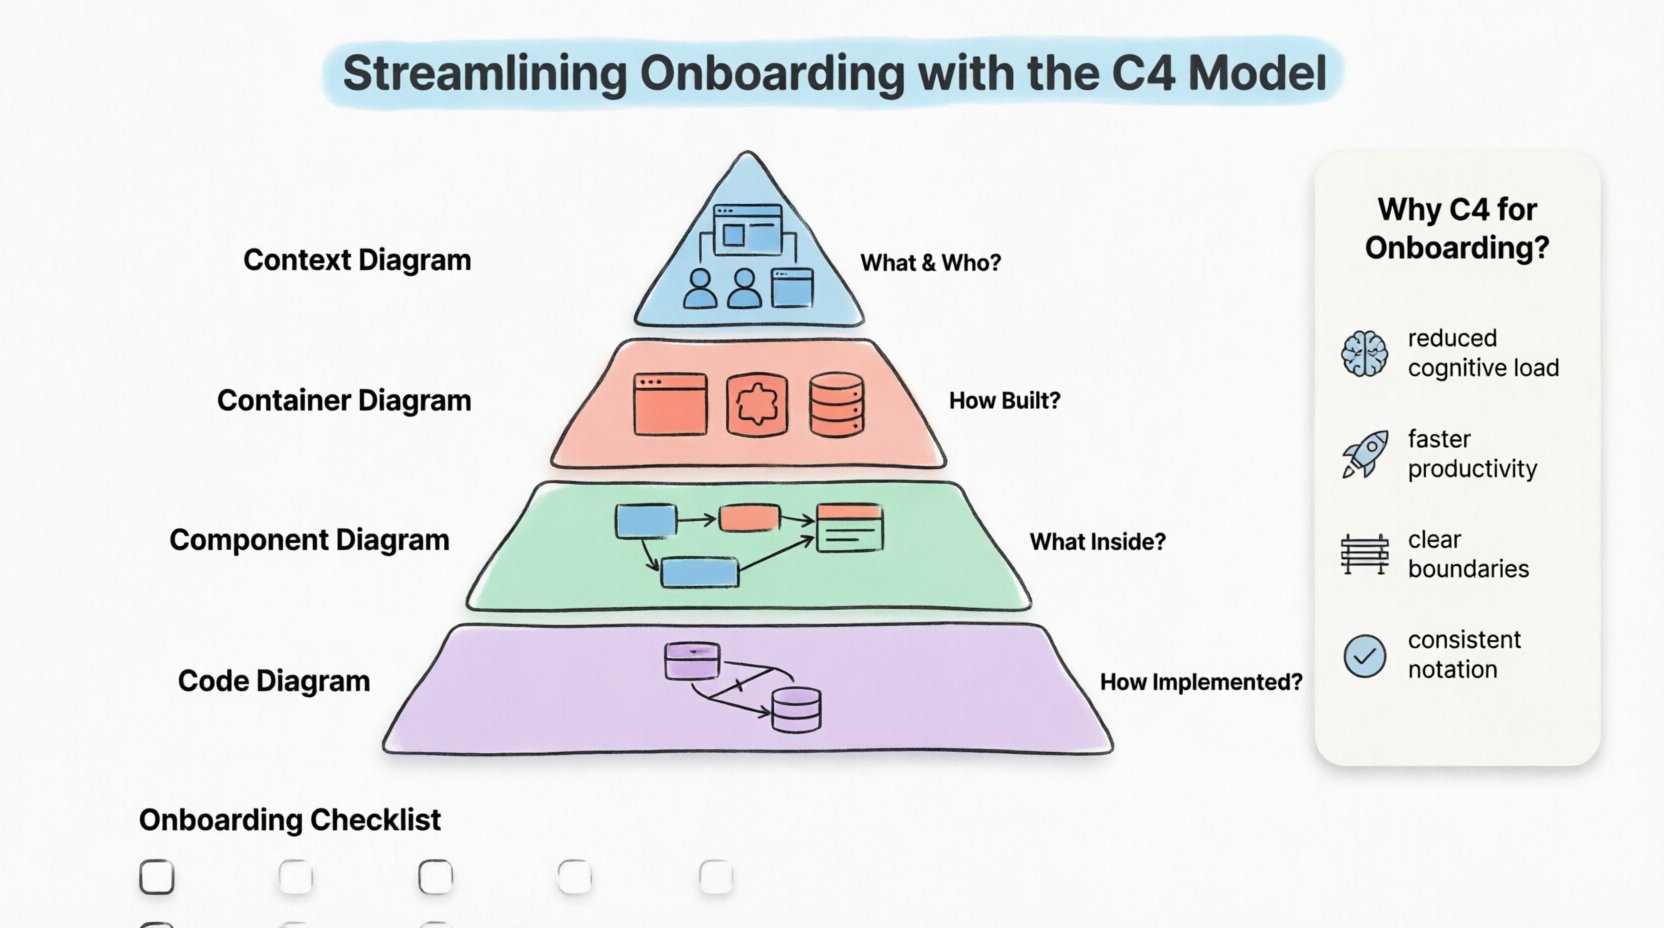
At its core, the model consists of four levels:
- Level 1: Context Diagram – Shows the system as a whole and how it interacts with users and other systems.
- Level 2: Container Diagram – Breaks the system down into runtime environments, such as web servers, mobile apps, or databases.
- Level 3: Component Diagram – Details the logical building blocks within a container.
- Level 4: Code Diagram – Illustrates the class structure or database schema within a specific component.
Each level serves a specific audience and provides a specific answer to a specific question. When used for onboarding, these levels act as a curriculum. New employees start at Level 1 to grasp the business value, then move deeper as their responsibilities increase.
The Hierarchy of Abstraction
Confusion often arises when documentation mixes these levels. A diagram that shows high-level business actors alongside specific database tables overwhelms the reader. The C4 model enforces discipline by keeping these concerns separate. This separation is vital for onboarding because it allows a new developer to self-select the depth of information they need at any given moment.
Why Onboarding Fails Without Structure 📉
Before implementing a solution, it is essential to understand the problem. In many engineering teams, the onboarding process relies on verbal handovers, scattered README files, or code that is difficult to trace. This approach leads to several recurring issues:
- Information Silos: Knowledge resides in the heads of senior staff rather than in accessible documentation.
- Outdated Artifacts: Diagrams created years ago do not reflect the current state of the software, leading to confusion and errors.
- Lack of Context: New hires see code without understanding why it exists or how it fits into the broader business strategy.
- High Cognitive Load: Trying to learn the system while trying to fix bugs creates mental fatigue and slows progress.
Without a standardized visualization method, every engineer draws diagrams differently. One team might use boxes for services, while another uses cylinders for databases. This inconsistency forces new hires to learn the team’s specific notation before they can understand the architecture itself. A standard model eliminates this barrier.
Implementing the Model for New Teams 🚀
To streamline onboarding, the implementation of the C4 model must be treated as a documentation project, not just a drawing exercise. It requires planning, maintenance, and a clear strategy for how the diagrams are consumed.
Creating the Context First
On day one, the new hire should not be asked to look at code. They should be asked to look at the Context Diagram. This diagram answers the question: “What does this system do, and who uses it?”
This level includes:
- The System Itself: Represented as a single box in the center.
- People: Users, administrators, or operators who interact with the system.
- Other Systems: External dependencies, such as payment gateways, CRM tools, or legacy databases.
By starting here, the new employee understands the business boundaries. They learn which systems are internal and which are external. This prevents them from making assumptions about what they can modify or what is fixed by a third party. It sets the stage for understanding the scope of their work.
Detailing the Containers
Once the context is clear, the focus shifts to the Container Diagram. This level answers: “How is the system built, and what technologies are used?”
A container represents a distinct unit of deployment. Examples include:
- A web application running on a server.
- A mobile application running on a device.
- A microservice running in a cloud environment.
- A database server storing persistent data.
For onboarding, this diagram is crucial for technical alignment. It tells the new hire which languages, frameworks, and infrastructure patterns are in play. It clarifies communication protocols between these containers, such as HTTP, gRPC, or message queues. This reduces the time spent searching through configuration files to understand how services talk to one another.
Documenting Components
The Component Diagram answers: “What are the key logical building blocks inside a container?”
This level is typically for the engineers who will be working directly on the code. It breaks down a container into manageable chunks. A component might be a service, a module, or a package. It describes the responsibilities of that component and its dependencies on other components.
When onboarding a developer to a specific team, providing the component diagrams for that team’s containers allows them to understand the internal logic without being overwhelmed by the entire system. It highlights the separation of concerns within the codebase.
Avoiding Over-Engineering
A common mistake is to create a Level 4 Code Diagram for every single class. This is unnecessary for onboarding and often detrimental. Code diagrams should only be created for complex logic or critical data structures. For most onboarding scenarios, Levels 1 through 3 provide sufficient clarity. Focusing on code-level details can distract from the architectural understanding required to make good decisions.
Maintenance and Evolution 🔄
Documentation that is not maintained becomes a liability. If the diagrams do not match the code, new hires will lose trust in the documentation entirely. This is a critical risk in the C4 model adoption.
To ensure the diagrams remain useful:
- Integrate into the Workflow: Diagram updates should be part of the definition of done for pull requests.
- Assign Ownership: Designate specific individuals or teams to maintain specific diagrams.
- Review Regularly: Schedule quarterly reviews to remove obsolete elements and update connections.
- Keep it Simple: If a diagram is too complex to update, simplify the architecture or the diagram itself.
When new features are added, the architecture changes. If the C4 diagrams are not updated, the onboarding process for the next hire will be slower. The goal is to make the documentation a living artifact of the system, not a static record of the past.
Best Practices for Documentation 📝
Creating the diagrams is only half the battle. Making them accessible and understandable is the other half. Here are practical strategies to enhance the onboarding experience using these visualizations.
Use Consistent Notation: Always use the same shape for the same type of element. Boxes for systems, cylinders for databases, and so on. Consistency reduces the mental effort required to interpret the images.
Focus on Relationships: The arrows between elements are often more important than the elements themselves. Clearly label the data flowing through these connections. Is it user input? Is it an API key? Is it a log entry? Labeling these flows helps new hires understand the data lifecycle.
Provide Explanations: A diagram is not self-explanatory. Always accompany the visual with a brief text summary. Explain the “why” behind the design decisions. For example, “We chose a database here to ensure data consistency across services.” This context is invaluable for new engineers.
Version Control: Store the diagram definitions alongside the code repository. This ensures that the documentation evolves with the software. If a branch is created for a feature, the diagram should be updated in that branch as well.
Common Pitfalls to Avoid ⚠️
Even with a good strategy, teams often stumble during implementation. Being aware of these common traps can save significant time and effort.
- Ignoring the Audience: A diagram meant for a CTO differs from one meant for a junior developer. Ensure the onboarding materials are tailored to the experience level of the new hire.
- Too Much Detail: Including every single API endpoint in a container diagram makes it unreadable. Keep the focus on the major flows and critical paths.
- Static Images Only: Relying solely on PNG or JPG files makes editing difficult. Use tools that allow for source-code based diagram generation where possible, so changes are easier to manage.
- Assuming Everyone Knows the Domain: Do not assume the new hire understands the business terminology. Define acronyms and business terms within the documentation.
One specific pitfall is the “Architecture Decision Record” (ADR) disconnect. While C4 diagrams show the structure, ADRs explain the choices. For onboarding, linking the diagram to the relevant ADRs provides a complete picture of the system’s history and constraints.
Measuring Success 📊
How do you know if the C4 model is improving onboarding? You need to define metrics that reflect the efficiency of the knowledge transfer process.
- Time to First Commit: Track how long it takes a new hire to make their first code contribution. A reduction in this time suggests better preparation.
- Question Frequency: Monitor the volume of basic architectural questions asked during the first few weeks. A decrease indicates the documentation is answering questions before they are asked.
- Bug Rates: Review the number of bugs introduced by new hires in the first month. If these bugs are related to architectural misunderstandings, the documentation needs refinement.
- Satisfaction Surveys: Ask new hires directly about the clarity of the provided materials. Their feedback is the most direct indicator of usability.
These metrics should be reviewed periodically. If the time to first commit remains high despite updated diagrams, the issue might lie in the code quality or the complexity of the tasks assigned, rather than the documentation itself.
Comparison of C4 Levels for Onboarding
| Level | Primary Question | Target Audience | Onboarding Value |
|---|---|---|---|
| Context | What is it and who uses it? | Stakeholders, PMs, New Hires | Establishes boundaries and business value immediately. |
| Container | How is it built? | Developers, DevOps | Clarifies technology stack and deployment units. |
| Component | What is inside? | Developers | Explains logical separation and internal logic flow. |
| Code | How is it implemented? | Senior Developers, Reviewers | Deep dive into specific class structures or schemas. |
Onboarding Checklist for Architecture
To ensure the C4 model is effectively utilized during the onboarding phase, teams can follow this structured checklist.
- ☐ Provide Access: Ensure the new hire has access to the documentation repository and diagram viewing tools.
- ☐ Review Context: Walk through the Context Diagram to align on business goals.
- ☐ Explore Containers: Discuss the Container Diagram to identify the tech stack.
- ☐ Deep Dive Components: Review Component Diagrams for the specific service the hire will support.
- ☐ Identify Dependencies: Highlight external systems and third-party integrations.
- ☐ Set Up Environment: Ensure local development environments match the documented architecture.
- ☐ Assign Mentor: Pair the new hire with a senior engineer to validate understanding.
- ☐ Feedback Loop: Schedule a review after two weeks to discuss documentation gaps.
Final Thoughts
Streamlining onboarding is not about rushing a new employee through the codebase. It is about providing them with a map that accurately reflects the territory they are exploring. The C4 model offers a disciplined way to create this map, ensuring that every level of abstraction serves a clear purpose.
By separating context from implementation, teams reduce the noise that typically surrounds complex systems. New hires gain confidence faster because they understand the “why” before the “how.” This leads to better decision-making, fewer errors, and a more cohesive team culture.
Investing time in architecture visualization pays dividends over the lifespan of the software. It turns the onboarding process from a chaotic scramble into a structured learning journey. When the documentation is clear, consistent, and maintained, the entire organization benefits from increased velocity and reduced risk.
Start with the Context. Build the Containers. Detail the Components. Maintain the diagrams. This path leads to a more resilient architecture and a more capable team.

