


Software architecture is often invisible. It exists in the code, the servers, and the decisions made by engineers, but rarely in a shared mental model. When teams communicate about complex systems, words fall short. Misunderstandings arise, and technical debt accumulates in the form of unclear boundaries. This is where the C4 Model steps in. It provides a standardized way to visualize software architecture across different levels of abstraction.
Using the C4 model allows architects and developers to create diagrams that tell a story. Instead of overwhelming stakeholders with every class and method, the C4 approach zooms in from the big picture down to the specific logic. This guide explores how to apply the C4 model in practical scenarios, ensuring your diagrams serve their purpose: clarity.
🧩 Understanding the Four Levels of Abstraction
The core strength of the C4 model lies in its four distinct levels. Each level answers a specific set of questions for a specific audience. Moving between these levels is like adjusting the focus on a camera lens. You start wide to show the environment, then zoom in to show the internal machinery.
1. System Context Diagram 🌍
The System Context diagram is the high-level overview. It shows the software system as a single box and the people or systems that interact with it. This is the diagram you show to stakeholders who need to understand the scope of the project.
- Audience: Business stakeholders, product owners, new team members.
- Focus: Boundaries and external interactions.
- Key Elements:
- System of Interest: The main software application being discussed.
- People: Users, administrators, or specific roles interacting with the system.
- Systems: External third-party services (e.g., payment gateways, email providers) or other internal systems.
The relationships here represent data flow. For example, a user sends a request to the system, and the system sends a notification to an email provider. There is no internal detail here, only the perimeter.
2. Container Diagram 📦
Once the boundary is set, the Container diagram zooms in. It breaks the system down into the distinct units of deployment. These are often called containers, but they do not necessarily refer to Docker containers. They represent any distinct runtime environment.
- Audience: Developers, architects, DevOps engineers.
- Focus: Technology choices and high-level data flow.
- Key Elements:
- Containers: Web applications, mobile apps, databases, microservices, or batch processes.
- Relationships: Protocols used to connect containers (e.g., HTTP, gRPC, SQL).
- Technologies: The specific language or database type used within the container (e.g., Node.js, PostgreSQL).
This diagram clarifies the technology stack. It answers the question: “What parts of the system can be deployed independently?” It also helps identify where data persistence happens and how services talk to each other.
3. Component Diagram 🧩
Inside a container, complexity increases. The Component diagram reveals the major building blocks within a single container. This is where the business logic lives. It abstracts away the code but keeps the architectural structure visible.
- Audience: Core developers, feature owners.
- Focus: Internal logic and responsibilities.
- Key Elements:
- Components: Classes, modules, or packages that perform a specific function (e.g., Authentication, Order Processing, Reporting).
- Interfaces: How components interact with each other (e.g., APIs, internal methods).
- Flow: Data movement between components within the same container.
This level is crucial for onboarding new developers. It explains how a request flows through the application without requiring them to read the source code immediately.
4. Code Diagram 📝
The final level is the Code diagram. While the C4 model technically stops at Component, sometimes developers need to see the specific class structure. This is usually generated automatically or drawn for specific complex algorithms.
- Audience: Engineers implementing specific features.
- Focus: Class structure and method signatures.
- Key Elements:
- Classes: Specific implementation units.
- Methods: Functions and actions.
- Attributes: Data fields.
Use this sparingly. Static code diagrams can become outdated the moment code is refactored. They are best used for documenting complex algorithms rather than general system architecture.
📊 Comparing the C4 Levels
To visualize the differences clearly, consider the following comparison table. It highlights the distinct purpose and audience for each stage of the C4 model.
| Level | Zoom Level | Primary Audience | Key Question Answered |
|---|---|---|---|
| System Context | Macro | Stakeholders | What is the system and who uses it? |
| Container | High-Level | Developers | What technologies are used and how do they connect? |
| Component | Mid-Level | Architects & Devs | How is the logic organized inside a service? |
| Code | Micro | Engineers | What is the specific class structure? |
🚀 Real-World Architecture Scenarios
Theoretical knowledge is useful, but applying the model is where value is created. Below are three real-world scenarios demonstrating how the C4 model adapts to different needs.
Scenario 1: Migrating from Monolith to Microservices 🔄
When an organization decides to break a large application into smaller services, the risk of failure is high. The C4 model helps map the journey.
- Current State: Draw a System Context diagram of the monolith. Identify all external dependencies.
- Target State: Create a Container diagram showing the new microservices. Define which container replaces which part of the monolith.
- Integration: Document how the new containers communicate. Ensure the System Context diagram reflects the new boundary of the entire platform.
This approach prevents the “big bang” migration. You can visualize the split before writing code. It highlights communication bottlenecks early, such as a database that is still shared between two new services.
Scenario 2: Onboarding New Developers 🎓
When a new engineer joins a team, they often spend weeks reading documentation. Static documentation is hard to parse. A set of C4 diagrams provides a roadmap.
- First Week: Provide the System Context diagram. They learn who the users are and what external systems exist.
- Second Week: Provide Container diagrams. They understand the tech stack (e.g., which language runs the API).
- Third Week: Provide Component diagrams for their specific module. They understand where to write code and which interfaces to implement.
This structured learning path reduces time-to-productivity. It replaces vague verbal explanations with concrete visual references.
Scenario 3: Designing a New Feature 🛠️
Before writing code for a new feature, teams often sketch ideas. The C4 model forces discipline into this design process.
- Assess Impact: Does the feature require a new container? Or can it fit into an existing Component?
- Define Boundaries: If a new container is needed, update the Container diagram immediately. This prevents feature creep into existing services.
- Update Documentation: If a new external system is added (e.g., a new analytics provider), update the System Context diagram.
By updating the diagrams alongside the code, the documentation remains a source of truth. It prevents the “documentation rot” that plagues many software projects.
🔄 Dynamic vs. Static Diagrams
Most C4 diagrams are static. They show structure at a single point in time. However, understanding how data moves is equally important. Dynamic diagrams complement static ones.
Sequence Diagrams 🕒
These diagrams show the order of interactions between components over time. They are essential for understanding complex workflows.
- Use Case: A user clicks “Checkout”. What happens next?
- Flow: Browser sends request to API Gateway → API Gateway routes to Order Service → Order Service calls Payment Service → Payment Service responds.
- Benefit: Highlights latency points and error handling strategies.
Data Flow Diagrams 🌊
These focus on how data enters, leaves, and transforms within the system. They are useful for security audits and data governance.
- Use Case: Tracking Personally Identifiable Information (PII).
- Flow: User Data → Database → Backup System → Encryption Layer.
- Benefit: Identifies where sensitive data is stored and transmitted.
🛡️ Best Practices for Maintenance
Diagrams that are never updated become misleading. They are worse than no diagrams at all because they create false confidence. To keep C4 diagrams useful, follow these principles.
1. Diagrams as Code 📜
Store your diagrams in the same repository as your source code. This ensures version control. If the code changes, the diagram should be updated in the same commit. This creates a single source of truth.
2. Don’t Over-Document 📉
Not every component needs a diagram. If a service is simple and follows standard patterns, a Component diagram might be unnecessary. Focus on complexity. Document the parts of the system that are hard to understand or have high risk.
3. Use Consistent Notation 🎨
Ensure everyone uses the same symbols. For example, always use a cylinder for databases and a box for web applications. Consistency reduces cognitive load when reading the diagrams. Stick to standard shapes defined in the C4 specification.
4. Automate Where Possible 🤖
Some elements can be generated automatically. Code diagrams can often be derived from source code using static analysis tools. This reduces the manual effort required to keep them accurate. However, the higher-level diagrams (Context, Container, Component) usually require manual updates to reflect architectural intent.
🚫 Common Pitfalls to Avoid
Even with the best intentions, teams often stumble when applying the C4 model. Recognizing these pitfalls helps you steer clear of them.
- Too Much Detail: Including every class in a Component diagram defeats the purpose. Keep it abstract. If you need to see every class, use the Code level.
- Inconsistent Abstraction: Do not mix levels. A Container diagram should not show individual components unless they are critical. Keep the scope consistent for the level.
- Ignoring Relationships: Drawing boxes without lines is useless. Focus on the data flow between boxes. The arrows tell the story of how the system works.
- Static vs. Dynamic Confusion: Do not try to show sequence flow in a static container diagram. Use a separate Sequence diagram for that.
- Ignoring Security Boundaries: In the System Context diagram, clearly mark trust boundaries. Which external systems are trusted? Which are not? This is vital for security architecture.
🔍 Visual Language and Standards
The C4 model relies on a specific visual language to ensure clarity across teams. While you can use any diagramming tool, adhering to the C4 standards ensures universal understanding.
Shapes and Colors
- Person: Represents a human user or role.
- Software System: A rectangle with rounded corners.
- Container: A cylinder or rounded rectangle (depending on the specific container type).
- Component: A simple rectangle.
- Database: A cylinder.
- Cloud: A cloud shape for external infrastructure.
Relationship Lines
- Solid Line: Indicates a strong dependency or direct connection.
- Dashed Line: Indicates a weaker dependency or an optional interaction.
- Arrow: Indicates the direction of data flow.
- Label: Every line should have a label explaining what data is being passed (e.g., “User ID”, “Order Data”).
📈 Scaling the Model for Large Organizations
In large enterprises, a single system might have multiple context diagrams. The C4 model scales well through hierarchy.
- Platform Level: A diagram showing all the major platforms within the organization.
- Service Level: A diagram for each platform containing multiple containers.
- Feature Level: A diagram for specific feature sets within a container.
Navigation is key. Links between diagrams should be present. A Component diagram should link back to the Container diagram it belongs to. This allows a viewer to navigate from the high-level strategy down to the specific implementation logic seamlessly.
🛠️ Integrating with Development Workflows
Architecture diagrams should not exist in a silo. They must be part of the development workflow.
- Design Reviews: Make C4 diagrams a requirement for architecture review meetings. If you cannot draw it, you likely do not understand it well enough to build it.
- Pull Requests: When a PR changes the architecture, it should include a diagram update. This forces the author to think about the impact of their code.
- Incident Response: During an outage, having the System Context diagram helps identify if the issue is internal or external. Knowing which external dependencies failed saves time.
🔑 Summary of Key Takeaways
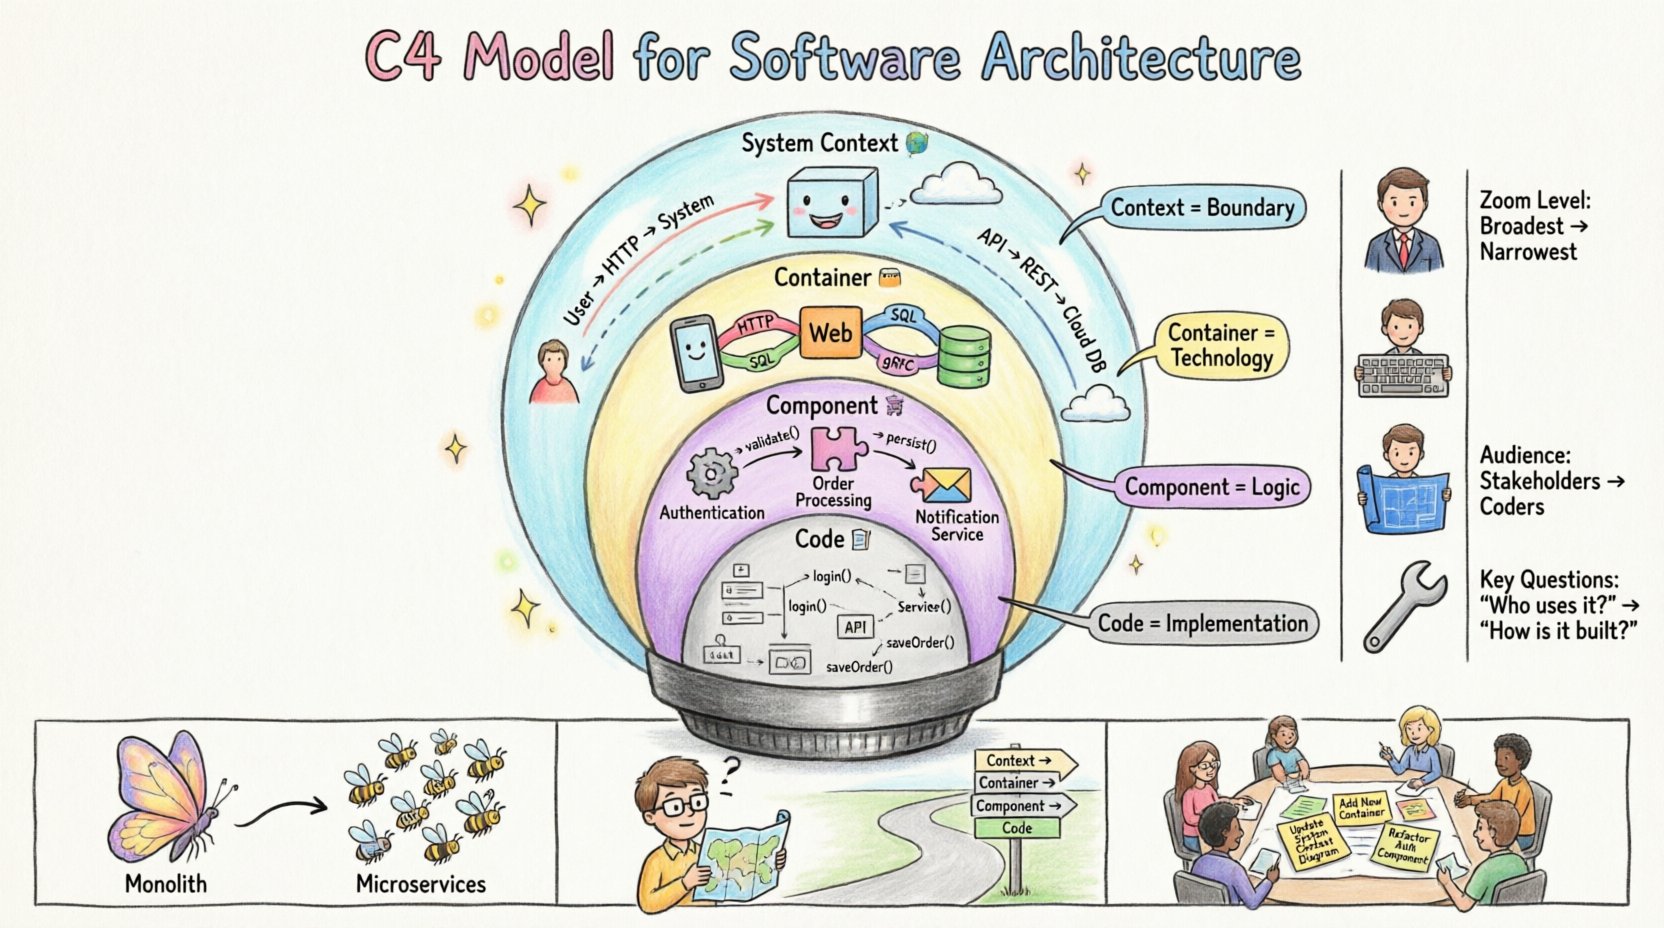
The C4 model is not just about drawing boxes. It is about communication. It forces you to think about the system at different scales. By separating the Context, Container, and Component levels, you avoid overwhelming your audience.
- Context defines the boundary.
- Container defines the technology.
- Component defines the logic.
- Code defines the implementation.
When applied correctly, these diagrams become a living library of architectural knowledge. They reduce the reliance on tribal knowledge and make complex systems transparent. Whether you are migrating a legacy system or building a new platform, the C4 model provides the structure you need to succeed.
Start small. Pick one system. Draw the Context diagram. Then zoom in. Keep it simple. Keep it accurate. And most importantly, keep it updated.

