


Software systems grow complex. As teams expand and features accumulate, understanding how the pieces fit together becomes increasingly difficult. Static text alone often fails to capture the dynamic nature of modern architecture. This is where visual documentation becomes essential. The C4 model offers a structured way to create diagrams that scale with your software, providing clarity without overwhelming detail.
Many organizations struggle with documentation that is either too high-level to be useful or too detailed to maintain. The C4 model addresses this by defining four levels of abstraction. This guide explores how to implement this approach to improve communication, reduce maintenance overhead, and ensure your documentation remains relevant as the system evolves.
What is the C4 Model? 🧩
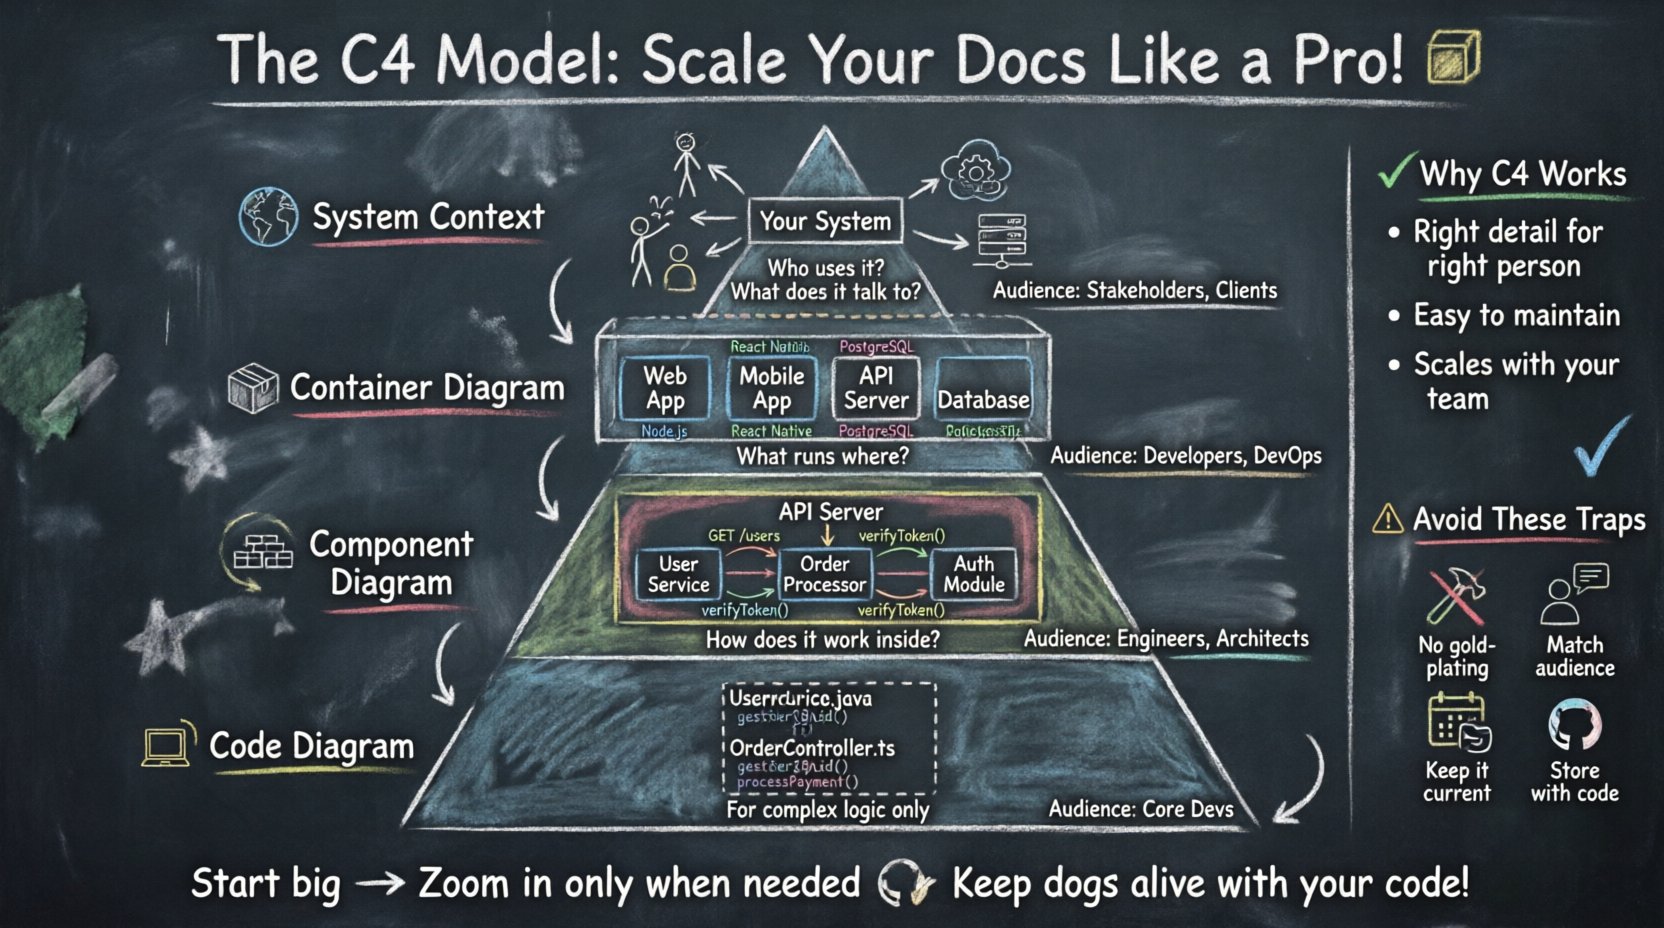
The C4 model is a hierarchical approach to software architecture documentation. It breaks down system design into four distinct layers, each serving a specific audience and purpose. The levels range from the broadest context down to the finest code-level detail.
- Level 1: System Context Diagram – Shows the system in its environment.
- Level 2: Container Diagram – Shows the runtime technologies.
- Level 3: Component Diagram – Shows the internal structure.
- Level 4: Code Diagram – Shows the code structure (optional).
This structure allows you to zoom in and out of the architecture as needed. Instead of forcing one diagram to explain everything, you provide the right view for the right person. This reduces cognitive load and ensures stakeholders find the information they need quickly.
Why Documentation Fails at Scale 📉
Before diving into the solution, it is important to understand the common pitfalls that plague technical documentation. When systems grow, documentation often becomes outdated or unusable. Here are the primary reasons this happens:
- Over-Engineering Early – Teams often create detailed code diagrams before the architecture is settled. This leads to constant updates.
- Lack of Abstraction – A single diagram trying to show everything becomes a tangled mess that no one reads.
- Static Content – Documentation written in text formats without visual hierarchy is hard to scan.
- Role Mismatch – A developer needs different information than a product manager or a client.
The C4 model solves these issues by enforcing abstraction levels. You do not show code details to a stakeholder who only needs to know how the system interacts with the outside world. You do not show a container diagram to someone who only cares about business context. Matching the detail level to the audience keeps the documentation clean and maintainable.
Level 1: System Context Diagram 🌍
The System Context Diagram is the starting point for any architectural documentation. It provides a high-level view of the system you are building and how it relates to the people and systems around it.
Key Elements
- Software System – Your application or service, represented as a single box.
- Users – People or roles interacting with the system.
- External Systems – Other applications, databases, or services that your system communicates with.
- Relationships – Lines showing data flow or interaction between elements.
When to Use It
This diagram is ideal for onboarding new team members, pitching a project to stakeholders, or explaining the system to a client. It answers the question: “What does this system do, and who uses it?”
Best Practices
- Keep the number of external systems to a minimum (usually 3 to 6).
- Use clear labels for data flows.
- Avoid showing internal logic or database tables.
- Focus on business capabilities rather than technical protocols.
Level 2: Container Diagram 📦
Once the context is established, you drill down into the system itself. The Container Diagram reveals the high-level runtime technologies. A container is a deployable unit, such as a web application, a mobile app, a microservice, or a database.
Key Elements
- Containers – Distinct runtime environments (e.g., Web App, Mobile App, Serverless Function).
- Technologies – The type of technology used (e.g., Java, Node.js, PostgreSQL), without naming specific vendor products.
- Connections – How containers communicate (e.g., HTTP, TCP, Message Queue).
When to Use It
This level is crucial for developers who need to understand the deployment architecture. It helps identify where code lives and how services talk to each other. It is also useful for DevOps teams planning infrastructure.
Best Practices
- Group related containers logically.
- Indicate data flow direction clearly.
- Use consistent shapes for containers to imply their type.
- Do not include internal components yet.
Comparison of Levels 1 and 2
| Feature | Level 1: Context | Level 2: Containers |
|---|---|---|
| Focus | Business Context | Technical Runtime |
| Audience | Stakeholders, Clients | Developers, Architects |
| Detail | System as a Black Box | System as a Collection of Apps |
Level 3: Component Diagram 🧱
Inside a container, there is often a complex structure of code. The Component Diagram zooms in on a specific container to show its internal structure. A component is a logical grouping of functionality, such as a service, a module, or a library.
Key Elements
- Components – Logical parts of the container (e.g., User Service, Order Processor).
- Interfaces – How components expose functionality to others.
- Dependencies – How components rely on one another.
When to Use It
This is the most detailed diagram for most teams. It is used for design discussions, code planning, and explaining how specific features are implemented. It bridges the gap between high-level architecture and actual code.
Best Practices
- Keep components to a manageable number (usually under 10).
- Focus on behavior and data, not code classes.
- Use standard notation for interfaces (e.g., provided and required).
- Ensure the diagram reflects the current codebase.
Level 4: Code Diagram 💻
Level 4 is optional and generally reserved for complex algorithms or specific libraries. It maps components to actual code structures like classes, functions, or database tables.
When to Use It
Most applications do not need a code-level diagram. It is too detailed and changes too frequently. Use this only when you need to explain a specific algorithm, a complex data model, or a specific integration logic.
Best Practices
- Do not use this as a primary documentation source.
- Ensure it stays synchronized with the code.
- Consider using automated tools to generate this if possible.
- Limit usage to critical path logic.
Implementing C4 in Your Workflow 🛠️
Adopting the C4 model requires a shift in how you approach documentation. It is not just about drawing boxes; it is about managing information hierarchy. Here is a practical approach to implementation.
1. Start with Context
Begin every new project by creating the System Context Diagram. This sets the boundaries and defines the scope. If you cannot draw this, the scope is likely too vague.
2. Iterate Upwards
As the project grows, add Container and Component diagrams. Do not create all levels at once. Create them as needed for specific features or modules.
3. Maintenance Strategy
Documentation dies when it is not updated. Integrate diagram updates into your development workflow.
- Update diagrams during code reviews.
- Link diagrams to pull requests.
- Assign ownership for specific diagrams to team leads.
4. Tooling Choices
Choose diagramming tools that support text-based definition (like code) rather than just drag-and-drop. This allows version control and easier updates. Ensure the tool supports exporting to standard formats like PNG or SVG for documentation sites.
Common Pitfalls and How to Avoid Them ⚠️
Even with a structured model, teams can make mistakes. Awareness of these pitfalls helps maintain a healthy documentation ecosystem.
Pitfall 1: The “Gold Plating” Diagram
Creating diagrams that look perfect but do not reflect reality. A beautiful diagram is useless if it is wrong.
- Solution: Treat diagrams as code. Review them regularly.
Pitfall 2: Ignoring the Audience
Showing a Component Diagram to a client. They do not need to see your microservices.
- Solution: Create a “View” for each audience. Use the C4 levels to filter information.
Pitfall 3: Over-Abstraction
Creating diagrams that are too vague to be useful. If a box says “System,” it tells the developer nothing.
- Solution: Ensure labels describe function, not just identity.
Pitfall 4: Static Storage
Keeping diagrams in a folder with no link to the code.
- Solution: Store diagrams alongside the code or in the project repository.
Measuring Success 📊
How do you know if your documentation strategy is working? Look for these indicators.
- Onboarding Time – Does it take less time for new developers to understand the system?
- Question Reduction – Are fewer questions asked about system flow during meetings?
- Update Frequency – Are diagrams updated regularly, or are they ignored?
- Clarity – Do stakeholders understand the architecture without needing a verbal explanation?
Final Thoughts on Architecture Communication 💬
Documentation is not a deliverable; it is a communication tool. The C4 model provides a framework to make that communication effective. By organizing information into logical layers, you reduce noise and highlight signal. This approach scales with your team and your system.
Start with the big picture. Define the context. Then, drill down only where necessary. This discipline prevents documentation bloat and ensures that every diagram serves a purpose. As your software evolves, your documentation should evolve with it, maintaining a clear view of the system at every level.
Investing in structured documentation pays dividends in reduced technical debt and better team alignment. It is a foundational practice for any engineering organization aiming for long-term stability and growth.

