


Software architecture is fundamentally about communication. It is the bridge between business requirements and technical implementation. However, when systems grow in complexity, communication often breaks down. This is where a standardized visualization model becomes essential. The C4 model offers a structured approach to documenting software architecture at different levels of detail. It helps teams create diagrams that are meaningful, maintainable, and focused on the right audience.
This guide explores the C4 model in depth. We will examine each of its four layers, discuss how they interact, and provide practical strategies for implementation. The goal is to equip you with a clear methodology for documenting systems without getting lost in unnecessary technical details or overwhelming stakeholders.
🌍 What is the C4 Model?
The C4 model is a hierarchy of diagrams designed to describe the architecture of software systems. It was created to address the confusion often found in traditional modeling methods like UML. Instead of trying to capture every detail in one massive diagram, C4 encourages breaking down the system into manageable chunks. Each chunk represents a different level of abstraction.
The model consists of four distinct levels:
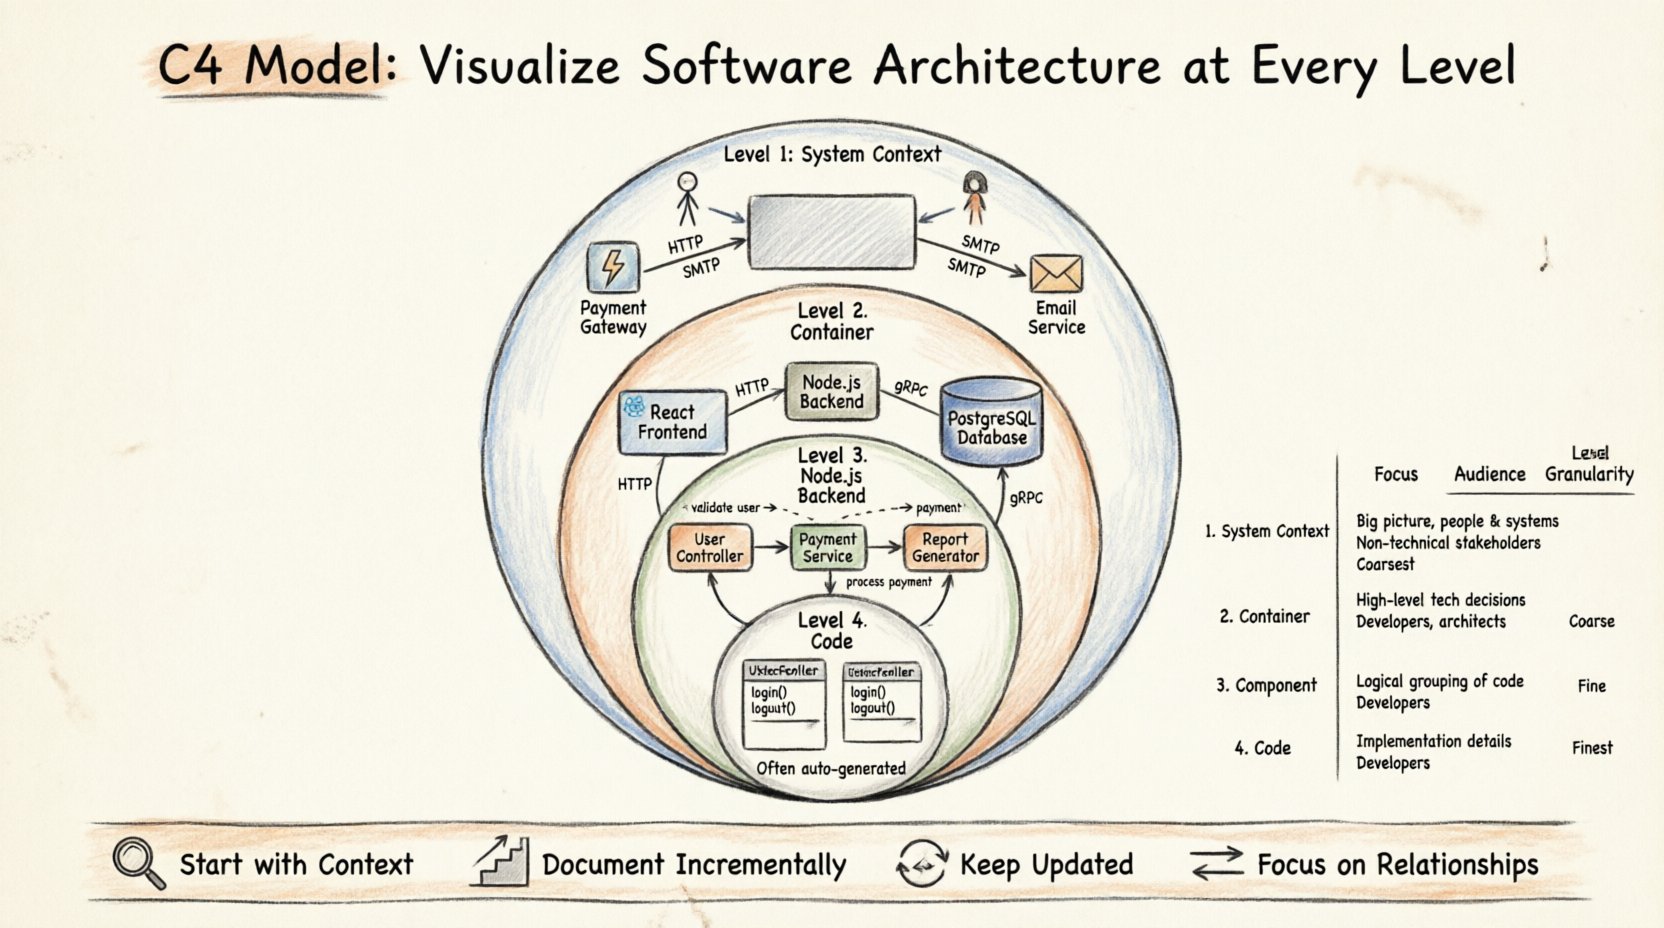
- Level 1: System Context
- Level 2: Container
- Level 3: Component
- Level 4: Code
These levels are not isolated. They nest within one another. A high-level view zooms out to show relationships, while a low-level view zooms in to show internal logic. This structure allows architects to tailor the information based on who is reading the diagram. Executives might only need Level 1, while developers working on specific modules might need Level 3.
🔍 Level 1: System Context Diagram
The System Context diagram provides the highest level of abstraction. It answers the question: Who uses this system, and what other systems does it talk to? This diagram is crucial for understanding the boundaries of the software within the broader ecosystem.
👥 Key Elements
- Software System: Represented as a single box. This is the product or service you are building.
- Users: Represented as stick figures or icons. Identify the primary actors (e.g., Admin, Customer, Third-Party Vendor).
- External Systems: Represented as boxes. These are other applications or services that interact with your system (e.g., Payment Gateway, Email Service, Legacy Database).
- Connections: Lines showing how data flows between the system, users, and external systems.
📝 Best Practices
- Keep it Simple: Do not include internal details. Focus on the perimeter.
- Label Relationships: Clearly state what data is passed. Use labels on the connection lines.
- Focus on People: Ensure human users are distinct from external automated systems.
- One Diagram: Ideally, a project should have only one System Context diagram.
This diagram is often the first thing stakeholders review. It sets the scope. If a feature request falls outside the boundaries defined here, it requires a re-evaluation of the system scope.
⚙️ Level 2: Container Diagram
Once the boundaries are set, we need to understand the building blocks inside. The Container diagram breaks the software system down into its runtime containers. A container is a deployable unit of software. It could be a web application, a mobile app, a microservice, a database, or a file store.
🏗️ Key Elements
- Containers: Boxes representing the technology used. Examples include a React frontend, a Node.js backend, a PostgreSQL database, or a Kubernetes cluster.
- Technologies: Label the container with the specific technology stack (e.g., Java, .NET, Python).
- Connections: Show how containers communicate. This could be HTTP requests, gRPC calls, or direct database queries.
- Users: Reuse the users from the System Context diagram to show who interacts with which container directly.
📝 Best Practices
- Group by Technology: If you have multiple microservices, group them logically. Do not draw every single instance of a service unless necessary.
- Highlight Boundaries: Make sure the container boundary is clear. This defines the deployment unit.
- External Connections: Continue to show connections to external systems from Level 1.
- Scale Appropriately: If the system is small, Level 2 might be the only diagram needed beyond Level 1.
This level is vital for DevOps and infrastructure teams. It tells you what technologies are involved and how they are connected. It helps in planning deployment strategies and security boundaries.
🧩 Level 3: Component Diagram
Inside a container, there is logic. The Component diagram zooms into a single container to show its internal structure. It breaks the container down into logical components. A component is a cohesive unit of functionality within a container. It is a logical concept, not necessarily a physical file.
🛠️ Key Elements
- Components: Boxes inside the container. Examples include a User Controller, a Payment Service, or a Report Generator.
- Responsibilities: Each component should have a clear purpose. Avoid components that do too much.
- Interfaces: Show how components interact. This includes APIs, message queues, or internal function calls.
- External Systems: If a component talks directly to an external system, show that connection.
📝 Best Practices
- Logical Grouping: Group components by feature or domain. Avoid grouping by file name.
- Limit Complexity: If a container has too many components, consider splitting the container. A component diagram should not be overwhelming.
- Focus on Data Flow: Show the direction of data flow between components.
- One Diagram Per Container: Typically, you create a component diagram for each significant container.
This level is primarily for developers. It helps new team members understand how the code is organized. It aids in identifying dependencies and potential bottlenecks within a specific service.
💻 Level 4: Code Diagram
The final level is the Code diagram. This is the most detailed view. It maps directly to the source code. It shows classes, interfaces, and methods. In practice, this level is often skipped or generated automatically. It is rarely hand-drawn because code changes frequently, and maintaining a diagram at this level is costly.
📂 Key Elements
- Classes: The fundamental building blocks of the code.
- Methods: The functions that perform actions.
- Attributes: Data properties within classes.
- Dependencies: Relationships between classes.
📝 Best Practices
- Automate When Possible: Use tools to generate this from code if needed.
- Use Sparingly: Only create this for complex algorithms or specific legacy modules.
- Link to Code: Ensure the diagram links back to the actual repository for verification.
Most modern architecture documentation stops at Level 3. Level 4 is useful for debugging specific logic issues but is generally too volatile for high-level architecture planning.
📊 Comparing the Levels
Understanding the differences between levels is key to effective documentation. The table below summarizes the scope and audience for each layer.
| Level | Focus | Audience | Granularity |
|---|---|---|---|
| System Context | Entire system boundaries | Stakeholders, Managers | High |
| Container | Deployable units | Architects, DevOps | Medium |
| Component | Logical modules | Developers | Low |
| Code | Classes and methods | Senior Developers | Very Low |
🛠️ Implementation Strategy
Adopting the C4 model requires a shift in mindset. It is not just about drawing boxes; it is about organizing thoughts. Here is a practical approach to implementing this model in your organization.
1. Start with the Context
Begin every project with the System Context diagram. If you cannot define the boundaries and users, you do not understand the project. Get stakeholder sign-off on this first. It prevents scope creep later.
2. Document Incrementally
Do not try to document the whole system at once. Start with the core container. As the system grows, add more containers. Update diagrams during the design phase of new features.
3. Keep Diagrams Up to Date
A diagram that is out of date is worse than no diagram. It creates false confidence. Establish a rule: if the code changes significantly, the diagram must change. This makes documentation part of the development workflow.
4. Focus on Relationships
The boxes are less important than the lines connecting them. Focus on the data flow and dependencies. A clear relationship is more valuable than a perfectly drawn box.
⚠️ Common Pitfalls
Even with a structured model, teams often make mistakes. Being aware of these common errors can save time and effort.
❌ Over-Engineering
Do not create a diagram for every single class. If a diagram becomes too complex to read, it has failed. Simplify the view. Use stereotypes or grouping to reduce visual noise.
❌ Mixing Levels
Do not put code-level details in a Container diagram. Keep the abstraction levels separate. Mixing them confuses the audience and defeats the purpose of the hierarchy.
❌ Ignoring External Systems
Often, teams focus only on what they control. However, dependencies on third-party services are critical for understanding risk. Always document external connections.
❌ Static Documentation
Avoid creating diagrams that sit in a wiki and are never touched. Integrate diagramming into your CI/CD pipeline or documentation generation process. Automation helps keep things current.
🔄 Maintenance and Evolution
Software architecture is not static. It evolves with the business. As features are added, the system context might shift. New containers might be introduced. The C4 model supports this evolution because of its hierarchical nature.
When a major change occurs, review the diagrams. Ask yourself:
- Do the boundaries still make sense?
- Are the connections accurate?
- Is the technology stack still valid?
Regular reviews ensure that the documentation remains a source of truth. This practice builds trust between the architecture team and the development team.
🎯 Why This Matters
Effective architecture documentation reduces cognitive load. It allows new hires to onboard faster. It helps architects make better decisions about technology choices. It reduces the risk of technical debt accumulating in the dark.
By using a standardized model, teams speak the same language. When an architect says, “Update the Container diagram,” everyone knows exactly what level of detail is expected. This consistency is the backbone of scalable engineering organizations.
🚀 Conclusion
The C4 model provides a clear, structured way to visualize software architecture. It moves away from rigid, overly complex diagrams toward practical, audience-focused documentation. By understanding the four levels—Context, Container, Component, and Code—you can create diagrams that truly add value.
Start small. Focus on the System Context. Expand as the system grows. Keep the diagrams aligned with the code. This approach ensures your architecture documentation remains a living asset rather than a static burden.
Remember, the goal is clarity. If your diagram helps someone understand the system faster, it has succeeded.

