


Software architecture is often invisible until it breaks. When a team struggles to understand how a system works, the result is technical debt, slow deployment, and frustration. The problem usually lies not in the code itself, but in how that code is visualized and communicated. Diagrams that are too detailed confuse stakeholders, while those that are too abstract fail developers. This gap creates a divide between intent and implementation.
The C4 Model offers a structured approach to solving this communication challenge. It provides a hierarchy of diagrams that scale from high-level context down to code-level details. By adopting this framework, teams can document their systems without getting bogged down in unnecessary complexity. This guide explores how to implement the C4 Model to bring order to architectural chaos.
Why Traditional Diagramming Fails Teams 🛑
Before adopting a new standard, it is necessary to understand why existing methods often fall short. In many organizations, architecture documentation suffers from two primary issues: over-detailing and under-documentation.
- Over-detailing: Architects often draw diagrams that look like code. These include every class, method, and interface. While technically accurate, they are overwhelming for anyone trying to understand the system’s purpose. Stakeholders lose interest quickly.
- Under-documentation: Conversely, some teams provide only a single box labeled “System A.” This lacks the necessary context to explain dependencies, data flow, or external interactions. Developers are left guessing.
- Stale Information: When diagrams are hard to maintain, they become outdated immediately after creation. If updating a diagram requires a complex tool or significant effort, teams stop updating them.
The C4 Model addresses these issues by enforcing a mental model of abstraction. It dictates what belongs in each view, ensuring the right information reaches the right audience at the right time.
What is the C4 Model? 📊
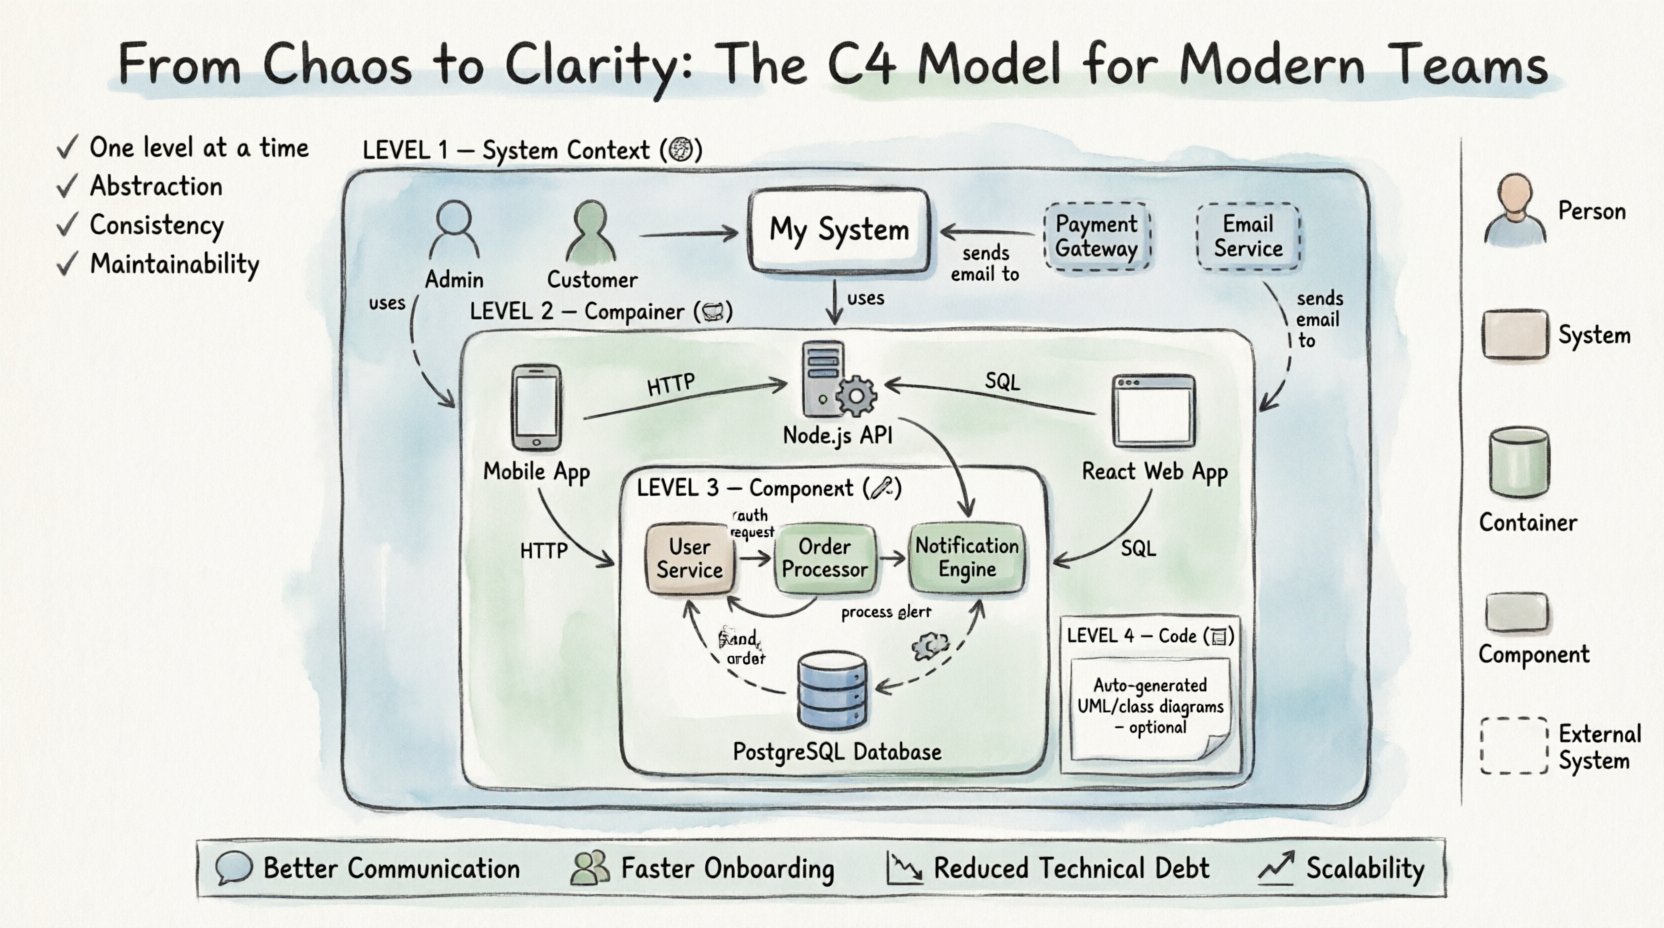
The C4 Model stands for Context, Container, Component, and Code. It was developed to standardize how software architecture is represented visually. The core philosophy is simplicity and scalability. It encourages documenting the system at four distinct levels of granularity.
Each level serves a specific purpose and targets a specific audience. This separation of concerns ensures that a diagram remains readable regardless of its complexity. The model is not a rigid set of rules but a framework for thinking about structure.
Key principles include:
- One level at a time: Do not mix levels in a single diagram.
- Abstraction: Simplify details that are not relevant to the current view.
- Consistency: Use standard shapes and labels across all diagrams.
- Maintainability: Keep diagrams close to the code or the team responsible for them.
Level 1: System Context Diagram 🌍
The first level defines the boundaries of the system being built. It answers the question: “What is this system, and who uses it?” This diagram is typically the starting point for any project.
A Level 1 diagram includes:
- The System Being Built: Represented as a single box in the center.
- People: Users or roles interacting with the system (e.g., Administrator, Customer).
- Other Systems: External services or applications that communicate with the main system (e.g., Payment Gateway, Email Service).
- Relationships: Lines connecting the system to people and other systems, labeled with the nature of the interaction (e.g., “Authenticates,” “Stores Data”).
This view is crucial for product managers and business stakeholders. It provides a clear scope of the project without diving into technical implementation details. It clarifies boundaries and prevents scope creep by explicitly showing what is inside and outside the system.
Level 2: Container Diagram 📦
Once the context is established, the second level breaks the system down into its major building blocks. Containers are high-level structures that hold code and data. Examples include web applications, mobile apps, databases, and microservices.
A Level 2 diagram includes:
- Containers: Distinct technologies used to run the application (e.g., React Single Page App, Node.js API, PostgreSQL Database).
- Technologies: Specify the language or platform (e.g., Java, Python, .NET).
- Connections: How containers communicate with each other (e.g., HTTP, gRPC, SQL).
- People and External Systems: These remain visible to show how the containers fit into the wider context.
This level is often the most useful for developers and system architects. It provides a roadmap of the infrastructure. It helps teams understand deployment boundaries and data ownership. When designing a new feature, a developer can look at this diagram to see which container they should modify.
Level 3: Component Diagram 🔧
Containers are too broad for understanding specific functionality. The third level zooms in to show the components within a single container. Components represent logical units of code that perform a specific task.
A Level 3 diagram includes:
- Components: Subsystems or modules within a container (e.g., User Service, Order Processor, Notification Engine).
- Interfaces: Methods or APIs that components expose to each other.
- Relationships: How components interact, including data flow and control flow.
- Container Context: The container is shown as a boundary box containing the components.
This diagram is essential for team members working on specific parts of the application. It clarifies responsibilities and reduces coupling. If a team needs to refactor a module, this view shows the dependencies that must be respected. It bridges the gap between high-level architecture and low-level code.
Level 4: Code Diagram 📝
The fourth level represents actual code. While the C4 Model technically includes this level, it is rarely used in practice. Code diagrams are typically generated automatically from the source code by tools.
When is this level necessary?
- Complex algorithms that need visual explanation.
- Legacy code where documentation is missing.
- Onboarding new developers to a specific module.
Because code changes frequently, maintaining manual code diagrams is difficult. Most teams rely on automatic generation or skip this level entirely unless there is a specific need.
Visual Conventions and Standards 🎨
Consistency is the backbone of the C4 Model. Without agreed-upon visual standards, diagrams become a personal preference exercise rather than a communication tool. The model suggests specific shapes and icons to reduce cognitive load.
| Element | Shape | Example |
|---|---|---|
| System Being Built | Box | My Application |
| Person | Stick Figure | Admin User |
| Container | Cylinder or Box | Database, Web App |
| Component | Box | Service, Module |
| External System | Box (Dashed) | 3rd Party API |
Using these conventions allows anyone to read a diagram immediately. There is no need to look up a legend every time. The color of the shape is less important than the shape itself, though color can be used to group related components.
Implementing the Model in Your Workflow 🚀
Adopting a new documentation standard requires a shift in mindset. It is not just about drawing better pictures; it is about changing how the team thinks about the system. Here is a step-by-step approach to implementation.
Step 1: Start with the Context
Before writing a single line of code or drawing a diagram, define the scope. Gather the product owner, architect, and lead developers. Create the Level 1 diagram together. Ensure everyone agrees on who the users are and what external systems are involved. If the context is wrong, the rest of the documentation will be misaligned.
Step 2: Define the Boundaries
Move to Level 2. Identify the containers. This is often where architectural decisions are made. Decide which parts of the system will be separate services and which will be monolithic. Document the technology stack for each container. This step defines the deployment strategy.
Step 3: Iterate with Code
As development begins, create Level 3 diagrams for the most complex containers. Do not attempt to diagram every single module. Focus on areas where logic is intricate or where multiple teams interact. Update these diagrams only when the architecture changes significantly.
Step 4: Integrate with Version Control
Keep the diagrams close to the code. Store them in the same repository as the source files. This ensures that documentation travels with the project. It prevents documentation from becoming a separate, disconnected entity.
Step 5: Establish Review Processes
Include diagram reviews in the pull request process. If a new feature changes the architecture, a new diagram must be updated. This prevents the documentation from drifting away from reality. Peer review of diagrams is just as important as code review.
Common Pitfalls to Avoid 🚧
Even with a clear model, teams often make mistakes that undermine the effort. Being aware of these traps helps maintain the quality of documentation over time.
- Diagrams for the sake of diagrams: Creating a diagram just to say you have one adds no value. Only draw when it aids understanding or communication.
- Mixing Levels: Putting components inside a system context diagram is confusing. Stick to the hierarchy. If you need more detail, create a new diagram, not a bigger one.
- Over-engineering: Trying to map every single function in the code to a component creates noise. Keep components at a logical level, not a function level.
- Ignoring Updates: If the code changes and the diagram does not, the diagram becomes a lie. Treat diagrams as living documents.
- Tool Dependency: Do not rely solely on a specific tool for maintenance. Ensure the diagrams can be exported or read even if the tool is replaced later.
Benefits of the C4 Model ✅
Why invest time in this framework? The benefits extend beyond just pretty pictures. The C4 Model improves the overall health of the engineering organization.
Better Communication
Developers, product managers, and stakeholders speak different languages. The C4 Model provides a common vocabulary. A “Container” means the same thing to a backend engineer as it does to a project manager. This reduces misunderstandings during planning and execution.
Faster Onboarding
New hires often struggle to understand a complex codebase. High-quality architecture diagrams provide a map. They allow new developers to navigate the system without reading thousands of lines of code. This reduces the time to first contribution.
Reduced Technical Debt
When architecture is clear, it is easier to spot bad design decisions. Teams can identify tight coupling or unclear boundaries early. This proactive approach prevents the accumulation of structural issues that become expensive to fix later.
Scalability
As the system grows, the documentation scales with it. The model allows you to add more containers or components without breaking the existing structure. You can add a Level 3 diagram for a new service without redrawing the entire system.
Maintaining Documentation Over Time 🔁
Documentation decay is a real threat. The only way to combat this is to make updating the diagrams as easy as possible. The goal is to minimize the friction between writing code and writing documentation.
- Automate where possible: Use tools that generate diagrams from code annotations if available. This reduces manual entry.
- Assign Ownership: Designate a person or team responsible for keeping the architecture diagrams up to date. This is often the lead architect or a senior engineer.
- Link to Code: Reference specific code modules or repositories in the diagram descriptions. This makes it easy to find the source of truth.
- Regular Audits: Schedule a review every few months to check if the diagrams match the current state of the system.
Conclusion
Architecture documentation is not a luxury; it is a necessity for sustainable software development. The C4 Model provides a proven framework to make this documentation effective, readable, and maintainable. By separating concerns and focusing on clarity, teams can navigate complexity with confidence.
Start small. Create a Level 1 diagram for your current project. Share it with your team. Gather feedback. Iterate. Over time, this habit will transform how the team communicates and builds software. The goal is not perfect diagrams, but clear understanding.

