


In the landscape of complex software architecture, clarity is the most valuable currency. When systems grow in scale, the interactions between components become difficult to track using text alone. This is where interactive sequence diagrams become essential. Unlike static documentation, these diagrams allow stakeholders to trace the flow of data and control across a system dynamically. This guide explores the methodology for constructing these visual artifacts to ensure precise communication and reduced ambiguity during development.
🧱 The Foundation of System Interaction
Before diving into the creation process, it is vital to understand what we are modeling. A sequence diagram is a type of interaction diagram in Unified Modeling Language (UML). It shows how objects interact with each other in the order that time passes. The primary goal is to visualize the logic of a specific use case or scenario.
- Actors: These represent external entities, such as users, other systems, or hardware devices initiating the process.
- Objects: These are instances of classes within the system that participate in the interaction.
- Lifelines: Vertical dashed lines that represent the existence of an object or actor over time.
- Messages: Horizontal arrows indicating a call, return, or signal sent between objects.
- Activation Bars: Rectangular boxes on lifelines showing when an object is actively performing an operation.
Moving from a static representation to an interactive one changes the way teams consume information. Static diagrams are snapshots. Interactive diagrams are stories. They allow the reader to pause, inspect specific steps, and understand the conditional logic embedded within the flow.
🔄 Defining Interactivity in Diagrams
When we speak of interactive sequence diagrams, we are not necessarily referring to software that animates the drawing. Instead, we refer to the structure and annotation strategy that invites active reading. An interactive diagram requires the viewer to mentally simulate the execution path, often supported by detailed notes, decision points, and loops.
Here is how interactivity is achieved without animation:
- Conditional Logic: Clearly marking alt and opt fragments where paths diverge based on boolean conditions.
- Loop Fragments: Explicitly showing iterations where a process repeats until a condition is met.
- Grouping: Using combined fragments to encapsulate complex behaviors into manageable blocks.
- Annotations: Adding textual notes that explain why a message is sent, not just what is sent.
- Traceability: Linking diagram steps to specific requirements or user stories to validate coverage.
This approach transforms the diagram from a passive illustration into a working specification. It demands that the creator think through edge cases, not just the happy path.
🎯 Preparing Your Scope and Actors
Creating a diagram without a defined scope leads to clutter and confusion. The first step in any sequence diagram project is establishing boundaries. You must determine what the diagram will cover and what it will exclude.
Identifying Participants
Start by listing every entity that plays a role in the specific scenario. Avoid listing every single class in your system. Focus only on those involved in the interaction flow. Too many actors dilute the focus.
- External Users: Human actors initiating the request.
- Service Entrypoints: Controllers, APIs, or gateways receiving the initial call.
- Business Logic: Services or managers handling the core processing.
- Data Stores: Databases or caches retrieving or persisting information.
- External Systems: Third-party payment gateways, email services, or legacy APIs.
Defining the Context
Every interaction has a starting point and an ending point. Clearly define the preconditions. What state must the system be in before the interaction begins? Define the postconditions. What is the outcome if the interaction completes successfully? What happens if it fails?
This preparation phase ensures that the subsequent diagram remains focused and readable. It prevents the common pitfall of trying to model the entire application in a single view.
📝 Designing the Message Flow
Once the participants are identified, the chronological ordering of messages is the next critical task. Time flows from top to bottom. The sequence of arrows dictates the order of operations.
Structuring the Call Chain
Begin with the actor or external trigger sending the first request. This is typically a synchronous call. Follow this with the internal processing steps. Ensure that every message has a corresponding return message unless it is a fire-and-forget signal.
- Synchronous Calls: The caller waits for the response before proceeding.
- Asynchronous Calls: The caller sends the message and continues without waiting.
- Return Messages: Represented by dashed lines, indicating data or status being passed back.
Handling Complexity with Fragments
Real-world logic is rarely linear. You will encounter loops, conditions, and optional behaviors. UML provides combined fragments to manage this.
| Fragment Type | Notation | Use Case |
|---|---|---|
| alt | Rectangle with “alt” in top-left | Conditional logic (if/else). |
| opt | Rectangle with “opt” in top-left | Optional behavior. |
| loop | Rectangle with “loop” in top-left | Iterative processing. |
| break | Rectangle with “break” in top-left | Termination of a loop. |
| par | Rectangle with “par” in top-left | Parallel execution paths. |
Using these fragments correctly prevents the diagram from becoming a tangled web of arrows. It segments the logic into digestible chunks.
🔍 Annotating for Context
A diagram without context is merely a sketch. Annotations add the semantic weight required for developers and architects to understand the intent behind the messages. These notes should explain the business rules, data transformations, or error handling strategies.
Types of Annotations
- Preconditions: Notes attached to the start of the lifeline indicating required states.
- Constraints: Mathematical or logical constraints (e.g., “ID must be unique”).
- Exceptions: Specific notes detailing how errors are propagated up the chain.
- Side Effects: Notes indicating actions that occur without explicit messages (e.g., logging).
When adding annotations, keep them concise. Long paragraphs of text break the visual flow. Use a standardized comment box format, often represented as a folded rectangle attached to a lifeline or message.
🔄 Review and Validation Loops
Creating the diagram is only half the battle. The true value comes from the review process. An interactive diagram should be validated against the actual requirements and codebase.
Stakeholder Walkthroughs
Conduct sessions where business analysts and developers walk through the diagram together. This is not about correcting spelling; it is about verifying logic. Ask questions such as:
- Is every required step represented?
- Are the data types consistent across the messages?
- Does the return value match the expectation of the caller?
- Are the error paths covered in the alt fragments?
Code Alignment
The diagram should eventually reflect the implementation. If the code changes, the diagram must change. Maintaining this alignment is crucial. If the diagram drifts too far from reality, it becomes documentation debt. Regular synchronization with the development sprint ensures that the visual artifact remains a source of truth.
❌ Common Notation Errors
Even experienced architects make mistakes. Being aware of common pitfalls helps maintain high quality.
- Mixing Levels of Abstraction: Do not mix high-level service calls with low-level database queries in the same view. Keep the granularity consistent.
- Circular Dependencies: Avoid showing A calling B and B immediately calling A without a clear return. This often indicates a design flaw.
- Overcrowded Lifelines: If a lifeline has too many messages, consider splitting it into a sub-diagram or a separate sequence view.
- Missing Returns: Every synchronous message should ideally have a return path, even if it is null or void.
- Unclear Actors: Ensure external actors are clearly distinguished from internal objects.
⚙️ Integrating with Development Workflows
To make sequence diagrams truly effective, they must be integrated into the daily workflow. They should not exist in a siloed documentation folder.
Version Control
Store diagram definitions in version control alongside the source code. This allows for tracking changes over time. When a feature is modified, the corresponding diagram file should be updated in the same commit.
Requirement Linking
Link each sequence diagram to the specific user story or requirement ticket it satisfies. This creates a traceability matrix. During testing, if a requirement fails, the engineer can jump to the diagram to see the expected interaction flow.
Collaborative Editing
Enable multiple experts to contribute to the design phase. While only one person may draw the final lines, the input should be collective. This ensures that the diagram reflects the consensus of the team rather than a single perspective.
📊 Measuring the Impact
How do you know if creating these diagrams is worth the effort? Look for qualitative and quantitative improvements in the development process.
- Reduced Ambiguity: Fewer questions during the implementation phase.
- Faster Onboarding: New team members understand the system flow faster with clear diagrams.
- Defect Reduction: Logic errors are caught during the diagram review before code is written.
- Improved Communication: Business stakeholders can validate flows without needing to read code.
Tracking the number of bugs related to integration errors before and after adopting detailed sequence modeling can provide concrete data on effectiveness.
🛡️ Security Considerations in Diagrams
When modeling interactions, security is often overlooked. However, sequence diagrams are an excellent place to model authentication and authorization flows.
- Authentication Tokens: Show where tokens are generated and passed.
- Permission Checks: Include messages that verify user roles before data access.
- Encryption: Note where data is encrypted in transit between services.
By visualizing security boundaries, teams can identify potential vulnerabilities early in the design phase.
🌐 Scalability and Maintenance
As the system grows, the diagrams will grow. Maintaining them requires discipline. A large monolithic diagram is hard to read. Break the system down into bounded contexts.
- Modularization: Create a diagram for each major module or service.
- Reference Diagrams: Use high-level diagrams to reference low-level details.
- Archiving: Keep versions of diagrams for legacy features to assist in debugging old code.
This modular approach ensures that the documentation remains navigable as the complexity of the architecture increases.
💡 Tips for Effective Visual Design
While the content is king, the presentation matters. A cluttered diagram is ignored.
- Consistent Spacing: Keep the vertical distance between messages uniform.
- Clear Labeling: Use descriptive names for messages and objects.
- Color Coding: If the tool allows, use colors to distinguish between different types of flows (e.g., data, control, error).
- Minimal Text: Let the arrows speak. Use text only for critical context.
These visual principles reduce cognitive load, allowing the reader to focus on the logic rather than the layout.
🚀 Conclusion on Best Practices
Building interactive sequence diagrams is a disciplined practice that pays dividends in system quality. It requires upfront effort but saves significant time during development and maintenance. By focusing on scope, clarity, and validation, teams can ensure that their visual models serve as reliable blueprints for complex interactions.
The key is consistency. Treat the diagrams as living documents that evolve with the code. This commitment transforms them from static pictures into dynamic tools for understanding.
📋 Summary Checklist for Creation
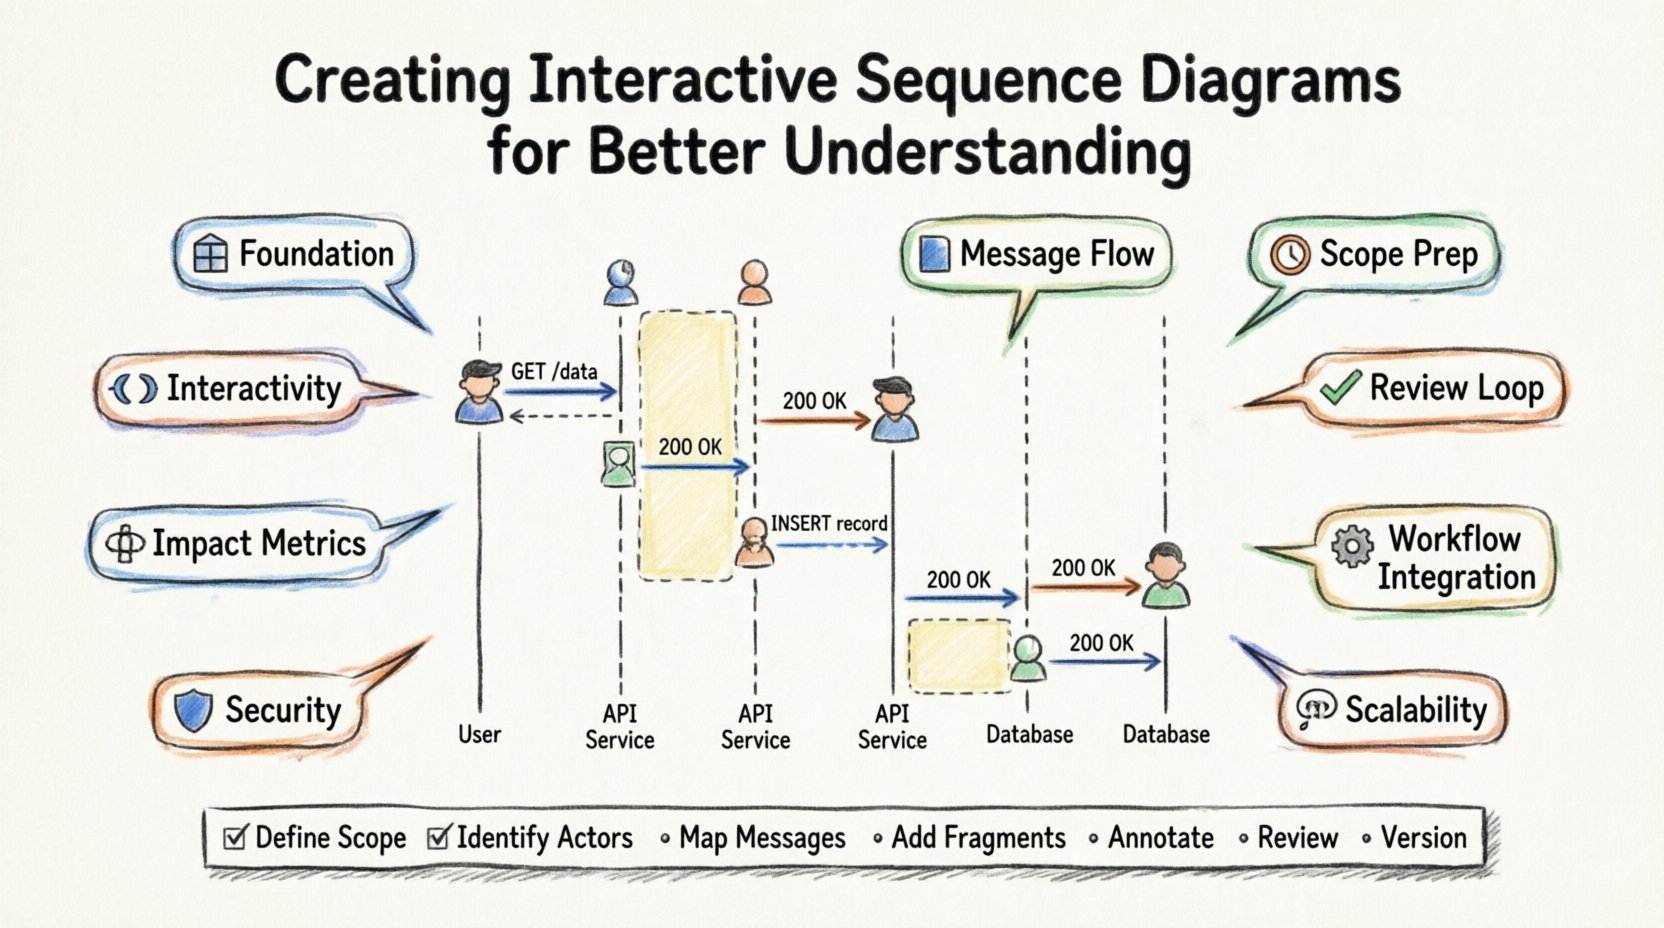
- Define Scope: What is the specific scenario?
- Identify Actors: Who is involved?
- Map Messages: What is the sequence of calls?
- Add Fragments: Are loops and conditions handled?
- Annotate: Is the context clear?
- Review: Has the logic been validated?
- Version: Is the diagram tracked in source control?
Following this checklist ensures that every diagram produced meets the standard of clarity and utility required for modern software engineering.

