


In the complex landscape of software engineering, communication remains the single most critical factor for success. While code defines what a system does, diagrams define how the system behaves over time. Among the various tools available for this purpose, the sequence diagram stands out as a primary method for visualizing dynamic interactions. This guide explores the journey of sequence diagrams from their initial conceptualization to their current state and potential future trajectory. We examine the changes in notation, creation methods, and integration within development lifecycles without focusing on specific commercial products.
Understanding the Sequence Diagram 🧩
Before delving into history, it is essential to define the core subject. A sequence diagram is a type of interaction diagram that shows how objects operate one another in terms of a sequence of messages. Time flows vertically downwards, with the top representing the earliest point in time and the bottom representing the latest.
- Lifelines: Vertical dashed lines representing individual participants or objects.
- Messages: Arrows indicating the flow of information between objects.
- Activation Bars: Rectangles on lifelines showing when an object is performing an action.
- Return Messages: Dashed arrows indicating the response to a request.
These elements allow architects and developers to map out logic flows, identify bottlenecks, and document expected behaviors before a single line of code is written.
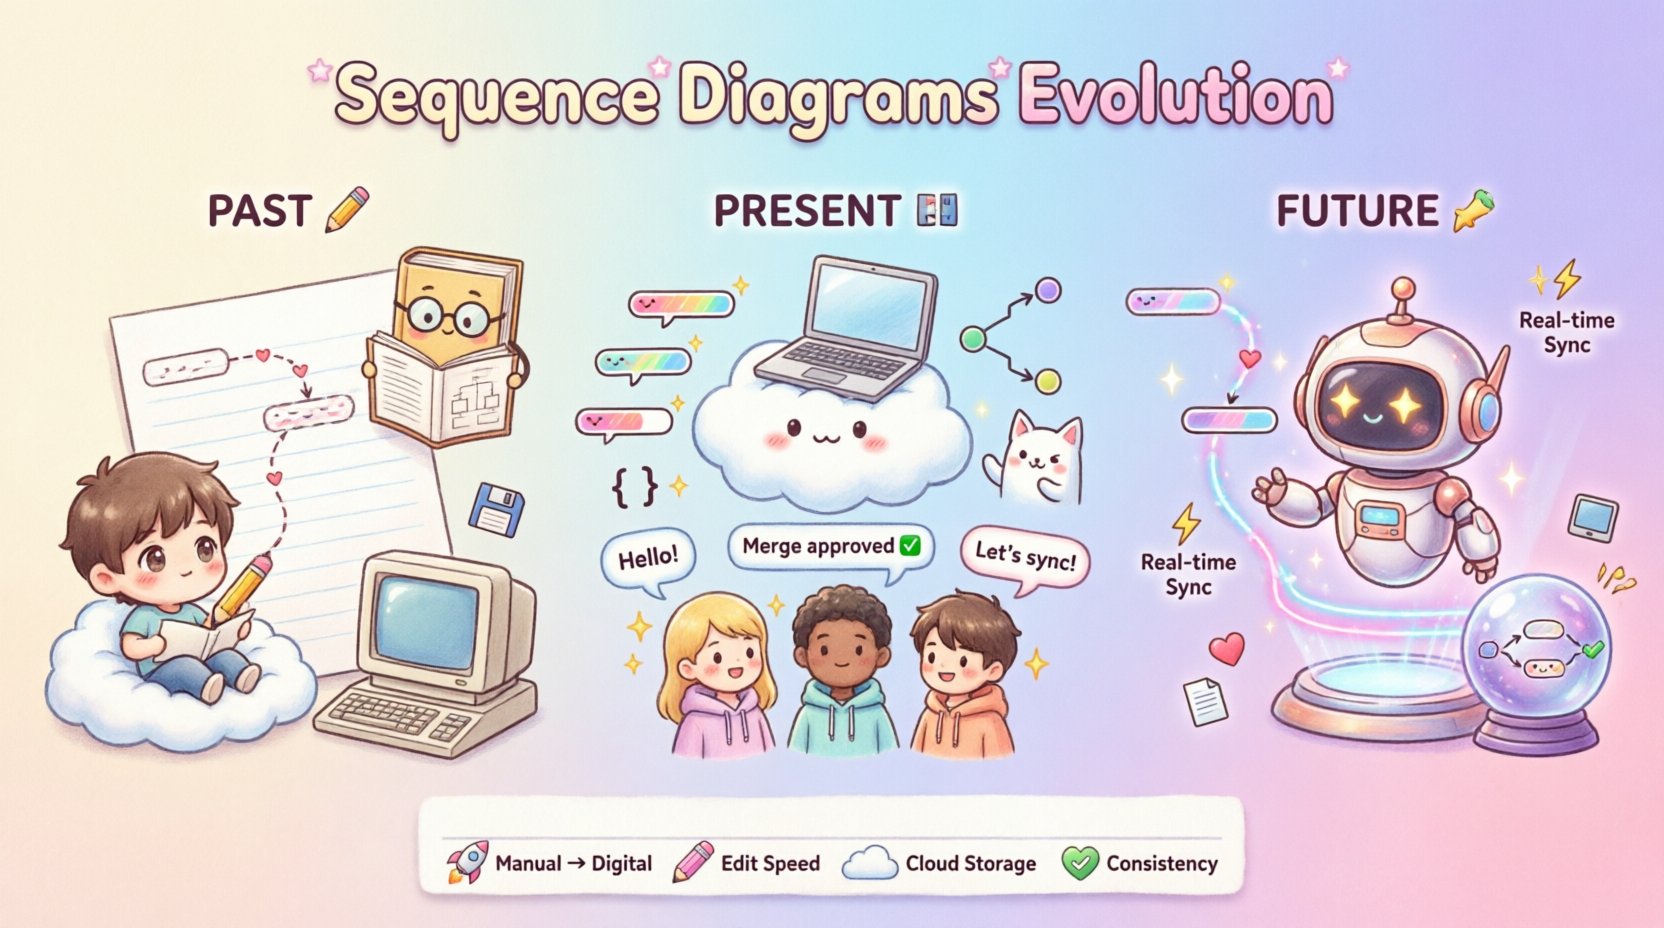
The Past: Manual Sketching and Early Standardization 📝
The origins of sequence diagrams predate modern Unified Modeling Language (UML) standards. In the early days of object-oriented analysis, engineers relied heavily on hand-drawn sketches to communicate system logic.
1. The Pre-UML Era (1980s – Early 1990s)
During this period, modeling was often ad-hoc. Teams used various notations to describe interactions. There was no universal standard, which led to confusion across different projects and organizations. Communication relied on:
- Hand-drawn charts: Created on paper or whiteboards during meetings.
- Ad-hoc symbols: Different teams used different arrows for different types of calls.
- Verbal descriptions: Heavy reliance on verbal explanation alongside the sketch.
This lack of standardization created barriers. When a new developer joined a project, they had to learn the specific notation used by the previous team. The time cost for maintenance was high, as physical copies were difficult to update.
2. The Birth of UML (Mid 1990s)
The mid-1990s marked a turning point. The Object-Oriented Software Engineering (OOSE) method, introduced by Ivar Jacobson and colleagues, formalized the concept of interaction diagrams. This work laid the foundation for the Unified Modeling Language (UML).
- Standardization: UML 1.0 provided a common syntax for describing system interactions.
- Formal Definition: The sequence diagram became a recognized artifact in software design specifications.
- Notation Rules: Clear rules were established for synchronous vs. asynchronous messages and object lifecycles.
This era shifted the focus from personal interpretation to shared understanding. The sequence diagram was no longer just a sketch; it was a specification.
The Present: Digital Tools and Code Integration 💻
As software complexity grew, manual drawing became insufficient. The transition to digital modeling tools brought significant changes to how sequence diagrams are created and maintained. This phase is characterized by automation, version control, and integration with the development environment.
1. The Rise of Modeling Software
Software platforms allowed users to drag and drop elements onto a canvas. This improved accuracy and consistency.
- Visual Editors: Mouse-driven interfaces replaced pen and paper.
- Templates: Pre-defined structures ensured diagrams followed standard rules.
- Printing and Export: High-quality rendering for documentation and presentations.
2. Integration with Development Workflows
Modern development relies on version control systems. Diagrams needed to adapt to this reality. The ability to store diagrams alongside source code in repositories became a standard practice.
- Text-Based Definitions: Some tools allow diagrams to be defined in text files, enabling diffing and merging in version control systems.
- Reverse Engineering: Tools can generate sequence diagrams from existing codebases, providing a snapshot of actual runtime behavior.
- Code Generation: Skeleton code can be produced from diagrams to speed up initial implementation.
3. Collaboration and Cloud
Remote work and distributed teams necessitated real-time collaboration. Diagrams became cloud-hosted artifacts accessible from anywhere.
- Multi-user Editing: Multiple stakeholders can view or edit a diagram simultaneously.
- Commenting: Feedback loops are integrated directly into the diagram interface.
- Sharing: Links allow non-technical stakeholders to view designs without installing software.
Comparing Eras: Manual vs. Digital 📊
To understand the magnitude of the shift, consider the following comparison between the manual era and the current digital standard.
| Feature | Manual Era | Digital Era |
|---|---|---|
| Creation Speed | Slow, requires drawing tools | Fast, drag-and-drop or text-based |
| Modification | Difficult, often requires redrawing | Easy, instant updates |
| Storage | Physical files or local images | Cloud repositories and version control |
| Consistency | Varies by author | Enforced by templates and rules |
| Accessibility | Local or printed only | Accessible from any device |
| Linkage to Code | None | Bi-directional links possible |
The Future: AI, Automation, and Reality 🚀
Looking ahead, the sequence diagram is evolving again. The next phase involves deeper integration with artificial intelligence and live system data. The goal is to reduce the gap between design and reality.
1. Generative Design with AI
Artificial intelligence models can now interpret natural language requirements and generate structured diagrams. This reduces the initial setup time for architects.
- Text-to-Diagram: Describing a feature in plain English generates the initial sequence structure.
- Refinement: AI suggests improvements based on best practices and common patterns.
- Consistency Checks: Automated validation ensures no logical errors exist in the flow.
2. Real-Time Synchronization
Static diagrams are often out of date by the time they are published. Future tools aim to create dynamic diagrams that reflect the actual running system.
- Live Monitoring: Diagrams update as transactions occur in production environments.
- Traceability: Clicking an element in the diagram jumps to the specific code implementation.
- Performance Metrics: Response times and latency can be visualized directly on the interaction arrows.
3. Predictive Modeling
Beyond describing what happens, future diagrams will predict what could happen under stress.
- Load Simulation: Visualizing bottlenecks before deployment.
- Failure Scenarios: Modeling how the system behaves during errors or network partitions.
- Security Flows: Explicitly mapping authentication and authorization steps in the sequence.
Challenges in Modern Modeling ⚠️
Despite advancements, challenges remain. The discipline of maintaining sequence diagrams requires effort and strategy.
1. Documentation Drift
As code changes, diagrams often do not. This creates a trust gap where developers ignore the diagrams because they are inaccurate.
- Solution: Treat diagrams as code. Update them in the same commit as the code.
- Solution: Automate generation where possible to ensure accuracy.
2. Complexity Management
Large systems generate massive diagrams that are difficult to read. A single page cannot show the entire flow of a microservices architecture.
- Solution: Use hierarchy and grouping to break down complex flows.
- Solution: Focus on specific scenarios rather than trying to document every path.
3. Tool Fragmentation
Organizations often use different tools for different teams, leading to silos.
- Solution: Adopt standard file formats that can be imported by various platforms.
- Solution: Prioritize interoperability over specific feature sets.
Best Practices for Effective Diagramming 🛠️
To maximize the value of sequence diagrams, follow these established guidelines. These practices ensure clarity and utility across the team.
1. Define Scope Clearly
Do not attempt to model the entire system in one diagram. Focus on a specific use case or feature interaction.
- Identify the trigger event (e.g., “User Clicks Checkout”).
- Identify the success criteria (e.g., “Order Created”).
- Keep the diagram focused on the happy path and major exception paths.
2. Use Consistent Naming
Labels should be unambiguous. Use domain language rather than technical jargon where possible.
- Objects: Use nouns (e.g., “Customer”, “PaymentProcessor”).
- Messages: Use verbs (e.g., “RequestInvoice”, “ValidateCard”).
- Interfaces: Clearly define the contract between components.
3. Abstraction Levels
Not every diagram needs to show every API call. Adjust the level of detail based on the audience.
- Architectural View: High-level service interactions.
- Implementation View: Detailed method calls and data structures.
- Integration View: Focus on external system boundaries.
4. Automate Where Possible
Reduce manual overhead by using text-based definitions or code generation tools.
- Store diagrams in text format to enable version control diffs.
- Use scripts to validate diagram syntax before merging.
- Integrate diagram checks into the continuous integration pipeline.
Conclusion on the Journey 🌟
The history of sequence diagrams reflects the broader evolution of software engineering itself. From the analog sketches of the past to the digital, automated, and AI-assisted tools of today, the core purpose remains the same: to clarify interaction.
As we move forward, the distinction between design and implementation will blur further. Diagrams will become living artifacts that evolve with the code. This shift promises to reduce technical debt and improve system reliability. However, the human element remains central. Tools assist, but understanding the logic and the business value requires human insight.
By adhering to best practices and embracing new technologies, teams can ensure that sequence diagrams remain a vital part of the development lifecycle. They serve as the bridge between abstract requirements and concrete execution, ensuring that the system behaves as intended.
Continual learning and adaptation are necessary. The notation may change, and the tools may evolve, but the need for clear, dynamic interaction modeling will persist. Staying informed about these changes ensures that documentation remains relevant and useful for future maintenance.
