


Sequence diagrams are a cornerstone of software design. They visualize how objects interact over time. For students entering the field of computer science, understanding these diagrams is crucial. They bridge the gap between abstract logic and concrete implementation. This guide breaks down the core concepts, syntax, and best practices you need to know. 🛠️
What is a Sequence Diagram? 📉
A sequence diagram is a type of interaction diagram in the Unified Modeling Language (UML). It shows how operations are carried out. It captures the dynamic behavior of a system. Unlike class diagrams, which show structure, sequence diagrams show time-based interactions.
Think of it as a script for a play. Each participant has a role. The arrows represent dialogue. The vertical lines represent the passage of time. Understanding this metaphor helps in visualizing the flow. It is not just about drawing lines. It is about modeling behavior.
Why Learn This? 🤔
- Communication: It allows developers to discuss logic without code.
- Validation: It helps catch logical errors early in the design phase.
- Documentation: It serves as a reference for future maintenance.
- Testing: It guides the creation of unit and integration tests.
Core Components of the Diagram 🧱
Every sequence diagram relies on a few fundamental building blocks. Mastering these ensures clarity. If the basics are shaky, the advanced concepts will be confusing.
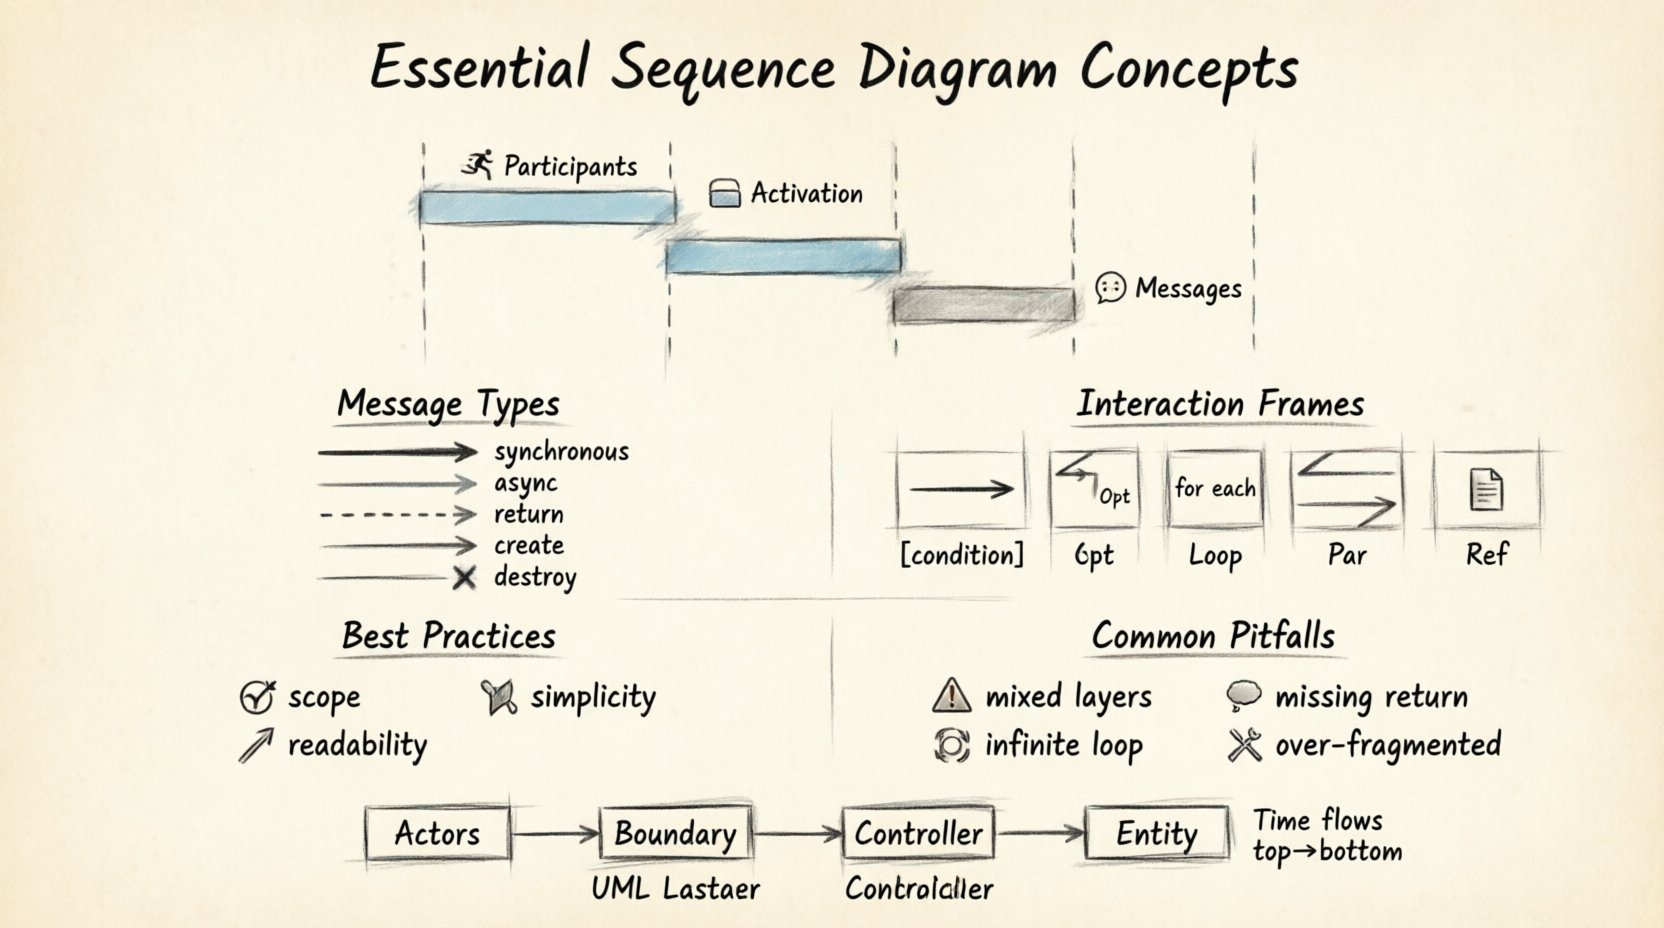
1. Participants (Lifelines) 🏃
Lifelines represent objects or actors in the system. They are drawn as vertical dashed lines. The top of the line shows the object name. The bottom extends into the past or future. This represents the existence of the object over time.
Common participants include:
- Actors: Humans or external systems interacting with the software.
- Controllers: Objects that manage flow and logic.
- Boundary Objects: Interfaces that handle input or output.
- Entity Objects: Data models or persistent storage.
2. Activation Bars 🟦
Activation bars (or focus of control) appear on the lifeline. They indicate when an object is actively performing an operation. This is a rectangle on the vertical line. It shows when the object is busy. It starts when a message is received and ends when the message returns.
Key points about activation:
- It shows execution time.
- It helps identify bottlenecks.
- It clarifies who is holding the control at any moment.
3. Messages 💬
Messages are horizontal arrows between lifelines. They represent calls, returns, or signals. The direction of the arrow indicates the sender and receiver. The timing indicates the order of events.
Messages must be labeled clearly. A label describes the operation being performed. For example, login() or fetchData(). Ambiguity here leads to implementation errors.
Types of Messages Explained ⚡
Not all messages are the same. The visual style of the arrow conveys specific semantic meaning. Distinguishing between them is vital for accurate modeling.
| Message Type | Visual Style | Behavior |
|---|---|---|
| Synchronous Call | Solid line, filled arrowhead | Sender waits for completion. |
| Asynchronous Call | Solid line, open arrowhead | Sender continues without waiting. |
| Return Message | Dashed line, open arrowhead | Result sent back to caller. |
| Create Message | Solid line, filled arrowhead | Instantiates a new object. |
| Destroy Message | Thick bar at end of lifeline | Object ceases to exist. |
Synchronous Calls 🔗
This is the most common interaction. The sender sends a message and pauses. It waits for the receiver to finish processing. Only then does the sender resume. This is like making a phone call. You wait for the other person to answer.
Asynchronous Calls 🚀
The sender dispatches a message and does not wait. It continues its own execution immediately. The receiver processes the message in the background. This is like sending an email. You do not wait for the reply to continue working.
Return Messages 🔄
These are often omitted for clarity if the context is obvious. They represent the response to a call. They are always dashed lines. This distinguishes them from the active flow of calls.
Advanced Interaction Frames 🔲
Real-world systems are rarely linear. They involve decisions, loops, and parallel processes. UML provides frames to handle this complexity. These are rectangular boxes surrounding parts of the diagram.
1. Alt (Alternative) Frames 🔄
Use this for if-else logic. It shows mutually exclusive paths. The frame is divided by horizontal dashed lines. Each section represents a condition.
- Guard Condition: A boolean expression in square brackets.
- Example:
[user is admin]vs[user is guest].
2. Opt (Optional) Frames ⚪
Use this when a sequence of steps may or may not happen. It is essentially an if statement without an else. If the condition is false, the steps are skipped entirely.
3. Loop Frames 🔄
Use this for for or while loops. It indicates that the enclosed messages repeat. The top of the frame contains the loop condition.
- Example:
for each item in list. - Multiple Iterations: Show the first iteration clearly.
4. Par (Parallel) Frames ⚡
Use this for concurrent execution. Multiple threads or processes run simultaneously. The frame is divided by dashed lines. Each section runs independently.
5. Ref (Reference) Frames 🔗
Use this to reference another diagram. It keeps the current diagram clean. Instead of drawing a long sub-process, you point to a detailed diagram elsewhere.
Best Practices for Students 📝
Creating diagrams is an art as much as a science. Following guidelines ensures your work is readable and useful.
1. Define the Scope Clearly 🎯
Start with a clear objective. What scenario are you modeling? Is it a login flow? A payment transaction? Define the start and end points. Do not draw the entire system in one diagram. Break it down into logical chunks.
2. Keep It Readable 📖
- Ordering: Time flows from top to bottom.
- Alignment: Align related messages vertically.
- Labels: Use verbs for messages (e.g.,
sendEmail, notEmail).
3. Avoid Clutter 🧹
Do not include every single internal method call. Only show interactions that matter to the flow. If a diagram looks like a hairball, simplify it. Use Ref frames to hide complexity.
4. Consistency is Key 🔒
Use the same naming conventions across all diagrams. If you call a method getUser in one diagram, do not call it fetchUser in another. Consistency reduces cognitive load for readers.
Common Pitfalls to Avoid 🚫
Even experienced engineers make mistakes. Here are common traps to watch out for.
1. Mixing Concerns 🥪
Do not mix UI logic with database logic in a confusing way. Keep the layers distinct. A sequence diagram should show the flow through layers, but not get bogged down in implementation details of a single layer.
2. Infinite Loops 🌀
Ensure loop frames have an exit condition. If a loop never ends, the system hangs. Document the termination criteria clearly in the guard condition.
3. Missing Return Messages 📬
While not always mandatory, omitting returns can make it hard to track data flow. Especially for asynchronous calls, ensure the return path is implied or shown if critical.
4. Overusing Fragments 🔨
Using Alt frames for every decision makes the diagram messy. Sometimes a simple message flow is enough. Reserve complex frames for significant branching logic.
Integration with Other UML Diagrams 🧩
Sequence diagrams do not exist in isolation. They work in tandem with other UML views.
With Class Diagrams 🏗️
The lifelines in a sequence diagram correspond to classes or objects in a class diagram. Ensure the names match exactly. If a lifeline is OrderService, a class named OrderManager might cause confusion.
With State Machine Diagrams 🔄
State diagrams show the lifecycle of a single object. Sequence diagrams show interactions between multiple objects. Use state diagrams when you need to explain complex internal transitions of one object.
With Use Case Diagrams 📋
Use cases define the functional requirements. Sequence diagrams flesh out the technical steps to fulfill those requirements. A single use case might span multiple sequence diagrams.
Design Patterns in Sequence Diagrams 🧠
Recognizing patterns helps in designing robust systems. Here are common patterns you will encounter.
1. Facade Pattern 🚪
A facade object simplifies a complex subsystem. The sequence diagram shows the client talking to the facade, and the facade talking to many internal objects. This hides complexity.
2. Observer Pattern 👀
One object notifies many others of a state change. The diagram shows a notifyObservers() message branching out to multiple receivers. This is common in event-driven architectures.
3. Singleton Pattern 🔑
A single instance is accessed globally. The diagram shows multiple clients requesting the same object instance. This highlights the shared resource.
Real-World Application 🌍
How do you apply this in your studies and career?
- Group Projects: Use diagrams to agree on API contracts before coding.
- Code Reviews: Compare the actual code flow against the design diagram.
- Legacy Systems: Draw diagrams to understand undocumented code.
- Interviews: Whiteboard sequence diagrams to demonstrate problem-solving skills.
Step-by-Step Creation Guide 🛠️
Follow this workflow when creating a new diagram.
- Identify Actors: Who is starting the process?
- Identify Objects: What internal components are involved?
- Draw Lifelines: Place them horizontally in order of interaction.
- Add Messages: Draw the primary flow from top to bottom.
- Define Frames: Add loops or conditions where necessary.
- Review: Check for logical errors and missing returns.
Final Thoughts 💡
Sequence diagrams are a powerful tool for clarity. They transform abstract thoughts into visual logic. For software engineering students, mastering this skill is a significant step towards professional competence. It requires practice. Start with simple interactions. Gradually add complexity. Always prioritize readability over technical perfection. The goal is communication.
Keep your diagrams updated. Code changes, and so should your models. This discipline ensures your documentation remains a true reflection of the system. With these concepts, you are well-equipped to design robust, interactive software systems. 🚀

