


Software architecture often feels like a divide between abstract planning and concrete implementation. Engineers spend hours designing systems on whiteboards or in documents, only to find discrepancies when writing code. This gap can lead to integration issues, misaligned expectations, and technical debt. To close this distance, visual modeling serves as a critical communication bridge. Among the various tools available, the sequence diagram stands out as a powerful mechanism for describing interactions over time.
These diagrams do more than just show who talks to whom; they capture the flow of control, the timing of events, and the state changes that occur within a system. By treating sequence diagrams as living artifacts rather than static documentation, teams can align their theoretical models with practical realities. This guide explores how to leverage these diagrams effectively, ensuring they remain relevant throughout the development lifecycle.
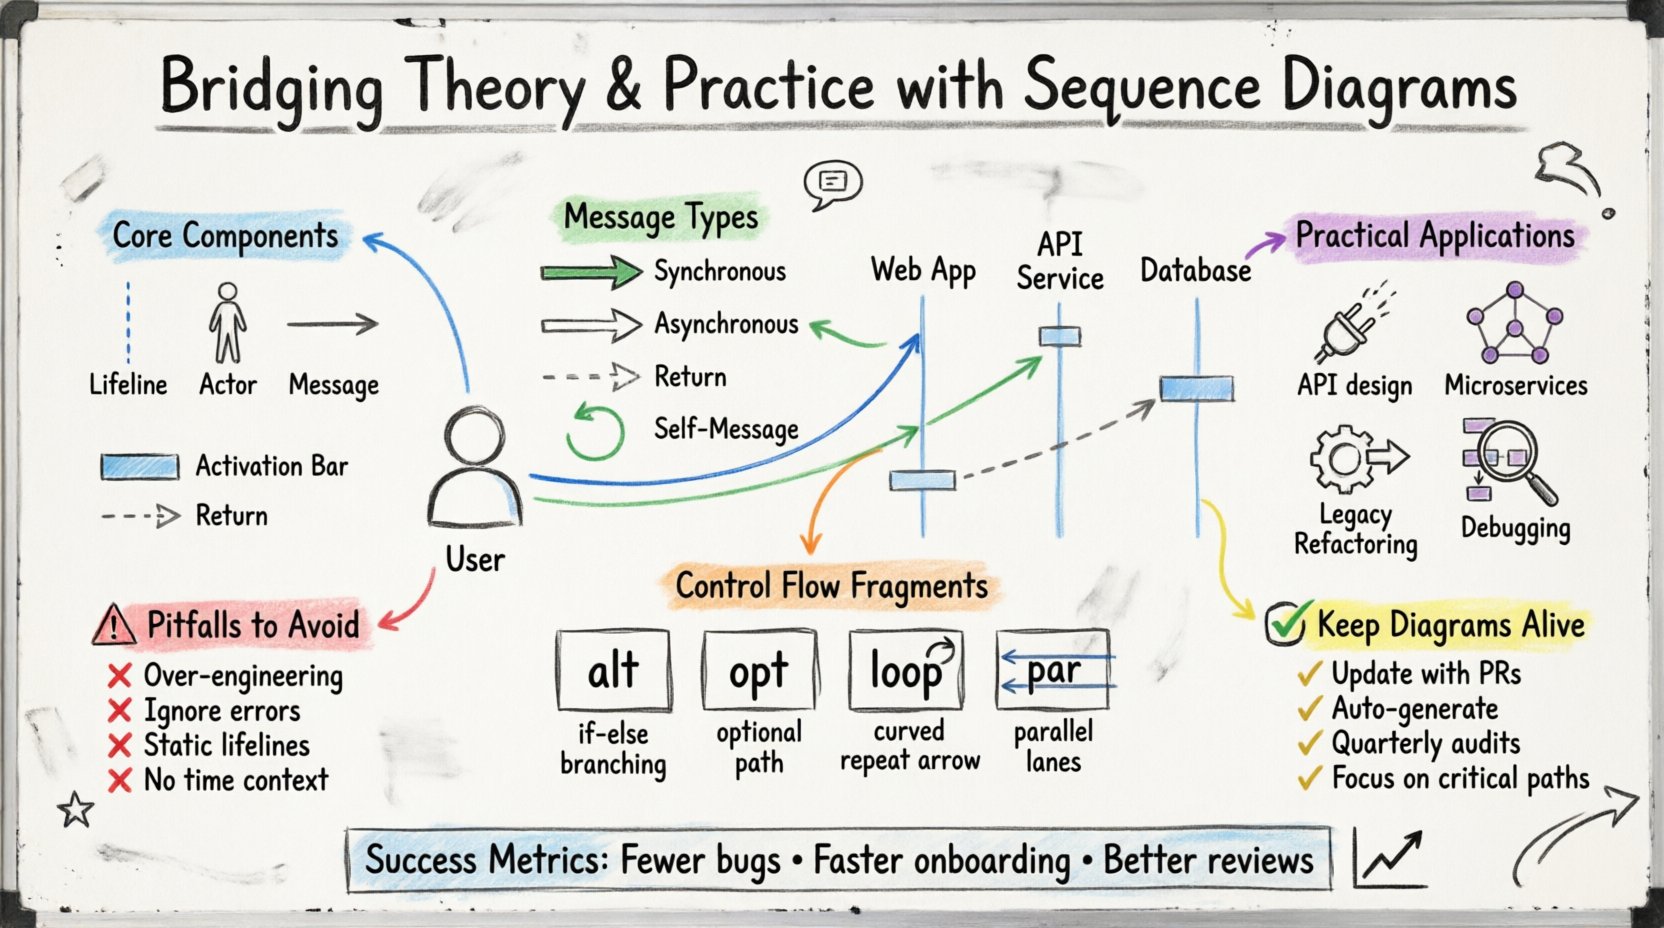
🧩 Understanding the Core Components
Before diving into complex scenarios, it is essential to grasp the fundamental elements. A sequence diagram is a behavioral UML diagram that focuses on the order of interactions. It visualizes how objects or actors communicate with each other to achieve a specific goal.
Consider the following breakdown of the primary elements:
Lifelines: Vertical dashed lines representing an object, actor, or system component. They indicate the existence of an entity over a period.
Actors: Stick figures representing external entities that initiate interactions, such as users or other systems.
Messages: Horizontal arrows showing communication between lifelines. These represent method calls, data transfers, or signals.
Activation Bars: Thin rectangles on a lifeline indicating when an object is actively performing an operation.
Return Messages: Dashed arrows pointing back to the sender, indicating the completion of a request.
Each component serves a specific purpose. Lifelines provide the context of time, while messages define the logic. Activation bars highlight the computational load and concurrency. Without these distinctions, a diagram becomes a static flowchart rather than a dynamic interaction model.
🏗️ The Theory-Practice Gap
Many teams create sequence diagrams during the design phase, only to discard them once coding begins. This practice creates a disconnect. The theoretical model diverges from the practical codebase, leading to confusion. Why does this happen?
Static vs. Dynamic Views: Designers often focus on structure (Class Diagrams) rather than behavior (Sequence Diagrams). While structure is vital, behavior dictates how the system reacts to events.
Complexity Creep: As systems grow, diagrams become too detailed to maintain. Teams stop updating them because the effort outweighs the perceived value.
Lack of Feedback Loops: If developers do not consult the diagrams during implementation, the diagrams become obsolete immediately.
To bridge this gap, the diagrams must evolve with the code. They should not be a one-time deliverable but a reference point for architectural decisions. When a developer encounters a complex integration point, the sequence diagram should clarify the expected data flow before a line of code is written.
📋 Analyzing Message Types
Not all interactions are created equal. Understanding the nuances of message types is crucial for accurate modeling. Different messages imply different system behaviors and dependencies.
Message Type | Visual Representation | Use Case |
|---|---|---|
Synchronous Call | Solid line, filled arrowhead | Caller waits for a response before proceeding. |
Asynchronous Call | Open arrowhead (no fill) | Caller sends data and continues without waiting. |
Return Message | Dashed line, open arrowhead | Response sent back to the caller. |
Self-Message | Arrow looping back to the same lifeline | Internal processing or recursive logic. |
Using the correct arrow types conveys specific technical requirements. A synchronous call implies a blocking operation, which affects system performance and user experience. An asynchronous call suggests non-blocking behavior, often used in high-throughput environments. Mislabeling these can lead to architectural flaws where performance bottlenecks are introduced inadvertently.
🔄 Control Flow and Logic
Real-world systems rarely follow a straight line. Logic branches, loops, and conditions are common. Sequence diagrams must account for these variations to remain useful. This is where fragments come into play.
Key interaction fragments include:
alt (Alternative): Represents if-else logic. Only one path executes based on a condition.
opt (Optimal): Represents optional behavior. The enclosed interaction may or may not occur.
loop: Represents repetitive actions, such as iterating through a collection.
break: Represents an exception or early exit from a loop.
par (Parallel): Indicates concurrent execution paths that happen simultaneously.
When modeling these fragments, clarity is paramount. Overusing par can make a diagram look chaotic, obscuring the main flow. Similarly, nesting too many alt blocks can reduce readability. The goal is to simplify complexity, not add to it.
🛠️ Practical Application in Development
How do these diagrams translate to actual engineering work? They serve multiple functions across the software development lifecycle.
1. API Design
Before writing an API, engineers can map out the request-response cycle. This helps define input parameters, expected outputs, and potential error states. It ensures that the contract between services is clear before implementation begins.
2. Microservices Communication
In distributed systems, services must communicate reliably. Sequence diagrams help visualize network calls, timeouts, and retries. They highlight potential points of failure, such as a service that hangs during a network partition.
3. Legacy Refactoring
When modernizing old systems, understanding the existing behavior is critical. Reverse-engineering a sequence diagram from the codebase can document hidden logic that no longer exists in the source code. This documentation aids in migration planning.
4. Debugging and Troubleshooting
When a bug occurs in production, the sequence diagram provides a baseline. Engineers can compare the actual runtime logs against the designed flow to identify where the system deviated from expectations.
⚠️ Common Pitfalls to Avoid
Even experienced architects make mistakes when modeling interactions. Being aware of common errors helps maintain diagram quality.
Over-Engineering: Modeling every single method call creates noise. Focus on high-level interactions and business logic flows.
Ignoring Error Paths: Happy paths are easy to draw. Real systems fail. Include error handling and exception flows to ensure robustness.
Static Lifelines: Lifelines should represent entities that persist or are active. Avoid creating lifelines for transient variables that do not persist across messages.
Missing Time Context: Sequence diagrams imply time flows top-to-bottom. Ensure the order of messages reflects the logical sequence of events.
Lack of Context: A diagram without a defined scope can be confusing. Specify the trigger event and the expected outcome at the top.
Reviewing diagrams with the team is also vital. A single person might miss a dependency that another developer notices. Peer reviews ensure the model aligns with the collective understanding of the system.
🔄 Maintaining Alignment
The biggest challenge is keeping the diagram in sync with the code. Code changes frequently; documentation often does not. To maintain alignment, treat the diagram as part of the code repository.
Strategies for maintenance include:
Update with Pull Requests: Require diagram updates when significant architectural changes are proposed.
Automate Generation: Some tools can generate diagrams from code annotations. While not perfect, they provide a baseline that can be corrected manually.
Periodic Audits: Schedule quarterly reviews of critical diagrams to ensure they match the current system state.
Focus on Critical Paths: Do not try to document every feature. Prioritize the core flows that drive the business value.
This approach ensures that the documentation remains a reliable resource. If a diagram is outdated, it loses its value as a communication tool. Teams must value the effort required to keep these models accurate.
🤝 Collaboration and Communication
Sequence diagrams are not just for engineers. They serve as a bridge between technical and non-technical stakeholders. Business analysts can use them to validate requirements. Product owners can understand the flow of data to make informed decisions.
When presenting a diagram, focus on the story it tells. Instead of listing every method call, explain the user journey. For example, “The user submits a form, the system validates the data, and if successful, the order is processed.” This narrative approach makes the technical details accessible.
Clarity in communication reduces misunderstandings. When everyone agrees on the flow, the implementation is more likely to succeed. This shared understanding reduces the need for rework and minimizes bugs caused by misinterpreted requirements.
🔍 Advanced Patterns
Beyond the basics, there are advanced patterns that address specific architectural needs. Understanding these allows for more precise modeling.
Message Chains: Sometimes, a message passes through multiple intermediaries. Modeling this chain helps identify performance bottlenecks in the middleware.
State Changes: While sequence diagrams focus on interactions, they can imply state changes. An object receiving a message might change its internal state, which is reflected in subsequent messages.
Resource Allocation: Diagrams can show when resources (like database connections) are acquired and released. This helps in identifying resource leaks or contention issues.
Security Context: Authentication tokens or session IDs can be passed as messages. Modeling this ensures security is not an afterthought.
These patterns add depth to the model. They allow architects to think beyond simple request-response cycles and consider the broader ecosystem of the application.
📈 Measuring Success
How do you know if your sequence diagrams are working? Look for improvements in team velocity and reduction in defects. If developers spend less time guessing how components interact, the diagrams are serving their purpose.
Fewer Integration Bugs: Clear interaction models reduce mismatches between services.
Faster Onboarding: New team members can understand the system faster by reviewing the diagrams.
Better Design Reviews: Discussions become more focused on logic rather than basic connectivity.
These metrics indicate that the modeling effort is yielding tangible benefits. The goal is not perfection in the diagram, but clarity in the communication.
💡 Final Thoughts
Bridging the gap between theory and practice requires discipline. Sequence diagrams are a tool, not a magic solution. They demand effort to create and maintain. However, when used correctly, they provide a shared language for complex systems.
By focusing on clarity, accuracy, and maintenance, teams can ensure these diagrams remain valuable assets. They transform abstract requirements into concrete blueprints, guiding the development process with precision. The result is a system that behaves as intended, built on a foundation of clear communication and shared understanding.
Start small. Pick a critical feature and model its interaction. Iterate as the feature evolves. Over time, this practice will become ingrained in the workflow, leading to more robust and reliable software solutions.
