


Understanding how software components interact is a critical skill for any developer or designer. A sequence diagram offers a visual way to map out these interactions over time. Whether you are planning a new feature or debugging a complex flow, visualizing the exchange of messages between objects provides clarity that code alone often lacks. This guide will walk you through the process of creating your first sequence diagram using standard notation, without relying on specific branded tools.
By the end of this tutorial, you will understand the anatomy of a sequence diagram, how to represent different types of messages, and how to handle complex logic using standard fragments. Let us begin building better system designs together.
What is a Sequence Diagram? 🤔
A sequence diagram is a type of interaction diagram in Unified Modeling Language (UML). It shows how objects or processes relate to each other and the order in which these interactions occur. Unlike a class diagram that focuses on static structure, a sequence diagram focuses on dynamic behavior.
Think of it as a script for a play. The characters are the objects, and the lines they speak are the messages they send to one another. The vertical axis represents time flowing downwards, while the horizontal axis represents different participants.
Why Use Them? 📈
- Clarification: Reduces ambiguity in requirements.
- Documentation: Provides a snapshot of system behavior for future reference.
- Communication: Bridges the gap between technical and non-technical stakeholders.
- Debugging: Helps trace the path of data flow during issues.
Core Components Explained 🧩
Before drawing lines, you must understand the building blocks. Every sequence diagram consists of specific elements that convey meaning.
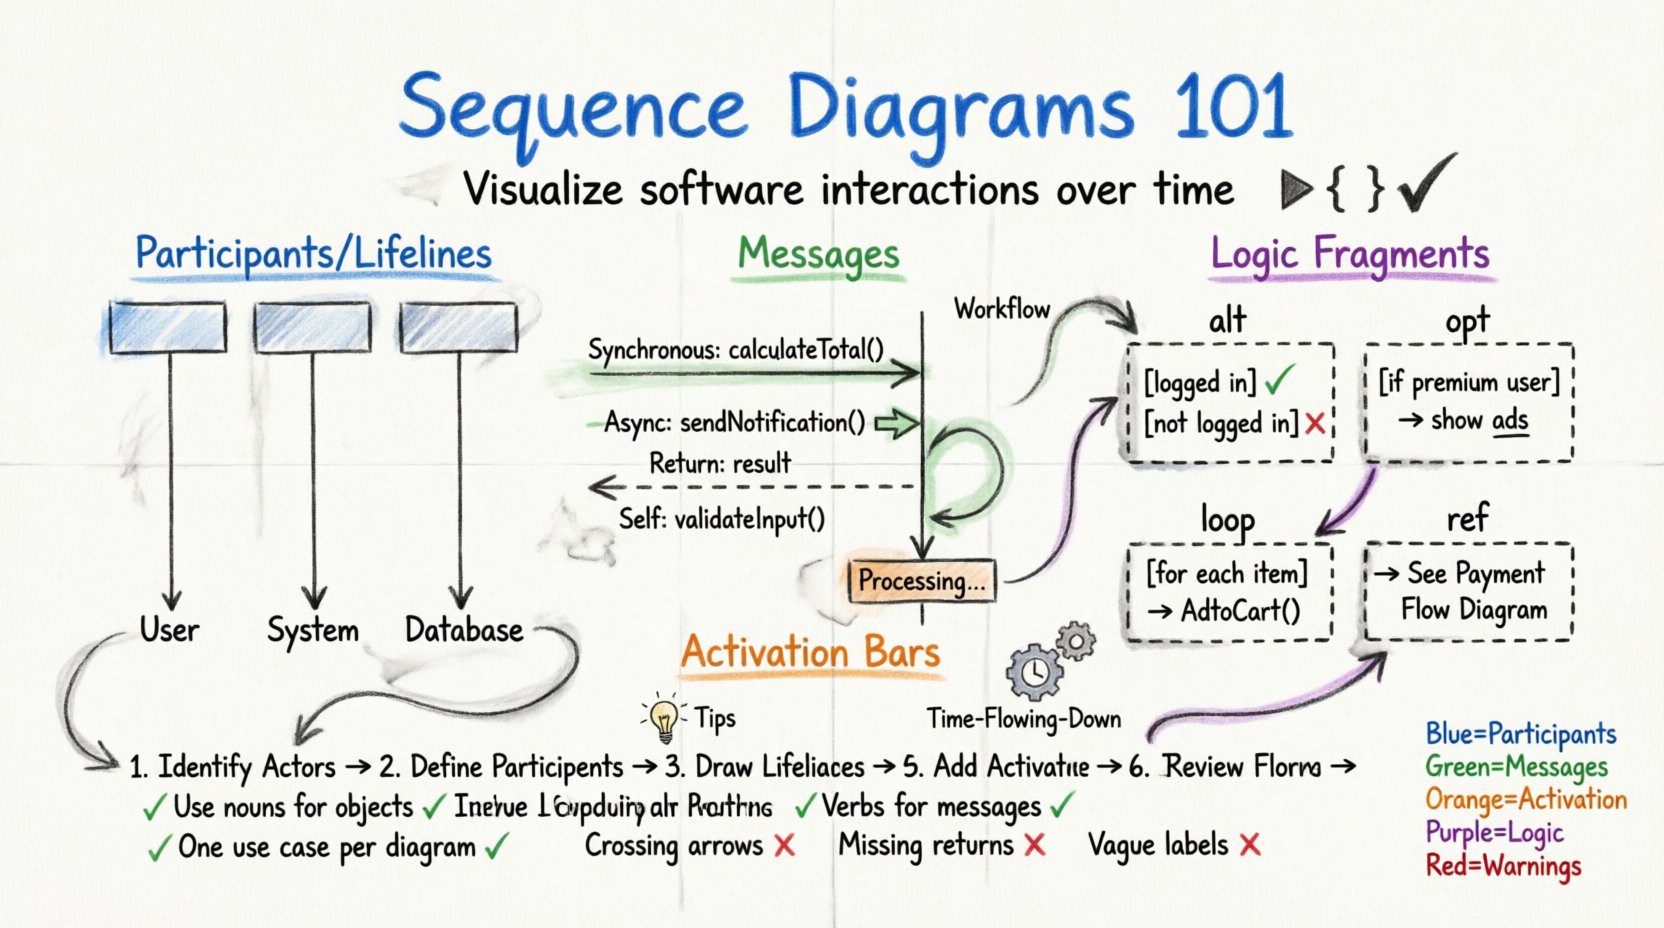
1. Participants (Lifelines) 🏃
Participants represent the entities involved in the interaction. These can be users, external systems, database servers, or internal software objects. They are typically represented by rectangles at the top of the diagram with a vertical dashed line extending downwards. This line is called a lifeline.
Each lifeline represents the existence of an object over time. If the line stops, the object is destroyed or goes out of scope.
2. Messages 💬
Messages are the actions taken by one participant to another. They are drawn as horizontal arrows pointing from the sender’s lifeline to the receiver’s lifeline. The label on the arrow describes the action, such as login() or fetchData().
3. Activation Bars 🔋
When a participant receives a message and begins processing it, a thin rectangle appears on its lifeline. This is the activation bar. It indicates the period during which the object is actively performing work.
4. Return Messages 🔄
When a process completes, the receiver often sends a response back to the sender. This is typically drawn as a dashed arrow pointing in the opposite direction of the original request.
Message Types and Notation 📝
Not all messages are the same. The style of the arrow conveys how the sender handles the response.
| Message Type | Arrow Style | Behavior | Example |
|---|---|---|---|
| Synchronous | Filled Arrowhead | Caller waits for response | calculateTotal() |
| Asynchronous | Open Arrowhead | Caller continues immediately | sendNotification() |
| Return | Dashed Line | Response to previous call | return result |
| Self-Message | Curved Arrow | Object calls itself | validateInput() |
Step-by-Step Construction Guide 🛠️
Now that you know the parts, let us assemble them. Follow this logical flow to create a clean diagram.
- Identify the Actors: Determine who starts the process. Usually, this is a user or an external trigger.
- Define the Participants: List all internal objects required to fulfill the request. Keep names concise and meaningful.
- Draw Lifelines: Place the actors and objects in a row at the top. Draw the vertical dashed lines down.
- Map the First Interaction: Draw the initial message from the actor to the system entry point.
- Trace the Logic: Follow the data. If the system needs to check a database, draw a message to the data layer. Add activation bars where work happens.
- Add Returns: Ensure every action has a corresponding return path, even if it is just an acknowledgment.
- Review Flow: Check that time flows logically from top to bottom. Ensure no arrows cross unnecessarily.
Handling Complex Logic with Fragments 🔁
Real-world software is rarely linear. It involves choices, loops, and optional steps. Sequence diagrams use fragments to handle these scenarios. These are enclosed in a dashed rectangle with a label in the top-left corner.
1. Alt (Alternative) 🚦
Use this for if/else logic. It splits the flow into different options based on a condition.
- Label the fragment
alt. - Divide the fragment into sections using horizontal dashed lines.
- Label each section with the condition (e.g.,
[user is logged in]).
2. Opt (Optional) 📌
Use this when a step might happen but is not guaranteed. It represents an optional path.
- Label the fragment
opt. - Include the condition that triggers this path.
3. Loop 🔁
Use this for for or while loops. It indicates that a sequence of messages repeats.
- Label the fragment
loop. - Add a condition if the loop has a limit (e.g.,
[for each item]).
4. Ref (Reference) 🔗
Use this to reference another sequence diagram. This keeps your current diagram clean by abstracting complex sub-processes.
- Label the fragment
ref. - Point to the specific diagram or section being referenced.
Naming Conventions and Best Practices 📝
Clarity is king. A diagram that is hard to read provides no value. Adhere to these conventions to ensure your work remains useful.
Object Naming
- Use nouns for objects (e.g.,
Order,User). - Use verbs for messages (e.g.,
createOrder(),login()). - Avoid generic names like
Object1orSystem.
Visual Layout
- Keep the diagram width manageable. If it gets too wide, split it into multiple diagrams.
- Avoid crossing arrows. Reorder participants if necessary to minimize intersections.
- Group related messages together vertically.
Scope Management
- Do not draw the entire system in one diagram.
- Focus on one specific use case or user story per diagram.
- Use reference fragments for deeper levels of detail.
Common Mistakes to Avoid 🚫
Even experienced designers make errors. Watch out for these common pitfalls.
- Ignoring Time: Ensure the vertical order makes sense. A message sent later should be lower on the page.
- Missing Returns: Forgetting to draw the return arrow can make the diagram look incomplete.
- Overloading: Putting too much logic into a single message label. Keep labels short.
- Inconsistent Style: Mixing solid and dashed arrows for the same type of message confuses readers.
- No Context: Starting without defining the trigger. What starts the sequence? A button click? A timer?
Integrating into Development Workflows 🔄
Sequence diagrams are not just for documentation; they are tools for development. Here is how they fit into the lifecycle.
1. Design Phase
Draw the diagram before writing code. This helps identify missing dependencies or logic gaps early.
2. Code Implementation
Use the diagram as a checklist. Ensure every message in the diagram is implemented in the code.
3. Testing
Use the diagram to create test cases. Verify that the actual execution matches the planned flow.
4. Maintenance
Update the diagram when the code changes. A diagram that is out of sync is worse than no diagram at all.
Advanced Patterns for Scalability 🏗️
As your system grows, your diagrams will need to scale. Consider these patterns.
1. Object Destruction
When an object is no longer needed, mark the end of its lifeline with a cross (X). This indicates the object has been destroyed.
2. Timing Constraints
Some systems have strict time limits. You can add timing notes near messages to indicate deadlines (e.g., <timeout: 5s>).
3. Combining Diagrams
Use a combination of sequence diagrams and state diagrams. Use sequence diagrams for flow and state diagrams for object behavior logic.
Maintaining Your Diagrams 🔄
Diagrams decay over time. To keep them valuable, treat them as living documents.
- Version Control: Store your diagram files in the same repository as your code.
- Review Process: Include diagrams in code reviews to ensure alignment between design and implementation.
- Automated Checks: If your tool supports it, use scripts to check for diagram consistency against code.
- Remove Dead Diagrams: If a feature is removed, archive or delete the associated sequence diagram to reduce clutter.
Wrapping Up 🏁
Creating a sequence diagram is a skill that improves with practice. Start with simple interactions and gradually add complexity. Remember that the goal is communication, not perfection.
By following the steps outlined here, you can effectively model system behavior without getting bogged down in tool specifics. Focus on the logic, the flow, and the interactions. This approach ensures your diagrams remain useful regardless of the software you choose to use.
Take your first diagram now. Identify a simple feature in your current project and map out the flow. You will quickly find that visualizing the interaction makes the code much easier to understand and maintain.
Happy modeling! 🚀

