


Sequence diagrams are a cornerstone of Unified Modeling Language (UML) within the software engineering discipline. They provide a dynamic view of system behavior by illustrating how objects interact over time. For computer science undergraduates, mastering this notation is not merely about drawing boxes and arrows; it is about understanding the flow of control and data between components in a distributed or object-oriented system. These diagrams serve as a blueprint for developers, allowing teams to visualize interactions before writing a single line of code.
Unlike static structure diagrams that focus on classes and attributes, sequence diagrams emphasize the temporal aspect of execution. They answer critical questions: What happens first? Which component responds to the initial request? How do errors propagate? By mapping these interactions, students can identify potential bottlenecks, logical gaps, or circular dependencies early in the design phase. This guide breaks down the syntax, semantics, and practical applications of sequence diagrams to build a solid foundation in system modeling.
🧩 Core Components of a Sequence Diagram
Before constructing a diagram, one must understand the building blocks. Each element carries specific meaning regarding the lifecycle of an object and its role in the interaction. A sequence diagram is essentially a timeline where the horizontal axis represents objects and the vertical axis represents time flowing downwards.
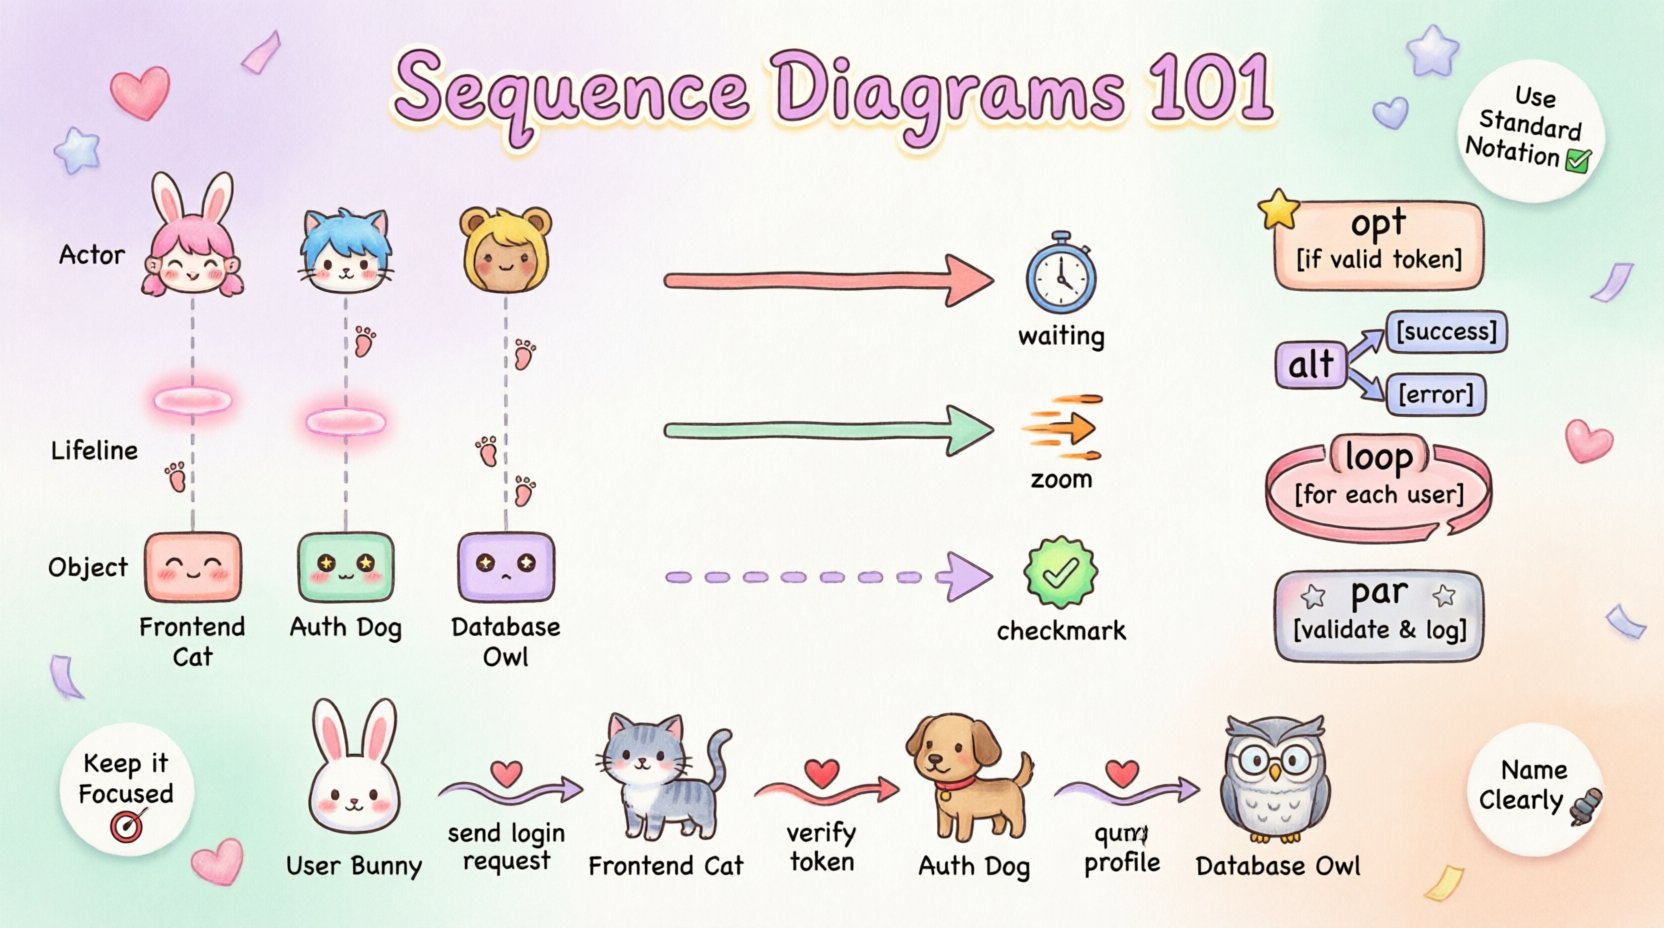
- Lifelines: Represented by a vertical dashed line extending from an object or actor. This line symbolizes the existence of the participant throughout the interaction. If a lifeline disappears, the object may be destroyed or go out of scope.
- Actors: Human users or external systems that initiate the interaction. These are typically placed at the top or left of the diagram.
- Objects: Instances of classes participating in the interaction. They are positioned horizontally across the top, aligned with their respective lifelines.
- Messages: Arrows connecting lifelines that indicate communication. The direction and style of the arrow denote the type of message sent.
- Activation Bars: Rectangular boxes placed on a lifeline. These indicate the period during which an object is performing an action or is actively executing a method.
Understanding the relationship between these components is vital. For instance, an activation bar only appears when a message is received and processing begins. It ends when the processing completes and a return message is sent, or when the object blocks waiting for another response.
📡 Message Types and Syntax
The arrows in a sequence diagram are not generic; they convey specific information about the nature of the communication. Using the correct arrow type ensures that the diagram accurately reflects the underlying code logic. Below is a detailed breakdown of standard message types.
1. Synchronous Messages
A synchronous message represents a blocking call. The sender waits for the receiver to complete the task before continuing its own execution. This is the most common type of interaction in object-oriented programming.
- Visual Notation: A solid line with a filled arrowhead.
- Behavior: The sender pauses execution at the point of the call.
- Use Case: Function calls where the result is immediately needed.
2. Asynchronous Messages
Asynchronous communication allows the sender to continue processing without waiting for the receiver. The message is sent, and the sender moves on to other tasks. The receiver processes the message at its own pace.
- Visual Notation: A solid line with an open arrowhead.
- Behavior: Non-blocking; the sender does not pause.
- Use Case: Event triggers, background tasks, or logging operations.
3. Return Messages
Every message typically requires a response, although not all diagrams explicitly show every return. This indicates the flow of data back to the caller.
- Visual Notation: A dashed line with an open arrowhead.
- Behavior: Indicates the completion of the operation and the return of a value or status.
- Use Case: Function return values or acknowledgment signals.
4. Self-Message
An object can interact with itself, often representing recursive calls or internal state changes.
- Visual Notation: A curved arrow starting and ending on the same lifeline.
- Behavior: Internal processing logic.
- Use Case: Looping structures or validation methods within a class.
🔀 Combined Fragments and Logic Control
Real-world software is rarely linear. It involves conditional logic, loops, and optional steps. UML provides “Combined Fragments” to model these control structures within a sequence diagram. These are enclosed in a frame with a specific label.
| Fragment Type | Label | Description | Use Case |
|---|---|---|---|
| Opt | opt | Optional interaction. The enclosed messages occur only if a specific condition is true. | A login attempt where the user must enter a password. |
| Alt | alt | Alternative interaction. Multiple conditions exist, and only one path is taken. | Handling different HTTP response codes (200 vs 404). |
| Loop | loop | Repeated interaction. Messages are executed multiple times based on a condition. | Iterating through a list of database records. |
| Break | break | Termination of a loop. The loop stops immediately if the condition is met. | Stopping a search when the target is found. |
| Par | par | Parallel interaction. Multiple messages occur simultaneously. | Concurrent requests to different servers. |
Detailed Look at Alt and Opt
The alt (alternative) fragment is crucial for representing decision-making. It allows the diagram to show distinct paths based on boolean conditions. For example, a system might process a payment differently if the user has sufficient funds versus if they do not. Each frame within an alt fragment is separated by a dashed line, and the condition for that frame is written in square brackets.
The opt (optional) fragment is simpler. It wraps a single block of interaction that happens only if a condition is met. If the condition fails, the enclosed messages are skipped entirely. This is often used for logging or secondary validation steps that are not critical to the primary flow.
⏱️ Timing Constraints and Activation
While sequence diagrams primarily show logical ordering, they can also express time constraints. This is particularly useful for real-time systems or performance-critical applications.
- Time Constraints: Written as a label on the message arrow, indicating the maximum time allowed for the operation (e.g., [timeout: 5s]).
- Duration Constraints: Specified on the activation bar to show how long a specific process takes.
- Delay: Represented by a gap on the lifeline where no messages are sent, indicating a wait state.
Activation bars provide visual clarity on when an object is busy. If an object receives a message and does not immediately return, its activation bar continues until the response is sent. This helps in identifying deadlock scenarios where an object waits indefinitely for a response that never arrives.
📝 Best Practices for Undergraduate Design
Creating a sequence diagram is an exercise in communication. A diagram that is too complex defeats its purpose. The following guidelines ensure clarity and maintainability.
1. Keep it Focused
Do not attempt to diagram the entire system in one view. Break down interactions into specific use cases. A single diagram should cover one specific scenario, such as “User Login” or “Process Payment.” This prevents the diagram from becoming cluttered and unreadable.
2. Name Objects Meaningfully
Avoid generic names like “Object1” or “System.” Use domain-specific terms that reflect the class names in the codebase. For example, use AuthService instead of AuthManager if the codebase uses that convention. This bridges the gap between the design model and the implementation.
3. Maintain Vertical Alignment
Ensure that return messages align vertically with their corresponding calls where possible. This visual alignment helps the reader trace the flow of execution quickly. Misaligned arrows can create confusion regarding which response belongs to which request.
4. Limit Depth
While deep nesting of combined fragments is possible, it reduces readability. If a diagram requires five levels of nested loops or conditionals, consider splitting the logic into separate diagrams or describing it in accompanying text documentation.
5. Use Standard Notation
Stick to the standard UML 2.5 specifications. Deviating from standard arrow types or frame labels can confuse peers or instructors who expect conventional representations.
❌ Common Pitfalls to Avoid
Even experienced developers make mistakes when modeling interactions. Being aware of common errors helps in producing cleaner diagrams.
- Ignoring Return Messages: While not mandatory in every case, omitting return messages can make the diagram look incomplete. It is best practice to show the return flow to demonstrate successful completion.
- Overloading Lifelines: Do not place too many objects on the horizontal axis. If there are more than 10 participants, consider grouping them or using a different diagram type, such as a Communication Diagram.
- Confusing Async and Sync: Using a solid arrow for an asynchronous call is a common error. Remember: Solid = Wait (Sync), Open = Don’t Wait (Async).
- Missing Destruction: If an object is no longer needed after a certain point, indicate its destruction with a large ‘X’ at the bottom of the lifeline. This shows resource cleanup.
- Too Much Detail: Do not include every variable assignment or internal method call. Focus on the interface interactions between objects, not the internal implementation details.
🔗 Integration into the Software Development Life Cycle
Sequence diagrams are not isolated artifacts; they fit into the broader context of the Software Development Life Cycle (SDLC). Understanding where they belong helps in leveraging their full potential.
1. Requirements Analysis
During the requirements phase, sequence diagrams help stakeholders visualize the expected behavior of the system. They translate textual requirements into a visual format, making it easier to spot missing logic or misunderstood flows.
2. Design Phase
Architects and lead developers use these diagrams to define the interaction contracts between modules. They serve as a guide for developers implementing the actual code, ensuring that the API calls match the design intent.
3. Testing Phase
Testers can use sequence diagrams to derive test cases. Each message exchange represents a potential test scenario. If the diagram shows an error path (via an alt fragment), testers should create specific unit tests to verify that path is handled correctly.
4. Maintenance
When updating legacy systems, sequence diagrams provide a map of existing interactions. They help developers understand the impact of changing one class on others without having to read through the entire codebase immediately.
🧪 Example Scenario: User Authentication
To illustrate these concepts, consider a standard authentication flow. The following steps outline the interaction between a User, a Frontend Controller, and an Authentication Service.
- User enters credentials and clicks “Login”.
- Frontend Controller sends a synchronous request to Authentication Service to verify credentials.
- Authentication Service queries the Database for the user record.
- Database returns the user data to Authentication Service.
- Authentication Service validates the password hash.
- If valid, Authentication Service sends a token back to Frontend Controller.
- Frontend Controller updates the session and redirects the user.
In this scenario, the diagram would show a vertical flow of messages. The database interaction might be enclosed in a opt fragment if the user is allowed to proceed without a database check (e.g., cached credentials), though this is less common for security reasons. The activation bars would highlight the processing time at the Authentication Service layer.
🎓 Why This Matters for Your Career
Proficiency in sequence diagrams distinguishes a competent engineer from a novice. In technical interviews, candidates who can sketch a clear interaction model demonstrate an understanding of system architecture. In the workplace, these diagrams facilitate communication between different teams, such as frontend and backend developers, ensuring everyone agrees on how data flows.
Furthermore, this skill extends beyond just drawing. It forces you to think about edge cases, error handling, and the lifecycle of objects. When you design a sequence diagram, you are essentially writing the pseudocode for your system’s behavior. This mental model is transferable to any programming language or framework you encounter later in your career.
🛠️ Final Thoughts on Modeling
The goal of a sequence diagram is clarity. It should be self-explanatory to someone familiar with the domain. If a diagram requires extensive notes to be understood, it likely needs simplification. Focus on the “happy path” first, then add the exception handling and edge cases using combined fragments.
By adhering to standard syntax and focusing on the interaction logic rather than implementation details, you create a powerful tool for design and documentation. Regular practice in constructing these diagrams will deepen your understanding of object-oriented design principles and prepare you for complex software engineering challenges.

