

Understanding how software components interact is critical for building robust systems. A sequence diagram provides a visual map of these interactions, showing how objects or services communicate with one another over time. This guide breaks down the essential elements, symbols, and best practices you need to create clear, effective diagrams for your projects.
Why Use Sequence Diagrams? 🤔
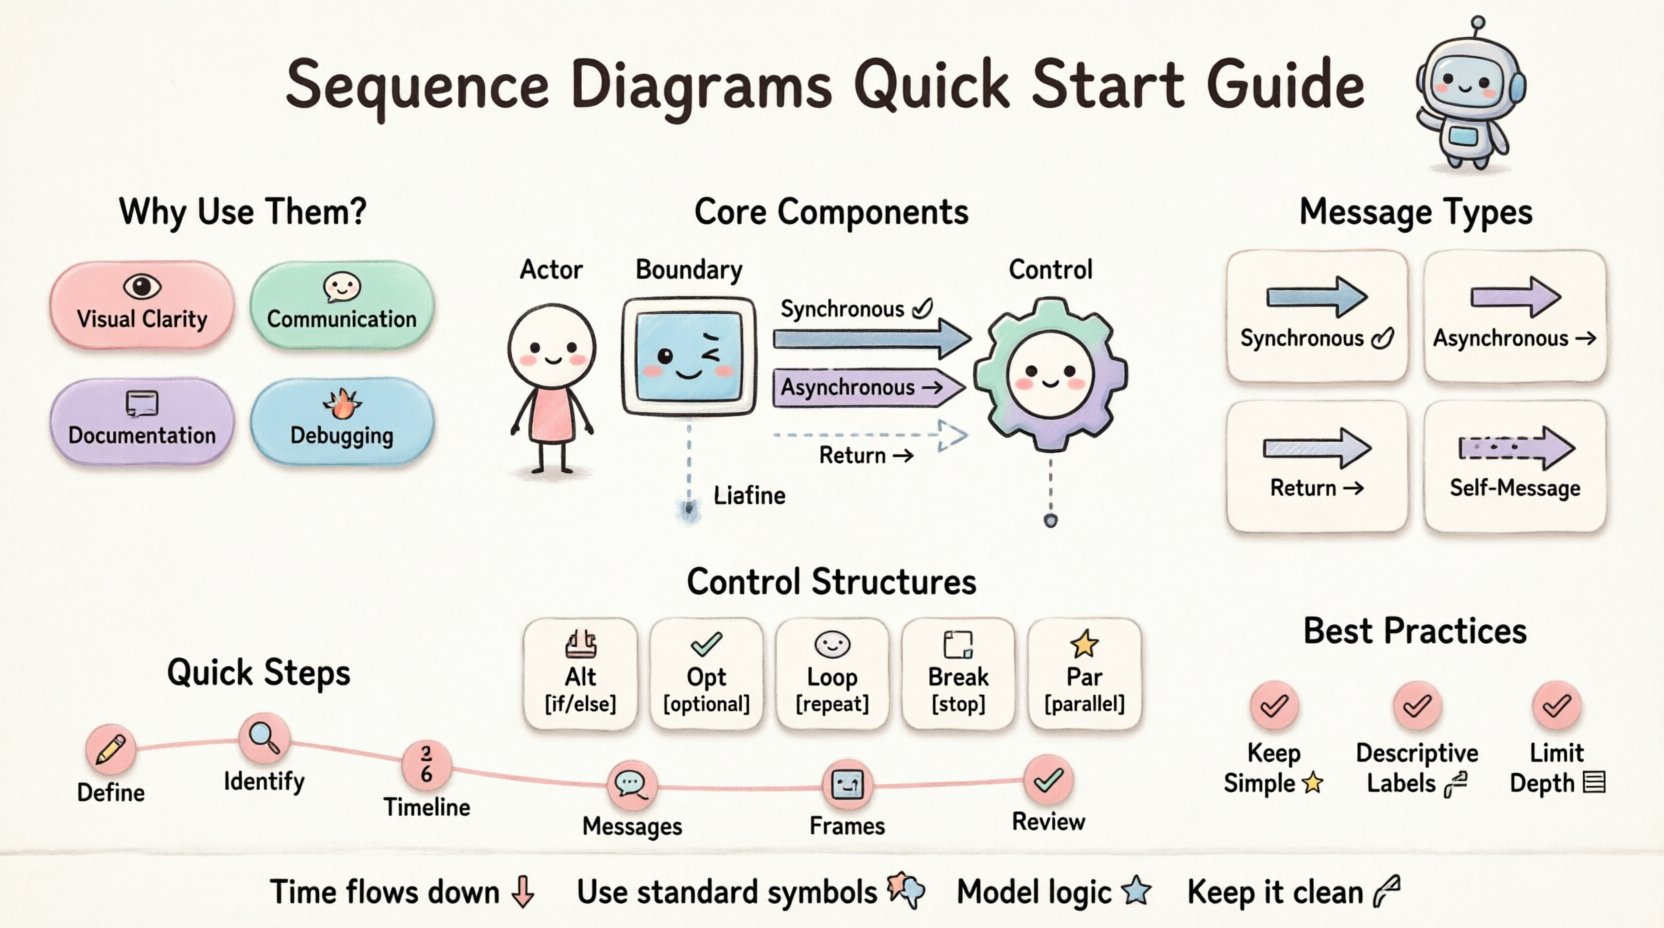
Before drawing lines and arrows, it helps to understand the value. In complex systems, text descriptions can become ambiguous. A sequence diagram clarifies the flow of logic, making it easier for team members to spot issues early.
- Visual Clarity: Seeing the timeline of events helps identify bottlenecks or circular dependencies.
- Communication: It serves as a common language between developers, designers, and stakeholders.
- Documentation: It acts as a living record of how the system behaves under specific scenarios.
- Debugging: When something breaks, the diagram helps trace the path of data flow.
Unlike class diagrams which show structure, sequence diagrams focus on behavior. They answer the question: “What happens when this action occurs?”
Core Components of a Sequence Diagram 🧱
Every diagram is built from a few fundamental building blocks. Mastering these symbols is the first step toward creating accurate models.
1. Participants (Lifelines) 📉
Participants represent the objects, classes, or external systems involved in the interaction. They are typically drawn as rectangles at the top of the diagram. A vertical dashed line extends downward from the rectangle. This line is called a lifeline and represents the existence of the participant throughout the timeline.
- Actor: A human user or external entity initiating the process. Often drawn as a stick figure.
- Boundary Object: Represents the interface between the user and the system (e.g., a login screen).
- Control Object: Handles the logic and coordination between boundary and entity objects.
- Entity Object: Represents persistent data or business rules.
2. Messages 💬
Messages are the arrows connecting lifelines. They represent communication or method calls. The direction of the arrow indicates who is sending the request and who is receiving it.
- Synchronous Message: The sender waits for a response before continuing. Drawn with a solid line and a filled arrowhead.
- Asynchronous Message: The sender does not wait for a response. Drawn with a solid line and an open arrowhead.
- Return Message: The response sent back to the caller. Drawn with a dashed line and an open arrowhead.
3. Activation Bars 🔋
When a participant is actively processing a message, a thin rectangle is drawn on their lifeline. This is called an activation bar. It indicates the period during which the object is executing code. It helps visualize the duration of operations.
Types of Messages Explained 📨
Different types of communication require different visual representations. Using the correct arrow type ensures your diagram conveys the exact timing and behavior.
| Message Type | Arrow Style | Behavior Description |
|---|---|---|
| Synchronous Call | Solid Line, Filled Arrowhead | Sender waits for the receiver to finish before proceeding. |
| Asynchronous Call | Solid Line, Open Arrowhead | Sender continues immediately without waiting for a reply. |
| Return Message | Dashed Line, Open Arrowhead | Receiver sends data or confirmation back to the sender. |
| Self-Message | Curved Arrow | An object calls a method on itself. |
Control Structures for Logic Flow 🔄
Real-world logic is rarely a straight line. It involves conditions, loops, and optional steps. Sequence diagrams use specific frames to represent these control structures.
1. Alt (Alternative) Frame ⚖️
Use this when there are multiple possible paths based on a condition. Think of it as an if/else statement. The frame is divided into sections labeled opt or alt, each containing a guard condition in brackets.
- Example: If the user is logged in, show the dashboard. Otherwise, show the login screen.
- Visual: A box with a label like
[user is authenticated].
2. Opt (Optional) Frame ✅
This represents a step that may or may not occur. It is similar to alt but implies that the main flow continues regardless, just skipping this optional part.
- Example: A “Remember Me” checkbox during login.
- Visual: A box labeled
[remember me checked].
3. Loop Frame 🔁
Use this for iterative processes. It represents a for or while loop. The frame surrounds the messages that repeat.
- Example: Processing a list of 100 items.
- Visual: A box labeled
loop {index < 100}.
4. Break Frame 🛑
This indicates a specific condition where the loop is terminated early. It is often used inside a Loop frame.
- Example: Stop processing if an error is found.
- Visual: A box labeled
break {error found}.
5. Par (Parallel) Frame ⚡
This shows that multiple lifelines are executing actions at the same time. It is useful for showing concurrent processes, such as sending an email and logging an event simultaneously.
- Example: Saving data to the database and sending a notification.
- Visual: A box labeled
parcontaining multiple independent flows.
Step-by-Step Construction Guide 🛠️
Creating a diagram requires a methodical approach. Follow these steps to ensure accuracy and clarity.
- Define the Scenario: Identify the specific use case you are modeling. Start with a single, clear trigger event.
- Identify Participants: List all objects or systems involved. Place them horizontally across the top.
- Draw the Timeline: Ensure the vertical axis represents time moving downwards. The earliest events are at the top.
- Add Messages: Draw arrows between lifelines in the order they occur.
- Insert Control Frames: Add
alt,loop, oroptframes where logic branches occur. - Review for Completeness: Ensure every path has a return message and that the system state is consistent.
Best Practices for Readability 📝
A diagram is useless if no one can understand it. Keep these principles in mind to maintain high quality.
- Keep it Simple: Avoid cramming too much logic into one diagram. Split complex flows into multiple diagrams (e.g., one for success, one for error).
- Use Descriptive Labels: Don’t just write
send(). WritesendLoginRequest(user, password). - Consistent Naming: Use the same naming convention for participants across all diagrams in the project.
- Limit Depth: If a diagram spans more than 3-4 screens vertically, it is likely too complex. Break it down.
- Focus on Interaction: Do not include attributes or data storage details unless they directly impact the flow.
- Time Alignment: Ensure messages are drawn at the correct vertical position to reflect the sequence of events.
Common Mistakes to Avoid 🚫
Even experienced developers make errors when modeling. Watch out for these pitfalls.
- Crossing Lines: Try to arrange participants so arrows do not cross excessively. This reduces visual clutter.
- Missing Return Messages: Every request should ideally have a response, even if it is an acknowledgment.
- Ignoring Error Flows: Only drawing the happy path gives a false sense of security. Model what happens when things fail.
- Overusing Activation Bars: Only show activation when the object is actively doing work. Don’t fill the lifeline unnecessarily.
- Unclear Guard Conditions: If you use an
altframe, the conditions must be mutually exclusive and exhaustive.
Integrating Diagrams into Workflow 🔗
Sequence diagrams should not be created in isolation. They are part of a larger design process.
1. Design Phase
Create diagrams during the design phase to validate architecture. This helps catch logical errors before code is written. It reduces the cost of fixing bugs later.
2. Development Phase
Use diagrams as a reference while coding. If the code deviates from the design, update the diagram. This keeps documentation synchronized with reality.
3. Testing Phase
Developers can use diagrams to write integration tests. The sequence of messages defines the test scenarios.
4. Maintenance Phase
When onboarding new team members, sequence diagrams provide a quick overview of system behavior. They are invaluable for knowledge transfer.
Advanced Concepts 🎓
Once you are comfortable with the basics, consider these advanced techniques.
1. Fragments and Nested Frames
You can nest control structures. For example, a loop inside an alternative frame. This allows for highly detailed modeling of complex business rules.
2. Combined Fragments
Some modeling standards allow combining multiple control structures into a single frame using operators like and, or, or not. Use these sparingly to avoid confusion.
3. Timing Constraints
For real-time systems, you may need to specify time limits. You can annotate messages with time constraints (e.g., 100ms). This is crucial for performance-critical applications.
Summary of Key Takeaways 🎯
Sequence diagrams are a powerful tool for visualizing system interactions. They provide a timeline-based view of how objects communicate, making complex logic easier to understand.
- Start with Participants: Define who is involved.
- Order Matters: Time flows downwards.
- Use Standard Symbols: Solid lines for calls, dashed for returns.
- Model Logic: Use frames for conditions and loops.
- Keep it Clean: Avoid clutter and crossing lines.
- Iterate: Update diagrams as the system evolves.
By mastering these techniques, you enhance your ability to design systems that are reliable and maintainable. Focus on clarity and accuracy, and your diagrams will become an essential asset in your development toolkit.
Remember, the goal is communication. A diagram that is easy to read is better than a diagram that is technically perfect but impossible to understand. Take the time to refine your skills, and you will find that visualizing interactions becomes second nature.

