


Unified Modeling Language (UML) provides a standardized way to visualize, specify, construct, and document the artifacts of a software system. While the ecosystem of UML diagrams is vast, selecting the right notation for a specific design problem is critical. Among these, the Sequence Diagram is a cornerstone for understanding dynamic behavior. However, it is not a standalone solution. To design robust systems, one must understand when to deploy sequence diagrams versus other types like Class, Activity, or State diagrams.
This guide breaks down the distinctions between sequence diagrams and their counterparts. We will examine their structural differences, use cases, and how they complement each other in the software development lifecycle. By the end, you will have a clear framework for choosing the appropriate diagram for your technical documentation.
What Is a Sequence Diagram? 📊
A Sequence Diagram is an interaction diagram that details how operations are carried out. It captures the time-based order of interactions between objects or participants. Unlike structural diagrams that show static relationships, sequence diagrams focus on the dynamic flow of messages.
Key components include:
- Lifelines: Vertical dashed lines representing objects or system entities over time.
- Messages: Arrows indicating calls, returns, or signals between lifelines.
- Activation Bars: Rectangles on lifelines showing when an object is active or executing an operation.
- Combined Fragments: Boxes indicating loops, choices, or parallel processes (e.g.,
opt,loop,alt).
The primary value of this diagram lies in its ability to show the chronology of events. It answers the question: “What happens first, and what triggers the next step?”
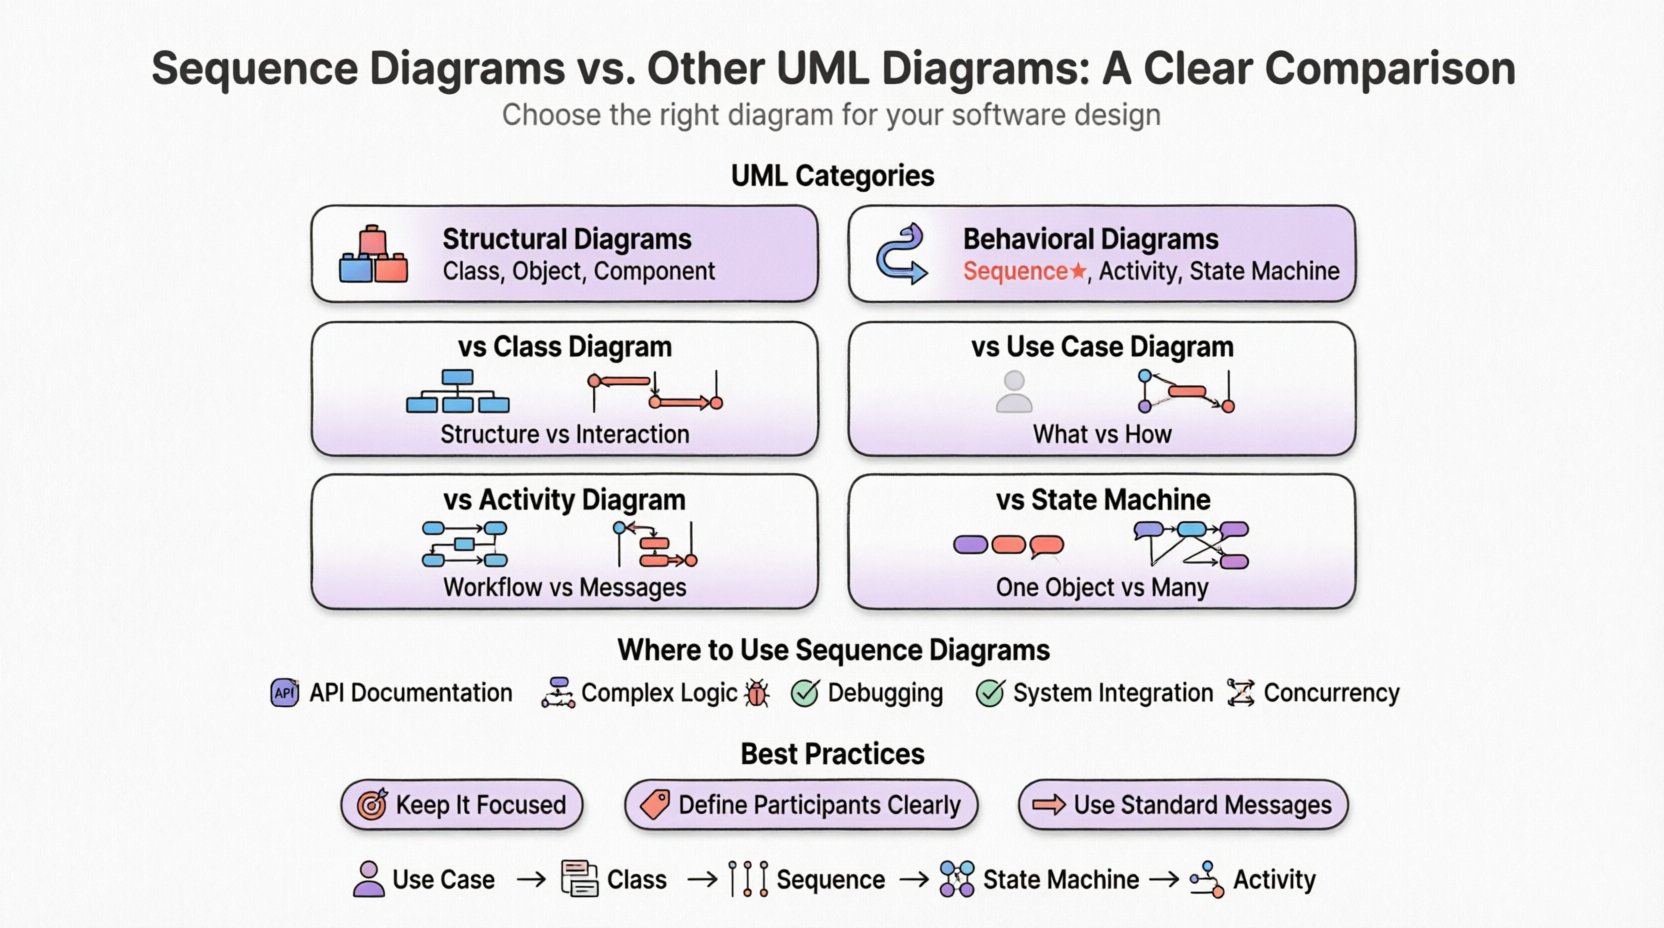
The Landscape of UML Diagrams 🗺️
UML is generally categorized into two main groups:
- Structural Diagrams: Describe the static part of the system (e.g., Class, Object, Component diagrams).
- Behavioral Diagrams: Describe the dynamic part of the system (e.g., Sequence, Activity, State Machine diagrams).
A Sequence Diagram belongs to the Behavioral category. To compare it effectively, we must look at other diagrams within both categories.
Sequence Diagram vs. Class Diagram 🆚
The most common comparison is between the Sequence Diagram and the Class Diagram. These two serve fundamentally different purposes. One describes the structure, and the other describes the interaction.
Structural Focus: Class Diagram
The Class Diagram is the backbone of object-oriented design. It maps out the classes, their attributes, operations, and the relationships between them. Relationships include associations, aggregations, compositions, and inheritance.
- Static View: It shows the system as it exists at a single point in time.
- Relationships: It defines how objects relate to each other (e.g., a
Customerhas aShoppingCart). - Responsibilities: It lists what data a class holds and what functions it provides.
Dynamic Focus: Sequence Diagram
The Sequence Diagram zooms in on a specific scenario. It does not list all attributes of a class but shows how instances of those classes communicate to achieve a goal.
- Temporal View: It shows events flowing from top to bottom based on time.
- Control Flow: It highlights the order of method calls and return values.
- Scenario Specific: It often depicts a single use case or a specific user journey.
Comparison Table: Class vs. Sequence
| Feature | Class Diagram | Sequence Diagram |
|---|---|---|
| Primary Focus | Static Structure | Dynamic Interaction |
| Time Dimension | None | Explicit (Top to Bottom) |
| Scope | Entire System Architecture | Specific Scenario or Use Case |
| Relationships | Inheritance, Association, Aggregation | Message Passing, Calls |
| Best Used For | Database Schema, API Contracts | API Flow, User Journey Logic |
In practice, you often design the Class Diagram first to establish the data model. Once the classes are defined, you use Sequence Diagrams to flesh out the logic of how those classes collaborate. If a Class Diagram shows a PaymentProcessor class, the Sequence Diagram shows the exact steps taken when a user clicks “Pay”.
Sequence Diagram vs. Use Case Diagram 🎭
Use Case Diagrams are often the first diagram created during requirements gathering. They define the scope of the system from the perspective of the user (actor).
High-Level Interaction: Use Case
- Actor-Centric: Focuses on external actors (users, other systems) and what they want to achieve.
- Functional Requirements: Lists features without detailing implementation.
- Simple Relationships: Uses associations and includes/extends relationships between actors and use cases.
Detailed Interaction: Sequence
- System-Centric: Focuses on internal components and their lifelines.
- Logic Flow: Details the steps required to fulfill a use case.
- Complex Logic: Handles loops, error handling, and conditional branches.
Think of the Use Case Diagram as a table of contents and the Sequence Diagram as the chapter content. The Use Case Diagram tells you that a user can “Process Order.” The Sequence Diagram tells you how the system validates the credit card, checks inventory, and updates the database to complete that order.
Sequence Diagram vs. Activity Diagram 🏃
Both Sequence and Activity diagrams are behavioral. However, they approach workflow differently. The Activity Diagram is often compared to a flowchart.
Workflow Logic: Activity Diagram
- Focus: Focuses on the flow of control and data within a process.
- Structure: Uses nodes (actions, decisions) connected by edges.
- Parallelism: Excellent at showing concurrent threads or parallel processes (Fork/Join nodes).
- Workflow: Ideal for business processes or complex algorithmic logic that spans multiple classes.
Message Logic: Sequence Diagram
- Focus: Focuses on the interaction between objects.
- Structure: Vertical time axis with horizontal message arrows.
- Timing: Explicitly shows the order of messages and response times.
- Collaboration: Better at showing which specific object handles a specific step.
When to Choose Which?
If you need to describe a business process involving multiple departments, an Activity Diagram is often clearer. It shows the handoffs and decision points without getting bogged down in object specifics. If you are designing an API endpoint or a microservice interaction, a Sequence Diagram is superior because it maps directly to code methods and API calls.
Sequence Diagram vs. State Machine Diagram ⏳
State Machine Diagrams describe the behavior of a single object or system over its lifecycle. Sequence Diagrams describe the behavior of multiple objects over time.
Internal State: State Machine
- Object Lifecycle: Tracks the status of one entity (e.g., an Order:
New,Paid,Shipped,Cancelled). - Events: Transitions are triggered by specific events.
- Constraints: Defines valid states and invalid transitions.
External Interaction: Sequence
- System Behavior: Tracks the collective behavior of the system.
- Messages: Transitions are triggered by messages from other objects.
- Scope: Covers the entire interaction flow, not just one object’s state.
These two diagrams are highly complementary. A State Machine Diagram might define the lifecycle of an Order object. A Sequence Diagram might show how a UserController interacts with that Order object to create it. The State Diagram ensures the Order doesn’t move to Shipped before Paid. The Sequence Diagram ensures the UserController sends the correct data to the Order service.
When to Use Sequence Diagrams? 🤔
While Sequence Diagrams are powerful, they should not be used for everything. Here are specific scenarios where they shine:
- API Documentation: When defining request/response flows for developers.
- Complex Logic: When a feature involves multiple services or components communicating.
- Debugging: When tracing a specific bug that involves a sequence of events.
- System Integration: When mapping how third-party systems exchange data.
- Concurrency: When showing parallel processing steps (using combined fragments).
Conversely, avoid using Sequence Diagrams for:
- High-Level Requirements: Use Use Case Diagrams here.
- Database Schema: Use Class or Entity-Relationship diagrams here.
- Simple Scripts: If there is only one object involved, a Sequence Diagram is overkill.
Best Practices for Sequence Diagrams ✅
To maintain clarity and authority in your documentation, adhere to these guidelines:
1. Keep It Focused
Do not try to diagram the entire system in one image. Break complex flows into smaller, manageable scenarios. For example, have separate diagrams for “User Login,” “Password Reset,” and “Profile Update.” This reduces cognitive load for the reader.
2. Define Participants Clearly
Ensure every lifeline is labeled with the class name or system component. Avoid generic labels like “System” unless necessary. Be specific with terms like AuthService or DatabaseConnector.
3. Use Standard Messages
Use solid arrows for synchronous calls and dashed arrows for return messages. Use open arrows for signals. Maintain consistency so readers can instantly recognize the type of interaction.
4. Leverage Combined Fragments
Don’t clutter the diagram with text descriptions for loops or conditions. Use standard notation like opt (optional), loop, and alt (alternative). This keeps the visual representation clean and standard-compliant.
5. Limit Depth
A sequence diagram with more than 50 lifelines or 100 message arrows becomes unreadable. If you hit this limit, consider using a nested diagram or an Activity Diagram to abstract the complexity.
Common Pitfalls to Avoid ⚠️
Even experienced architects make mistakes when modeling interactions. Watch out for these common errors:
- Ignoring Error Handling: A sequence diagram that only shows the “Happy Path” is incomplete. Include failure messages or error return codes where appropriate.
- Mixing Responsibilities: Do not use a sequence diagram to define data structures. That belongs in a Class Diagram.
- Over-Engineering: Do not diagram every method call. Focus on the business logic flow. Internal method calls within a single class can often be omitted.
- Ignoring Timeouts: In distributed systems, message delays are real. If critical, annotate the diagram with expected timeouts or retries.
Integrating Diagrams for Success 🔗
The most effective design process uses these diagrams in tandem. A typical workflow might look like this:
- Use Case Diagram: Identify the goals of the system.
- Class Diagram: Define the data entities required to support those goals.
- Sequence Diagram: Map out the specific interactions to fulfill a use case.
- State Machine Diagram: Define the lifecycle of complex entities like Orders or Sessions.
- Activity Diagram: Refine complex business logic that spans multiple objects.
By treating these diagrams as different lenses for the same system, you ensure that both the structural integrity and the dynamic behavior are sound. This holistic approach reduces ambiguity during the development phase and provides a robust reference for future maintenance.
Final Thoughts on UML Selection 🧭
Choosing the right diagram is not about preference; it is about clarity. The Sequence Diagram is an indispensable tool for visualizing time and interaction. However, it is not a silver bullet. When paired with Class, Activity, and State diagrams, it becomes part of a comprehensive modeling strategy.
Remember that diagrams are communication tools. Their value is realized only when the team understands them. If a Sequence Diagram is too complex to read in five minutes, simplify it. If a Class Diagram lacks the necessary context, add a Sequence Diagram to illustrate the flow. The goal is consistent, clear, and accurate communication of the system’s design.
As you continue your work in system design, practice using these diagrams to tell the story of your software. Start with the structure, then animate it with interaction. This disciplined approach will lead to more maintainable code and fewer misunderstandings among stakeholders.
