


Understanding the flow of interactions within a complex software system is critical for architects, developers, and stakeholders. A sequence diagram provides a clear visual representation of how objects or components communicate over time. This guide breaks down the essential components, notation, and advanced techniques required to create effective diagrams that clarify system behavior without ambiguity.
🏗️ What is a Sequence Diagram?
A sequence diagram is a type of interaction diagram used in Unified Modeling Language (UML). It shows how objects interact with each other in a specific sequence. The horizontal axis represents different participants or objects, while the vertical axis represents time, flowing from top to bottom.
These diagrams are invaluable for:
- Visualizing the lifecycle of a specific feature or use case.
- Identifying potential bottlenecks in data flow.
- Documenting system behavior for future maintenance.
- Communicating technical logic to non-technical stakeholders.
Unlike static structure diagrams, sequence diagrams focus on dynamic behavior. They capture the messages exchanged between entities, the order of events, and the state changes that occur during a process.
🧩 Core Components of a Sequence Diagram
Before constructing a diagram, one must understand the fundamental building blocks. Each element serves a specific purpose in defining the interaction.
1. Participants and Lifelines
Participants represent the objects, classes, or systems involved in the interaction. They are depicted as rectangles at the top of the diagram. Below each rectangle is a vertical dashed line known as a lifeline.
- Actor: A human user or an external system initiating the interaction.
- Object: An instance of a class within the system.
- System: A boundary representing the entire application or service.
The lifeline indicates the existence of the participant over a period of time. If a lifeline is broken, it implies the participant is inactive or out of scope for that specific timeline.
2. Messages
Messages represent the communication between participants. They are drawn as horizontal arrows pointing from the sender to the receiver.
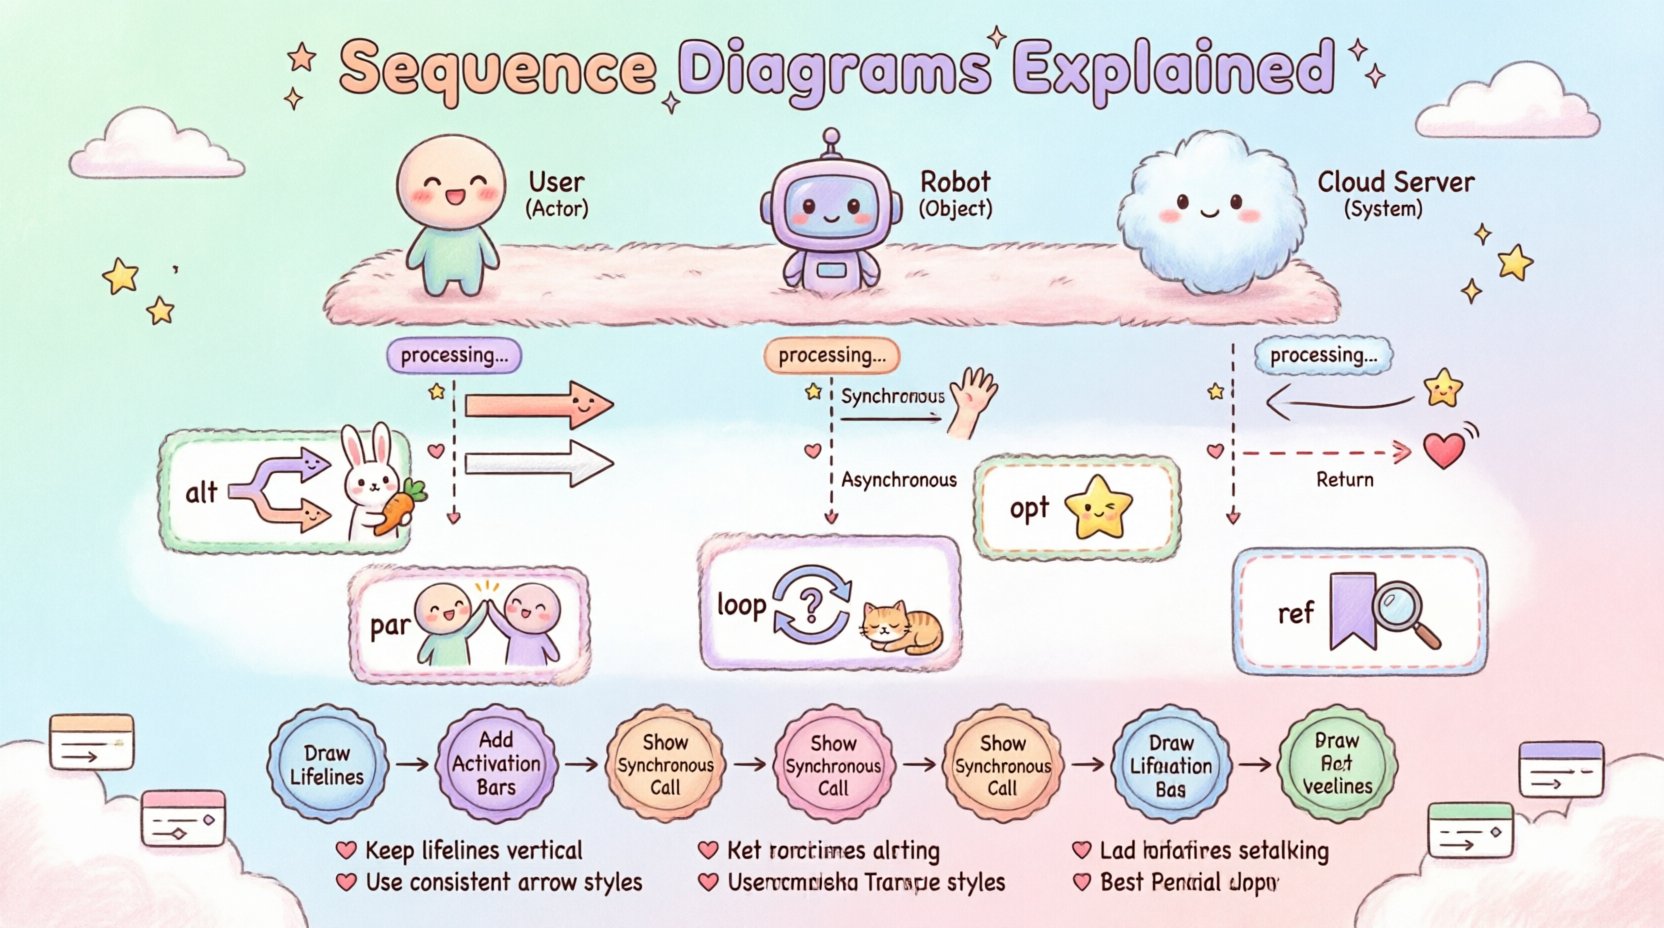
- Synchronous: The sender waits for a response before continuing. Shown with a solid line and a filled arrowhead.
- Asynchronous: The sender continues immediately without waiting. Shown with a solid line and an open arrowhead.
- Return: The response sent back to the sender. Shown with a dashed line and an open arrowhead.
3. Activation Bars
Activation bars are narrow rectangles placed on the lifeline. They indicate the period during which an object is performing an action or is actively executing a method. When an activation bar is visible, the object is processing information.
4. Frames and Regions
Frames are rectangles enclosing a set of messages. They are labeled with keywords like alt, opt, or loop. These frames define the logic controlling the flow of messages.
⚙️ Message Types and Notation
Choosing the correct arrow type is crucial for conveying the correct timing and dependency between system components. The following table summarizes the standard notations.
| Message Type | Arrow Style | Behavior | Example Usage |
|---|---|---|---|
| Synchronous Call | Solid Line, Filled Arrow | Caller waits for callee to finish | Requesting data from a database |
| Asynchronous Call | Solid Line, Open Arrow | Caller does not wait | Triggering a background task |
| Return Message | Dashed Line, Open Arrow | Callee returns control to caller | Returning a success status code |
| Create | Line with «create» label |
Instantiates a new object | Creating a new user session |
| Destroy | X mark on Lifeline | Removes the object | Closing a database connection |
🔧 Constructing the Diagram: A Step-by-Step Approach
Creating a clear diagram requires a structured approach. Follow these steps to ensure accuracy and readability.
- Define the Scope: Identify the specific use case or scenario you are modeling. Is it a login process? A payment transaction? A file upload?
- Identify Participants: List all actors and system components involved in this specific scenario.
- Determine the Entry Point: Decide which participant initiates the sequence. This is usually an actor or an external trigger.
- Map the Flow: Draw the primary path first (the happy path). Show the messages exchanged to achieve the goal.
- Add Error Handling: Include alternate paths for failures, such as invalid credentials or network timeouts.
- Refine Timing: Add activation bars to show when objects are busy. Ensure the vertical flow matches the logical order of events.
- Review and Validate: Check if the diagram accurately reflects the system logic. Ensure all messages have corresponding returns where necessary.
🚀 Advanced Patterns for Complex Logic
Real-world systems rarely follow a straight line. They involve loops, conditional logic, and parallel processes. Advanced patterns allow you to model these complexities within a single diagram.
1. Alt (Alternative) Fragment
The alt frame is used to represent conditional logic. It divides the diagram into multiple sections, where only one section is active based on a condition. Think of it as an if-else statement.
- Each section has a guard condition in brackets, e.g.,
[user is logged in]. - If the condition is true, the messages inside execute.
- If false, the system moves to the next section or exits.
2. Opt (Optional) Fragment
The opt frame indicates that a set of messages occurs only if a specific condition is met. If the condition is false, the messages are skipped entirely. This is useful for optional features or secondary steps.
3. Loop Fragment
The loop frame represents repetitive behavior. It is used when a message needs to be sent multiple times. You can specify the iteration count, such as [for each item] or [while condition].
- Common in list processing, file parsing, or retry mechanisms.
- Keeps the diagram clean by avoiding drawing the same message ten times.
4. Par (Parallel) Fragment
The par frame indicates that multiple messages are sent simultaneously. The vertical order between parallel sections does not matter. This is essential for modeling concurrent processes, such as sending an email and logging a transaction at the same time.
5. Ref (Reference) Fragment
The ref frame allows you to include a reference to another sequence diagram. This is helpful when a specific interaction is too complex to show in detail on the current page. It maintains the high-level view while allowing deep dives elsewhere.
📋 Comparison of Combined Fragments
Understanding when to use each combined fragment is key to diagram clarity. The table below compares their usage scenarios.
| Fragment | Keyword | Use Case | Visual Indicator |
|---|---|---|---|
| Alternative | alt | Conditional branching | Box with alt header |
| Optional | opt | Optional steps | Box with opt header |
| Loop | loop | Repetitive actions | Box with loop header |
| Parallel | par | Concurrent actions | Box with par header |
| Reference | ref | Link to another diagram | Box with ref header |
🛠️ Best Practices for Readability
A diagram that is difficult to read fails its purpose. Adhere to these guidelines to ensure your sequence diagrams are effective communication tools.
- Keep it Focused: Do not try to model the entire system in one diagram. Split large systems into logical flows.
- Use Descriptive Labels: Name your messages clearly. Instead of
msg1, useGetUserProfile. - Limit Width: Avoid having too many participants on a single line. Use frames to group related interactions.
- Consistent Naming: Use consistent terminology for participants and messages across all diagrams.
- Highlight Critical Paths: Use bold lines or different colors (if allowed) to emphasize the main success path.
- Avoid Overlap: Ensure activation bars do not overlap unnecessarily, as this can confuse the timeline.
⚠️ Common Pitfalls to Avoid
Even experienced practitioners can make mistakes that obscure the meaning of the diagram. Watch out for these common issues.
- Mixing Levels of Abstraction: Do not mix high-level business steps with low-level database queries on the same diagram unless necessary.
- Ignoring Timing: Ensure the vertical distance between messages roughly corresponds to the time taken, or at least maintains a logical flow.
- Too Many Participants: If you have more than 6 or 7 participants, consider splitting the diagram or using a different visualization type.
- Vague Conditions: Avoid guard conditions that are too broad. Be specific about when a branch is taken.
- Missing Returns: If a message is sent, a return message should generally be shown unless the flow clearly ends.
🔗 Integrating with System Design
Sequence diagrams do not exist in isolation. They are part of a broader system design documentation strategy.
1. Alignment with Use Cases
Each use case should ideally have a corresponding sequence diagram. This ensures that the functional requirements are mapped directly to technical interactions.
2. Relationship with Class Diagrams
Participants in a sequence diagram should correspond to classes in a class diagram. This ensures consistency between the static structure and the dynamic behavior of the system.
3. API Documentation
For microservices architectures, sequence diagrams are often used to document API contracts. They show exactly which endpoints are called and in what order, serving as a source of truth for integration teams.
📝 Summary of Key Takeaways
- Sequence diagrams visualize the dynamic interaction between system components over time.
- Core elements include lifelines, messages, activation bars, and frames.
- Advanced patterns like alt, loop, and par handle complex logic efficiently.
- Clear notation and consistent naming are essential for stakeholder understanding.
- These diagrams should align with use cases and class structures for a cohesive design.
By mastering these concepts, you can create diagrams that serve as powerful tools for design, documentation, and communication within any software development lifecycle. The ability to map out complex interactions clearly separates effective system design from confusion.

