


Visualizing how systems interact is a cornerstone of effective software design. When developers, architects, and stakeholders discuss complex flows of data, a static image often communicates more than pages of documentation. The sequence diagram stands out as one of the most powerful tools in the Unified Modeling Language (UML) toolkit. It captures the dynamic behavior of a system, focusing on the order of events and the exchange of information between different entities. This guide explores the mechanics, structure, and strategic application of these diagrams to help you build clearer, more maintainable architectures.
🤔 What Is a Sequence Diagram?
A sequence diagram is a type of interaction diagram. It shows how objects or parts of a system interact with one another over a period of time. The primary axis of this diagram is time, which flows from top to bottom. The horizontal axis represents the different participants, known as objects or actors, involved in the process. By mapping out interactions along this timeline, you can trace the lifecycle of a request from its origin to its final destination.
Unlike class diagrams that describe the static structure of code, sequence diagrams describe the dynamic behavior. They answer questions like:
- Who initiates the action?
- What happens next?
- How do components communicate?
- Are there any conditions or loops involved?
Understanding these interactions is critical for debugging logic errors, planning new features, and documenting existing systems. When a bug occurs in production, a well-drawn diagram can pinpoint exactly where the message flow diverged from the intended path.
🧩 Core Components Explained
Before constructing a diagram, you must understand the building blocks. Each symbol carries specific meaning that standardizes communication across teams. Skipping these definitions often leads to confusion and misinterpretation.
👤 Actors and Objects
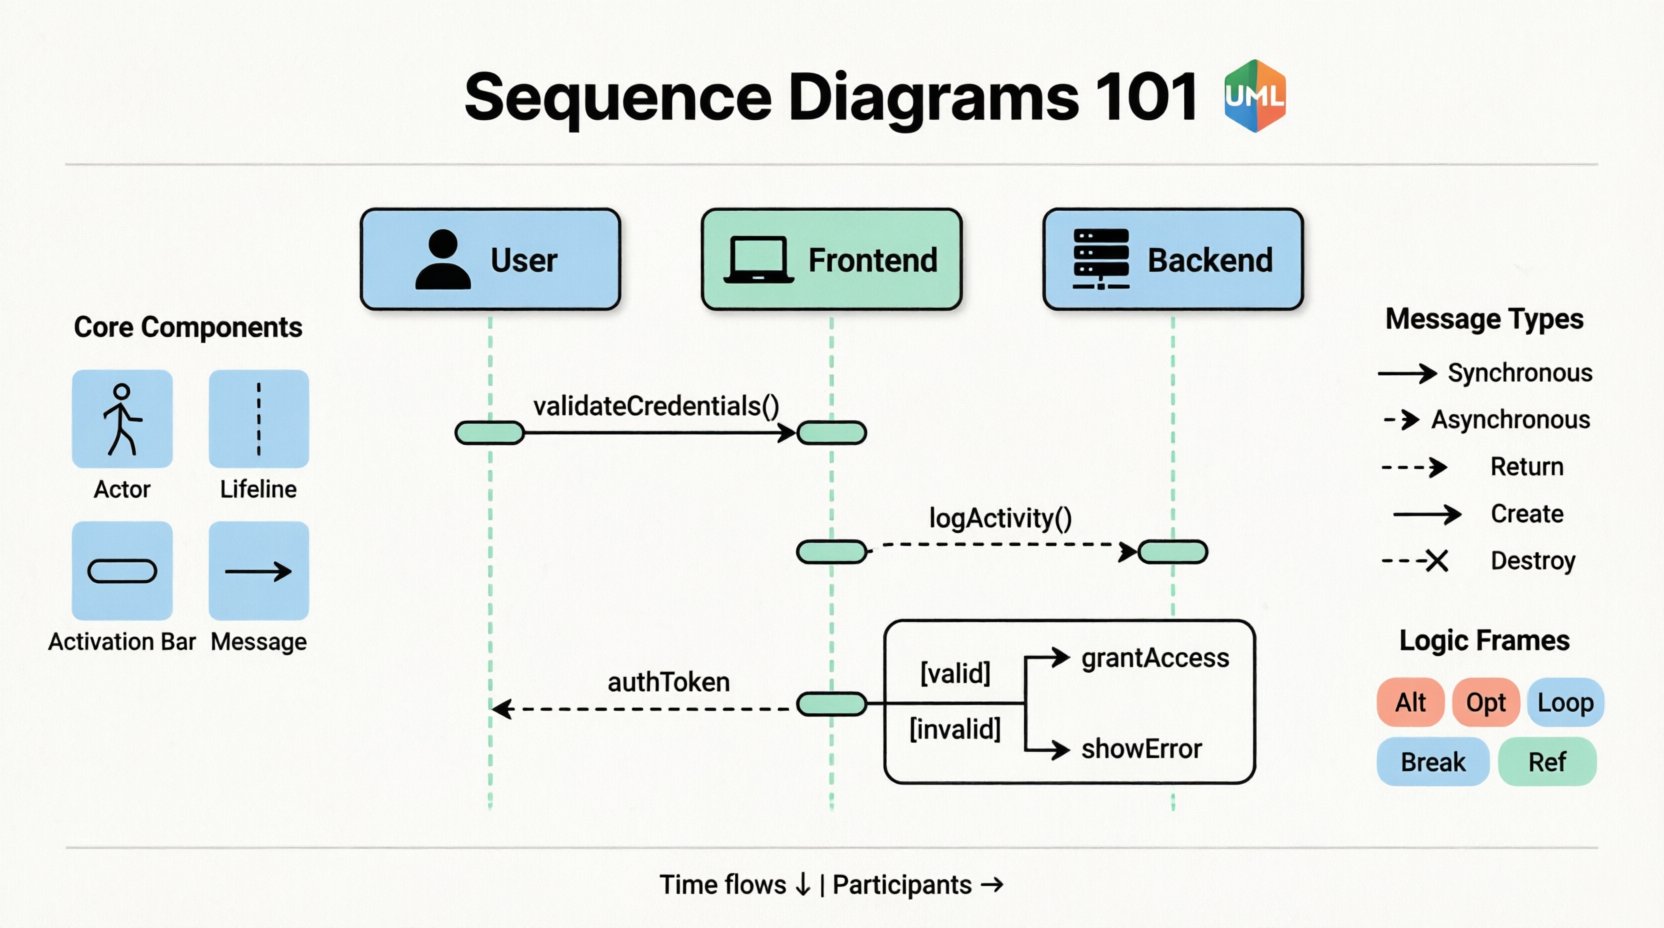
Participants are the entities that interact within the system. They are usually represented by icons or rectangles at the top of the diagram.
- Actors: External entities that initiate interactions. These can be human users, external systems, or hardware devices. They are often depicted with a stick figure icon or a distinct label.
- Objects: Instances of classes within the system. These represent the internal logic handling the request. They are usually labeled with the class name, sometimes including a specific instance name (e.g., OrderSystem:OrderManager).
📏 Lifelines
Extending downward from each participant is a vertical dashed line called a lifeline. This line represents the existence of the object over time. It indicates that the object is alive and capable of receiving messages during that period. If a lifeline ends, the object is destroyed or goes out of scope.
⚡ Activation Bars
When an object is performing an action or waiting for a response, a thin rectangular bar appears on its lifeline. This is the activation bar, or focus of control. It shows when the object is actively executing code. The length of the bar corresponds to the duration of the activity. A long bar might indicate a heavy computation or a wait for an external service.
📡 Messages
Messages are the arrows connecting lifelines. They represent the communication between participants. The direction of the arrow indicates the sender and receiver. The shape of the arrow tells you the type of interaction.
📡 Understanding Message Flows
The nature of the message defines how the system behaves. Different arrow styles denote different synchronization mechanisms. Confusing these can lead to race conditions or blocking issues in the actual code.
| Message Type | Arrow Style | Description |
|---|---|---|
| Synchronous | Filled Arrowhead | The sender waits for the receiver to finish processing before continuing. |
| Asynchronous | Open Arrowhead | The sender sends the message and continues without waiting for a response. |
| Return Message | Dashed Line, Open Arrowhead | The response path back to the sender. Often optional if not critical. |
| Create Object | Dashed Line, Solid Arrowhead | Indicates the creation of a new object instance. |
| Destroy Object | X on Lifeline | Indicates the destruction of an object instance. |
🔄 Synchronous vs. Asynchronous
Choosing between synchronous and asynchronous communication is a critical architectural decision. In a synchronous call, the thread executing the request is blocked until the response arrives. This is common in user interfaces where the user expects immediate feedback. However, it can slow down the system if the downstream service is slow.
Asynchronous communication allows the sender to proceed immediately. This is often used for background tasks, logging, or notifications. The diagram must clearly distinguish these to avoid developers assuming a response will be returned immediately.
🔄 Interaction Frames and Logic
Real-world systems are rarely linear. They involve conditions, loops, and optional steps. Sequence diagrams use frames to encapsulate these complex behaviors. A frame is a rectangle surrounding a group of messages with a label in the top-left corner.
📌 Common Frames
- Alt (Alternative): Represents conditional logic, like an
if-elsestatement. Only one path is taken based on a condition. The condition is written inside brackets. - Opt (Option): Similar to
Alt, but represents an optional step that may or may not occur. - Loop: Represents a loop structure, such as a
fororwhileloop. It indicates that the enclosed messages happen repeatedly. - Break: Indicates that the normal flow is interrupted by an exception or error condition.
- Ref (Reference): Refers to another sequence diagram. This helps manage complexity by breaking a large interaction into smaller, manageable diagrams.
🧱 Structuring Logic
Using frames correctly prevents the diagram from becoming a tangled mess. For example, if a payment processing step has multiple validation rules, use an Alt frame to show the different outcomes (Success vs. Decline) clearly. This keeps the main flow clean while documenting the edge cases.
🛠️ Constructing Your First Diagram
Creating a sequence diagram is an iterative process. It starts with identifying the primary use case and mapping the high-level flow before diving into details.
- Identify the Trigger: What starts the process? Is it a user clicking a button, an external API callback, or a scheduled task?
- List the Participants: Who is involved? Keep this list small. Too many participants make the diagram hard to read.
- Map the Happy Path: Draw the successful flow first. Connect the actors with the primary messages.
- Add Error Handling: Where can things go wrong? Add
Breakframes for exceptions and validation failures. - Refine Timing: Ensure the order of messages matches the logical execution flow. Time moves down the page.
- Review: Check for orphaned messages. Every message sent must have a receiver.
🚫 Common Pitfalls to Avoid
Even experienced designers make mistakes. Being aware of common errors helps maintain the integrity of your documentation.
- Overcrowding: Trying to put the entire system architecture into one diagram is a mistake. Break complex flows into multiple diagrams linked by
Ref. - Ambiguous Names: Use clear names for messages. Instead of processData, use validateUserCredentials. Specificity aids understanding.
- Ignoring Return Messages: While optional, omitting return messages can hide data flow issues. If the response carries critical data, draw it explicitly.
- Ignoring Object Creation: If an object is created mid-flow, show the creation message. This clarifies where the instance comes from.
- Vertical Spacing: Leave enough space between messages to allow for future additions. A cramped diagram is hard to modify later.
📊 When to Use This Tool
Not every problem requires a sequence diagram. They are best suited for scenarios involving time-sensitive interactions.
- API Design: Defining how frontend and backend services talk to each other.
- Workflow Documentation: Explaining the steps in a checkout process or login flow.
- Debugging: Tracing a specific error path through the system.
- Onboarding: Helping new team members understand how the system works.
For high-level system architecture, a component diagram might be better. For detailed database schema, a class diagram is preferred. Sequence diagrams sit in the middle, focusing on the conversation between parts.
🧠 Best Practices for Clarity
Clarity is the goal. If a stakeholder cannot read the diagram, it fails its purpose.
- Consistent Naming: Use the same terminology for objects and methods throughout the diagram.
- Group Related Steps: Use frames to group logic that belongs together, such as all authentication checks.
- Limit Width: Try to keep the number of participants manageable. If you have more than 6-8, consider splitting the diagram.
- Color Usage: While standard diagrams are black and white, using color sparingly can highlight critical paths or errors. Ensure accessibility for color-blind readers.
- Keep it Current: Diagrams rot. If the code changes, the diagram should change. An outdated diagram is worse than no diagram at all.
🔍 Analyzing Complex Scenarios
Complex systems often involve multiple threads or concurrent processes. Standard sequence diagrams represent a single thread of execution. To show concurrency, you can draw multiple lifelines for the same object, or use specific notations to indicate parallel processing. However, simplicity usually wins. If a scenario is too complex for a single diagram, it might need to be broken down into sub-processes.
Consider the flow of a data synchronization task. It involves fetching data, transforming it, and pushing it to a target. Each step might involve retries or timeouts. An Alt frame handles the retry logic, while a Loop frame handles the batch processing. Combining these correctly ensures the diagram reflects the robustness of the system.
📝 Summary of Key Takeaways
Mastering sequence diagrams requires practice and attention to detail. They are not just drawings; they are specifications of behavior. By adhering to standard notations, avoiding clutter, and focusing on the flow of messages, you create a valuable asset for your team. These diagrams bridge the gap between abstract requirements and concrete implementation.
Remember to:
- Start with the main actors and the trigger event.
- Use distinct arrow styles for synchronous and asynchronous calls.
- Leverage frames to handle logic like loops and conditions.
- Keep diagrams focused on a single concern.
- Update them as the system evolves.
With these principles in mind, you can create diagrams that serve as a reliable blueprint for development. They reduce ambiguity, align team understanding, and ultimately lead to more robust software systems.

