
Introduction
A flowchart is more than a collection of boxes and arrows—it is a thinking tool. By translating sequential logic into a visual language of terminators, processes, decisions, and data flows, flowcharts make complex procedures tangible, discussable, and improvable. Whether you are documenting a clinical workflow, designing an algorithm, or mapping a customer journey, the act of drawing forces clarity that prose alone rarely achieves.
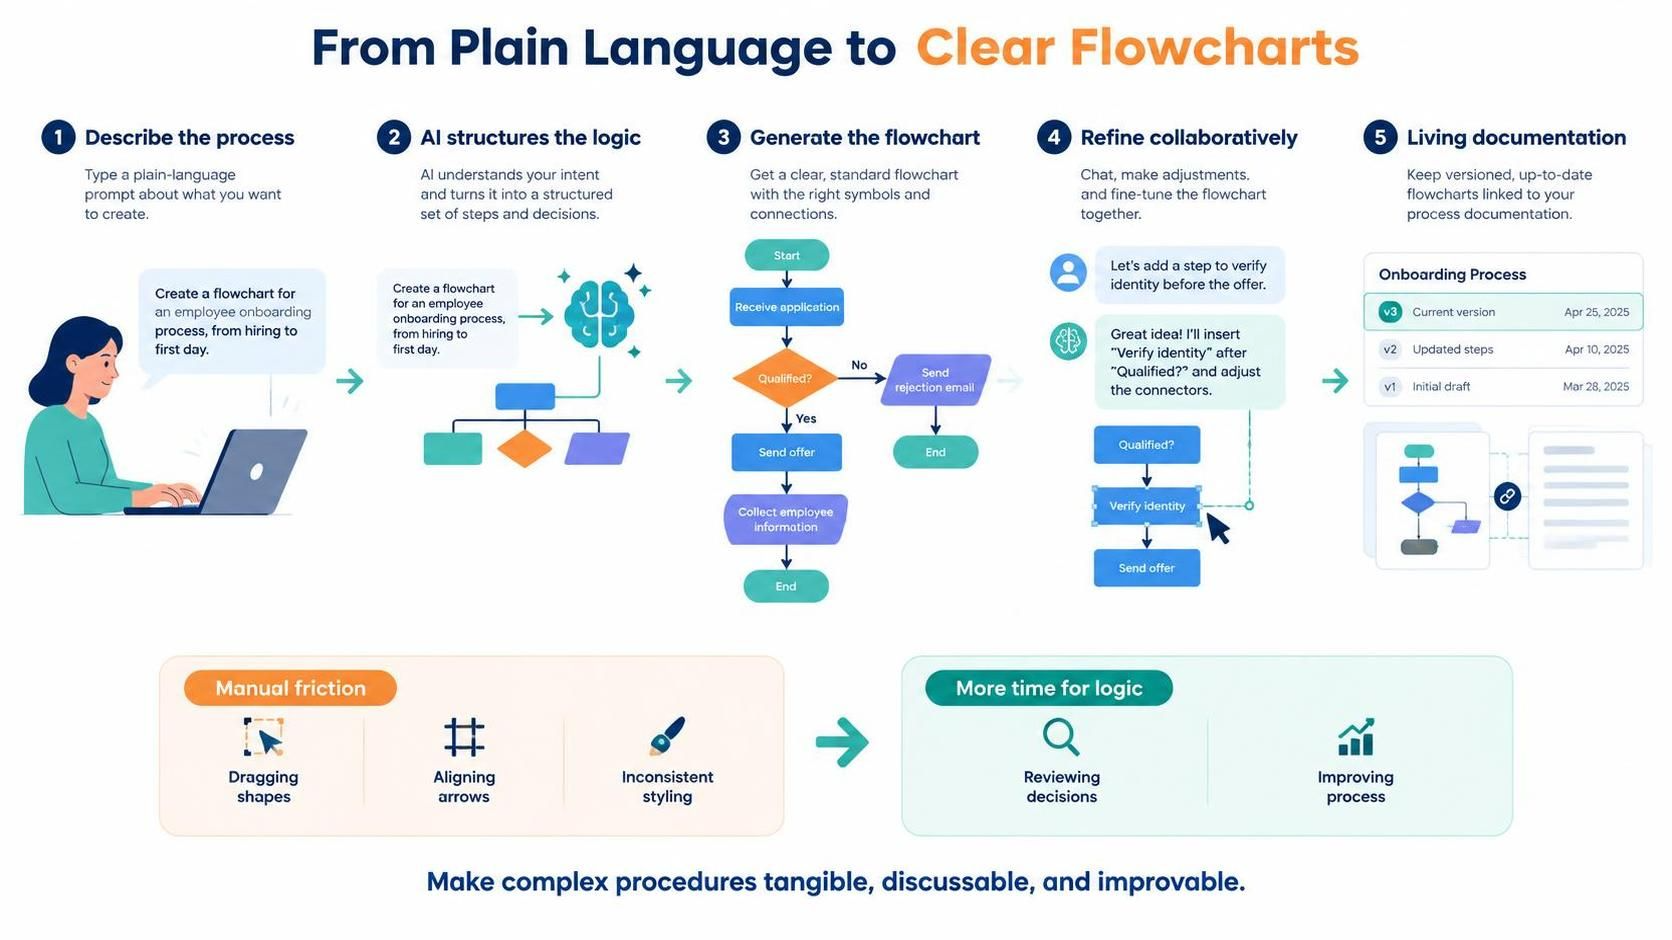
Yet traditional flowcharting has a friction problem: the mechanical work of dragging shapes, aligning connectors, and maintaining consistency often consumes the energy better spent on refining the logic itself. This is where AI-assisted diagramming changes the equation. Tools like Visual Paradigm now allow you to describe a process in plain language and receive a structured, standards-compliant flowchart in seconds—then refine it through conversation, code, or direct manipulation. This guide walks through that workflow, from first prompt to living documentation.
Key Concepts: The Building Blocks of Flowchart Logic
Before automation can be useful, the vocabulary must be clear. Flowcharts rely on a standardized set of symbols, each carrying a specific meaning that keeps diagrams unambiguous across teams and disciplines.
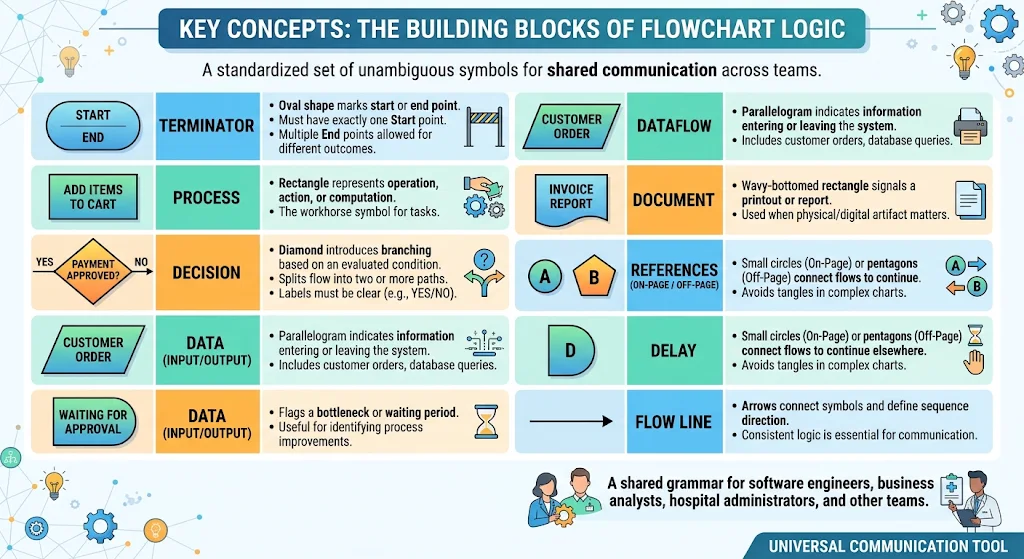
Terminator: The oval shape marks the start or end of a process. Every flowchart needs exactly one start point, though multiple end points are permissible when different outcomes terminate separately .
Process: The rectangle represents an operation, action, or computation—”Add items to Cart,” “Validate credentials,” or “Calculate total.” This is the workhorse symbol of any flowchart .
Decision: The diamond introduces branching. A condition is evaluated, and the flow splits into two or more paths based on the result. Well-designed flowcharts use decisions sparingly and label each outgoing path clearly (e.g., “Yes/No” or “Valid/Invalid”) .
Data (Input/Output): The parallelogram indicates information entering or leaving the system—a customer order, a database query, a printed report .
Document: A wavy-bottomed rectangle signals a printout or report, useful when the physical or digital artifact matters to the process.
On-Page and Off-Page References: Small circles or pentagons containing letters allow flows to continue elsewhere without a tangle of crossing lines—essential for complex, multi-page diagrams.
Delay: The half-circle (or “D” shape) flags a bottleneck or waiting period, a valuable symbol for process improvement discussions.
Flow Line: Arrows connect the symbols and define the direction of sequence. Without consistent arrow logic, a flowchart becomes a puzzle rather than a communication tool.
These symbols are not arbitrary decoration. They form a shared grammar that lets a hospital administrator, a software engineer, and a business analyst read the same diagram without translation.
The AI-Assisted Flowchart Workflow in Visual Paradigm
Step 1: Generate the Base Flowchart with AI
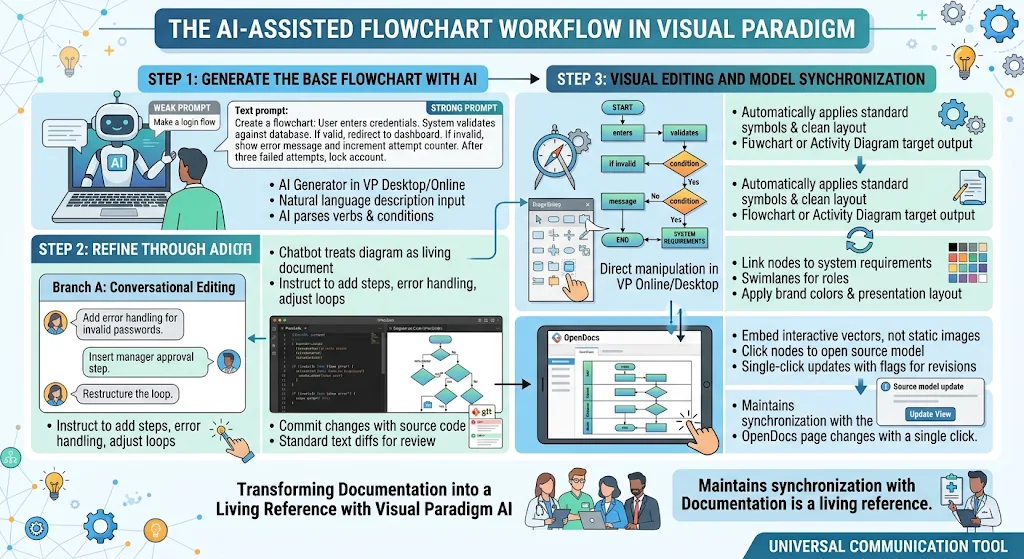
The entry point is the AI Visual Modeling Chatbot or the AI Diagram Generator within Visual Paradigm Desktop or Online. The process begins with a natural language description of your workflow. The more precise the prompt, the more accurate the initial output.
A weak prompt: “Make a flowchart for login.”
A stronger prompt: “Create a flowchart: User enters credentials. System validates against database. If valid, redirect to dashboard. If invalid, show error message and increment attempt counter. After three failed attempts, lock account.”
Visual Paradigm’s AI engine parses verbs as process steps (rectangles) and conditional phrases—”if,” “when,” “depending on”—as decision points (diamonds) . It automatically applies standard flowchart symbols and arranges the layout in a clean top-down or left-right flow, eliminating the manual alignment work that consumes the first 80% of traditional diagramming effort .
You can select Flowchart or Activity Diagram as the target output. The AI translates your prompt into a structured diagram, optionally using Diagram-as-Code syntax (PlantUML, Mermaid, Graphviz, or D2) behind the scenes.
Step 2: Refine Through Conversation or Code
The first draft is a starting point, not a finished product. Visual Paradigm offers two complementary refinement paths.
Conversational editing: The AI chatbot treats the diagram as a living document. You can ask it to “Add error handling for invalid passwords,” “Insert a manager approval step after the decision,” or “Restructure the loop so retry attempts are tracked.” Each instruction updates the model without manual redrawing .
Diagram-as-Code (VPasCode): For teams that prefer textual control or need Git-based versioning, VPasCode provides a dual-panel editor: code on the left, live preview on the right. You can edit PlantUML or Mermaid syntax directly, commit diagram changes alongside source code, and review differences through standard text diffs . This is particularly valuable when the flowchart must evolve with the system it documents.
Step 3: Visual Editing and Model Synchronization
When precision matters—ensuring every decision is a true diamond, every process a rectangle—push the generated model into Visual Paradigm Online or Desktop for direct manipulation. The drag-and-drop editor supports alignment guides, format copying, and a full suite of shape and connector options . For enterprise needs, VP Desktop allows you to tie flowchart nodes to system requirements, add swimlanes for organizational roles, and generate code stubs from process models.
This is also where you apply brand colors, adjust layout for presentation, and add annotations that clarify nuance the AI could not infer from the prompt.
Step 4: Publish as Living Documentation with OpenDocs
The final—and perhaps most transformative—step is embedding the flowchart in OpenDocs rather than exporting a static image. In OpenDocs, diagrams remain live, interactive vectors. Readers can click a node to open the source model. When the underlying flowchart changes, OpenDocs flags the revision, and authors can update the embedded view with a single click—no manual re-exporting, no version drift .
This transforms documentation from a graveyard of outdated screenshots into a living reference that stays synchronized with the actual process.
Examples: From Simple to Structured
Simple Algorithm: A flowchart for summing two numbers uses a terminator (“Start”), two data symbols (Input A, Input B), a process (Sum = A + B), a data symbol (Output Sum), and a terminator (“End”). The AI generates this instantly from a one-sentence prompt.
Decision-Heavy Process: A medical service flowchart branches on patient symptoms, insurance verification, and triage level. The decision diamonds multiply quickly, which is why the AI’s automatic layout and the human’s refinement of path labels (“Emergency → Immediate,” “Non-urgent → Schedule”) matter equally.
Business Workflow with Loops: An e-commerce checkout flow—add to cart, checkout, settle payment—includes a retry loop for failed payments. The AI infers the loop from a prompt like “If payment fails, allow up to three retries before canceling,” and VPasCode allows fine-tuning the exact loop structure.
Conclusion
Flowcharts succeed when they clarify rather than confuse. The traditional barrier—hours of mechanical shape placement—has largely fallen. With Visual Paradigm’s AI-assisted ecosystem, the workflow becomes: describe the logic, let the AI draft the structure, refine through conversation or code, polish visually, and publish as living documentation that updates with the model.
The result is not just faster diagramming. It is a shift in where human attention goes: away from connector alignment and toward the harder, more valuable work of getting the logic right.
Suggested Article Title
From Prompt to Process: AI-Assisted Flowcharting with Visual Paradigm
Reference List
-
How to Create Flowcharts with AI in Visual Paradigm Online OpenDocs: Demonstrates AI flowchart generation within OpenDocs, including reusable component pages and single-page insertion methods.
-
AI Flowchart Generator: Support Ticket Workflows: Step-by-step guide to generating a support ticket workflow from natural language, with screenshots of the AI dialog and resulting diagram.
-
AI Chatbot: A Comprehensive Guide to Visual Modeling: Explains conversational refinement of diagrams, including commands for adding elements, renaming, and restructuring flows.
-
Visual Paradigm Ecosystem Guide: Describes when to use VPasCode versus VP Desktop, covering Git-based version control and text-based diagram maintenance.
-
From Static Snapshots to Living Knowledge: OpenDocs and Visual Paradigm: Details how OpenDocs keeps embedded diagrams synchronized with source models, eliminating manual re-exporting.
-
VPasCode 60-Second Quickstart Guide: Hands-on walkthrough for creating diagrams from Mermaid or PlantUML syntax with live preview and SVG export.
-
How to Generate Flowcharts with AI in Visual Paradigm: Video overview of the AI generation process, from prompt input to refinement and export.
-
Free Flowchart Editor Online: Visual Paradigm Online’s flowchart tool page, covering drag-and-drop editing, templates, and collaboration features.