


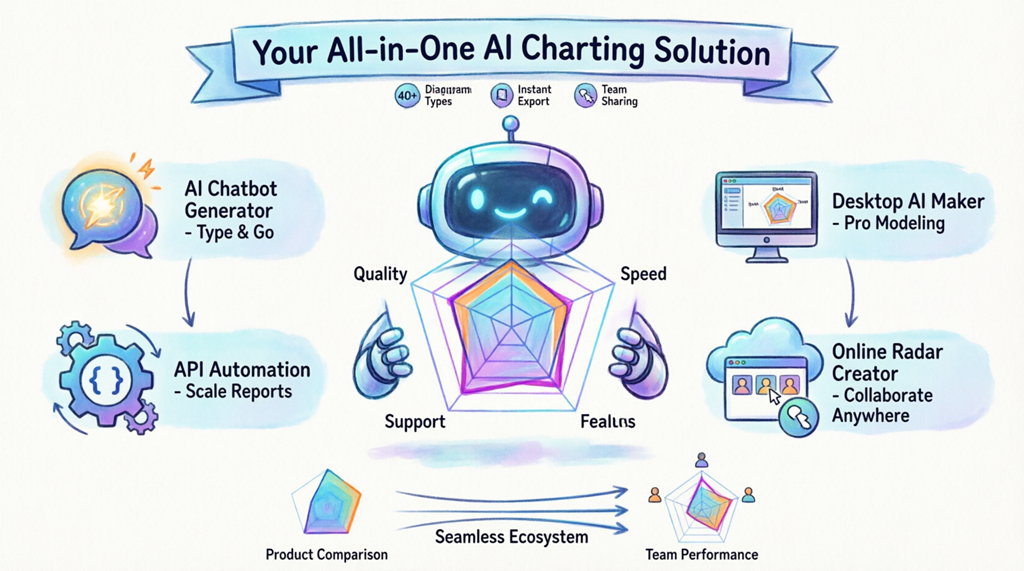
Why Choose an All-in-One AI Charting Platform?
Fragmented toolchains slow down decision-making. Switching between a simple chart maker for quick visuals and a complex modeling tool for detailed analysis creates friction, version conflicts, and wasted time. Visual Paradigm eliminates this by offering multiple AI radar chart generators within a unified environment. This means consistent styling, shared data sources, and seamless transitions from brainstorming to boardroom presentations. For teams evaluating AI charting solutions, this integrated approach delivers unmatched efficiency and professional results.
Tool 1: AI Chatbot Radar Chart Generator – Instant Visuals Through Conversation
Start with the fastest path to insight: the Visual Paradigm AI Chatbot. This conversational AI radar chart maker transforms natural language prompts into professional multi-axis visuals in seconds. Simply describe what you want to compare – “Create a radar chart comparing project management tools on ease of use, features, pricing, support, and integration capabilities” – and watch as the AI radar chart generator builds a balanced, presentation-ready polygon chart directly in your chat window.
Perfect for consultants, managers, and analysts who need rapid competitive analysis or performance evaluations without learning complex software. The AI radar chart tool understands context, infers appropriate scales, and highlights strengths and weaknesses visually. Plus, with session sharing, you can instantly collaborate with stakeholders via a unique link.

Learn how this AI-powered visual modeling hub supports frameworks like SWOT and PESTLE alongside radar charts, making it a versatile strategic analysis tool.
Tool 2: Desktop AI Diagram Generator – Professional-Grade Radar Chart Modeling
When your analysis demands precision and deep customization, the Visual Paradigm Desktop application provides a robust AI radar chart maker with advanced modeling capabilities. Access the dedicated AI Diagram Generation window, select Radar Chart, and provide a detailed comparison scenario. The AI radar chart generator intelligently parses your description, sets up perfectly scaled axes, and distinguishes multiple data series with clarity.
Unlike basic online chart makers, the desktop AI radar chart tool produces fully editable native diagrams. Adjust colors, modify axis labels, add annotations, or integrate the chart into larger models like SysML requirement diagrams or C4 architecture models. This flexibility makes it the preferred AI visual modeling tool for enterprise architects and technical leads.

The resulting spider chart isn’t just a static image—it’s a dynamic model ready for refinement. See how AI transforms a text description into a polished visual: 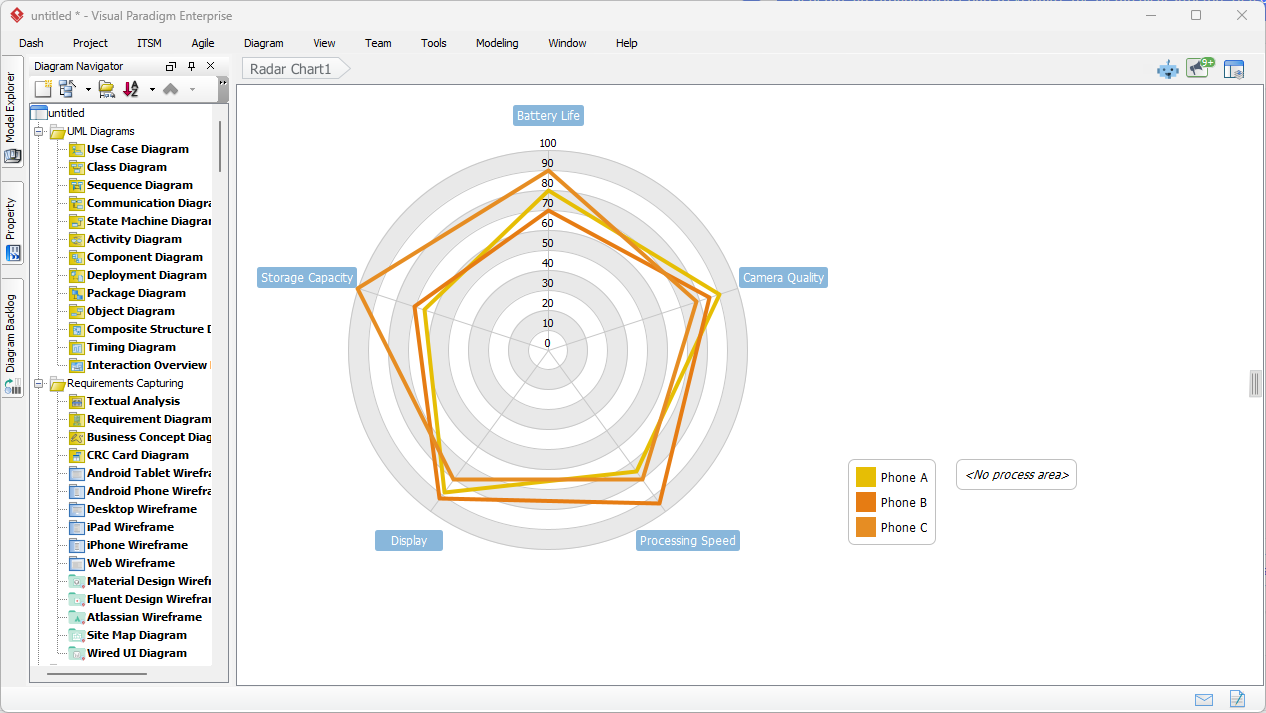
Tool 3: Online Radar Chart Maker – Web-Based Collaboration and Templates
For teams prioritizing accessibility and real-time collaboration, Visual Paradigm Online offers a powerful browser-based AI radar chart maker. Access a library of ready-to-use radar chart templates, including specialized views like the Multi-Attribute Brand Perceptual Map for marketing analysis. The interactive radar chart maker tool features real-time visualization and intuitive editing, perfect for cross-functional workshops or client presentations.
This AI charting solution integrates with the broader Visual Paradigm ecosystem, allowing you to start a chart online and continue advanced modeling in the desktop app. No installation required, yet professional results guaranteed.
Tool 4: API-Powered Radar Chart Creation – Automate at Scale
Developers and data engineers can leverage the Open API to programmatically generate radar charts. This AI radar chart generator endpoint accepts structured data and returns high-resolution visuals, enabling automated reporting pipelines, dashboard integrations, or custom application features. Combine this with the desktop or online tools for a complete AI-powered chart generation workflow that scales with your organization’s needs.
Beyond Radar Charts: 40+ AI-Accelerated Diagram Types in One Platform
True all-in-one AI charting solutions extend beyond a single chart type. Visual Paradigm’s AI diagram generator supports over 40 professional diagram types, including:
- Software Engineering: Generate UML Sequence, Activity, and Class diagrams by describing system logic
- Enterprise Architecture: Utilize 26+ ArchiMate Viewpoints to visualize business, application, and technology layers
- Project Management: Instantly build PERT charts, Org charts, and Work Breakdown Structures
- Strategy & Marketing: Apply Ansoff Matrix, McKinsey 7S, and Blue Ocean frameworks with AI assistance
This breadth makes Visual Paradigm the most versatile AI visual modeling tool available, eliminating the need to juggle multiple specialized applications.
Seamless Workflow: How Visual Paradigm’s Radar Chart Tools Work Together
Start with the AI Chatbot for rapid ideation, export to Desktop for detailed refinement, share via Online for team feedback, and automate recurring reports with the API. This integrated workflow ensures consistency across all stages of analysis. For example, a product team might:
- Use the AI Chatbot to quickly compare competitor features during a strategy meeting
- Export the chart to Desktop to add technical specifications and link to requirement models
- Share the interactive version via Online with marketing for messaging alignment
- Schedule monthly competitive updates using the API to auto-generate refreshed radar charts
This cohesion is what separates a true all-in-one AI charting solution from disconnected point tools.
Real-World Applications: Where Multi-Tool Radar Charts Deliver Value
Visual Paradigm’s flexible AI radar chart makers excel across industries:
- Competitive Intelligence: Compare products, services, or brands across multiple attributes using the competitive analysis guide methodology
- Team Performance Reviews: Evaluate employees or departments on skills, outcomes, and behaviors with customizable axes
- Product Development: Benchmark prototypes against requirements or user expectations
- Vendor Selection: Score potential partners on cost, reliability, support, and innovation
Explore deeper insights on unlocking insights with radar charts and how they reveal patterns in complex data.
Getting Started: Your Path to AI-Powered Radar Chart Mastery
Ready to experience the most comprehensive AI radar chart solution? Follow this quick start guide:
- Try the conversational approach: Launch the AI Chatbot and type your first radar chart request
- Explore professional modeling: Download Visual Paradigm Desktop to access advanced AI diagram generation
- Discover templates and collaboration: Visit the Interactive Radar Chart Maker for web-based creation
- Learn best practices: Review the AI Diagram Generator release notes and the comprehensive desktop tutorial
- Integrate with your stack: Check the Open API guide for automation possibilities
For ongoing learning, explore the AI Visual Modeling Hub and the dedicated radar chart tool features page.
Conclusion: The Smart Choice for Comprehensive AI Charting
When evaluating AI charting solutions, breadth, depth, and integration matter. Visual Paradigm stands apart by offering multiple specialized AI radar chart tools—chatbot, desktop, online, and API—within a single, cohesive platform. This all-in-one approach saves time, ensures consistency, and scales from quick sketches to enterprise-grade models. Stop compromising with single-purpose tools. Elevate your data visualization with the AI-powered ecosystem built for professionals who demand both speed and sophistication.
Start creating professional radar charts today:
- Launch Visual Paradigm AI Chatbot for instant conversational charting
- Get the Full AI Modeling Suite for desktop-powered analysis
- Explore the AI Visual Modeling Hub to see all capabilities

