When studying software design or system architecture, visualizing how different parts of a system communicate is essential. One of the most effective tools for this purpose is the sequence diagram. This diagram type focuses on the flow of messages between objects over time. It provides a clear, chronological view of interactions that occur during a specific use case.
For students entering the field of computer science, learning to interpret and create these diagrams is a fundamental skill. It bridges the gap between abstract requirements and concrete implementation. This guide breaks down the syntax, notation, and logic required to work with sequence diagrams effectively.
🔍 What is a Sequence Diagram?
A sequence diagram is a type of interaction diagram in the Unified Modeling Language (UML). Its primary purpose is to show how objects interact with each other in a specific scenario. Unlike class diagrams, which show static structure, sequence diagrams show dynamic behavior.
Key characteristics include:
- Time-based: Interactions are ordered from top to bottom, representing the passage of time.
- Object-focused: It highlights the specific instances (objects) involved in the process.
- Message-driven: The movement of data or commands is represented by arrows between objects.
Understanding the flow helps developers identify bottlenecks, logical errors, or missing dependencies before writing a single line of code. It serves as a blueprint for the system’s behavior.
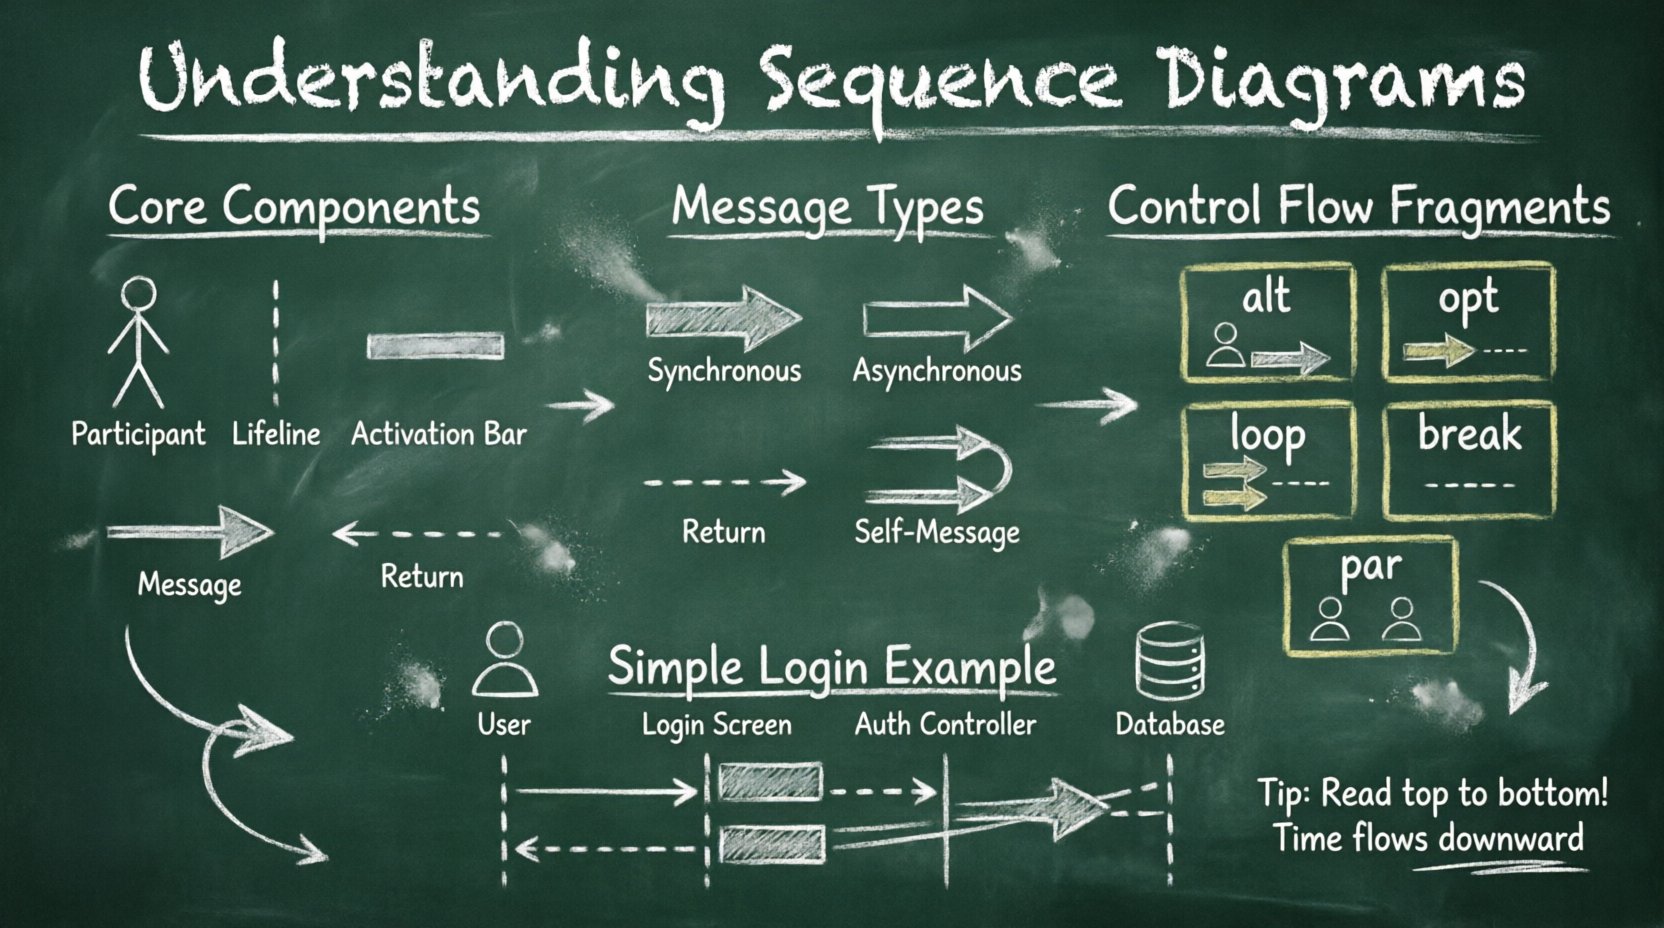
🏗️ Core Components of a Sequence Diagram
To read or draw a sequence diagram, you must understand its building blocks. Each symbol carries specific meaning regarding the lifecycle and behavior of the system elements.
| Component | Visual Representation | Purpose |
|---|---|---|
| Participant | Rectangle or Stick Figure | Represents an object, user, or system receiving or sending a message. |
| Lifeline | Vertical Dashed Line | Shows the existence of a participant over time. |
| Activation Bar | Thin Rectangle on Lifeline | Indicates when an object is performing an action or is active. |
| Message Arrow | Horizontal Arrow | Shows the flow of data or control between participants. |
| Return Message | Dashed Arrow | Indicates a response or return value from the receiver. |
1. Participants
Participants are the actors in your story. They can be:
- External Actors: Represented by a stick figure. These are users or other systems outside the main scope.
- Objects: Instances of classes within the system. They are named with a colon followed by the class name (e.g.,
Customer: UserAccount). - Boundaries: Interfaces through which the system is accessed.
- Control Objects: Logic handlers that coordinate between objects.
2. Lifelines
Every participant has a vertical lifeline extending downwards from their box. This line represents the participant’s presence in the system during the interaction. It does not necessarily mean the object exists forever, but it exists for the duration of the scenario being modeled.
3. Activation Bars
When a participant receives a message and begins processing, a thin, vertical rectangle appears on their lifeline. This is the activation bar. It signifies that the object is currently executing code. The bar ends when the object completes the action and returns control to the caller.
📬 Types of Messages
The arrows connecting lifelines are the most critical part of the diagram. They represent the communication. Different arrow styles denote different types of interactions.
📍 Synchronous Messages
A solid line with a filled arrowhead indicates a synchronous message. This means the sender waits for the receiver to complete the action before continuing. It is a blocking call.
- Example: A user clicks a button, and the system processes the request and updates the screen immediately.
📍 Asynchronous Messages
A solid line with a half-filled or open arrowhead indicates an asynchronous message. The sender sends the message and continues its own work without waiting for a response.
- Example: A background task starts processing a file upload while the user is shown a “loading” spinner.
📍 Return Messages
A dashed line with an open arrowhead represents a return message. This is often implicit in code but explicit in diagrams to show the flow of data back to the caller.
- Example: A function returns a calculated result or a confirmation status.
📍 Self-Message
When an object sends a message to itself, the arrow loops back to the same lifeline. This indicates internal processing or recursion.
🔄 Control Flow and Fragments
Real-world logic is rarely a straight line. Systems make decisions, repeat actions, and handle exceptions. Sequence diagrams use frames to represent these complex flows.
Alt (Alternative)
The alt frame represents conditional logic. It is similar to an if-else statement in programming. The frame is divided into sections, each with a condition in brackets. Only one section is executed based on the condition met.
- Use Case: Checking if a user is logged in. If yes, show dashboard; if no, show login screen.
Opt (Optional)
The opt frame indicates that the enclosed sequence is optional. It might happen, but it is not required for the main flow to complete.
- Use Case: Sending a notification email. The purchase happens regardless, but the email is optional.
Loop
The loop frame indicates that the enclosed interactions repeat. This is often used for processing lists or handling repeated inputs.
- Use Case: Processing every item in a shopping cart one by one.
Break
The break frame is used to indicate an abnormal flow, such as an error condition that terminates the normal sequence.
- Use Case: A network timeout occurs, stopping the process early.
Par (Parallel)
The par frame shows that multiple interactions happen simultaneously. This is common in systems with multiple threads or independent processes.
- Use Case: Downloading a file while simultaneously updating the progress bar in the UI.
⏳ Object Lifecycle: Creation and Destruction
Objects are not permanent fixtures. They are created when needed and destroyed when their task is complete. Sequence diagrams can explicitly show this lifecycle.
Creating an Object
To show that a new instance is being created, a message arrow is drawn to a dashed rectangle. This rectangle represents the new object’s lifeline beginning.
- Symbol: Message arrow pointing to a dashed box.
- Meaning: Memory is allocated, and the object comes into existence.
Destructing an Object
To show an object is being removed, a cross symbol is placed at the bottom of the lifeline.
- Symbol: A cross (X) on the lifeline.
- Meaning: The object is garbage collected or explicitly closed.
📖 How to Read a Sequence Diagram
Reading these diagrams requires a systematic approach. You should not jump around randomly. Follow these steps to ensure accurate interpretation.
- Identify Participants: Look at the top of the diagram. Who is involved? Identify the actors and system objects.
- Trace the Lifelines: Follow the vertical lines to understand the scope of each object.
- Follow the Arrows: Start from the top and move down. Read the first message sent.
- Check for Activation: Look at the activation bars to see which object is busy at any given point.
- Analyze Loops and Conditions: When you hit a frame like
altorloop, check the condition to determine the path. - Verify Return Paths: Ensure that responses return to the correct caller.
✍️ Writing Your Own Sequence Diagrams
Creating a diagram from scratch is just as important as reading one. It forces you to think about the flow before implementation. Here are principles to follow for clarity.
- Start with a Goal: Define the specific use case. Do not try to diagram the entire system at once. Focus on one scenario.
- Keep It Linear: Arrange messages logically from left to right. Avoid crossing arrows where possible to reduce visual noise.
- Limit Participants: Too many objects make the diagram hard to read. If there are too many, consider grouping them or splitting the diagram.
- Use Consistent Naming: Use clear names for objects and messages. Avoid abbreviations that are not standard.
- Focus on Behavior: Remember, this is about interaction, not data structure. Do not include class attributes unless they are critical to the interaction.
🛑 Common Mistakes to Avoid
Even experienced designers make errors. Being aware of these pitfalls will help you produce cleaner diagrams.
- Ignoring Return Messages: Forgetting to show where data comes back can make the flow seem incomplete.
- Mixing Levels of Abstraction: Do not show database queries and UI clicks in the same diagram unless they are tightly coupled. Keep high-level logic separate from low-level implementation details.
- Overusing Frames: Putting every single
ifstatement into a separate frame makes the diagram cluttered. Usealtframes for significant branching points only. - Unclear Lifelines: If lifelines are not aligned properly, the timing becomes ambiguous.
- Missing Activation Bars: Without activation bars, it is hard to tell when an object is processing versus waiting.
📝 Practical Example: User Login Process
Let us walk through a concrete scenario. Imagine a user attempting to log in to a web application. The following interactions occur.
- Actor: User
- Boundary: Login Screen
- Control: Authentication Controller
- Entity: User Database
The Flow:
- The User enters credentials on the Login Screen.
- The Login Screen sends a Submit Credentials message to the Authentication Controller.
- The Controller activates and sends a Validate User message to the User Database.
- The Database checks the records and sends a Validation Result back to the Controller.
- If the result is Success (using an
altframe):- The Controller sends a Generate Token message.
- The Controller sends a Login Success message to the Login Screen.
- The Login Screen redirects the User to the Dashboard.
- If the result is Failure:
- The Controller sends an Error Message to the Login Screen.
- The Login Screen displays an error notification to the User.
This example demonstrates the use of lifelines, messages, activation bars, and conditional logic. It shows how a simple action triggers a chain of events across the system.
💡 Why Sequence Diagrams Matter for Students
For students, learning this notation is not just about passing an exam. It develops a specific type of thinking required in software engineering.
- Systematic Thinking: It forces you to consider the order of operations. You cannot skip steps.
- Communication: It provides a common language for developers, designers, and stakeholders. Everyone looks at the same arrows and sees the same logic.
- Debugging: When a bug occurs in production, a sequence diagram helps trace where the flow went wrong. Was it a missing message? An incorrect condition?
- Documentation: Code changes over time. Diagrams serve as a snapshot of how the system was designed to work, which is invaluable for onboarding new team members.
🔗 Integrating with Other Diagrams
Sequence diagrams do not exist in isolation. They are part of a larger ecosystem of UML diagrams.
- Class Diagrams: Define the structure. Sequence diagrams define the behavior of those structures.
- Use Case Diagrams: Define the scope. Sequence diagrams detail the internal steps of a specific use case.
- State Machine Diagrams: Define the status of an object. Sequence diagrams show how the object moves between states via messages.
Using these diagrams together creates a comprehensive model of the software. The class diagram tells you what exists; the sequence diagram tells you what happens when it is used.
🎓 Final Thoughts
Mastery of sequence diagrams comes with practice. Start by reading diagrams created by others. Then, try to draw diagrams for simple everyday tasks, like making a coffee or checking out a library book. Translate those real-world steps into messages and lifelines.
As you progress, apply these concepts to your academic projects. Before writing code, sketch the interaction flow. You will likely find that you catch logical errors early, saving significant time during the implementation phase. Remember, the goal is clarity. If a diagram is confusing to draw, it will be confusing to read. Keep it simple, keep it accurate, and let the visual flow speak for itself.

