Software architecture is the backbone of any robust digital solution. While standard diagrams like Class or Sequence diagrams explain the static structure or dynamic behavior of a system, they often fall short when describing the internal composition of complex components. This is where the UML Composite Structure Diagram becomes indispensable. It provides a granular view of the internal structure of a classifier, revealing how parts collaborate to fulfill specific responsibilities.
In this comprehensive guide, we explore how real-world systems leverage this specific modeling technique. We will dissect the anatomy of the diagram, analyze three distinct architectural patterns, and outline best practices for maintaining structural integrity without clutter. Whether you are designing distributed microservices or managing legacy integration, understanding internal composition is key to scalability and maintainability.
🔍 Understanding the Core Concept
Before diving into case studies, it is essential to define what this diagram actually represents. Unlike a Class Diagram that shows relationships between types, a Composite Structure Diagram focuses on a single classifier and its internal makeup. It answers the question: “What is inside this component, and how do its pieces interact?”
Key elements include:
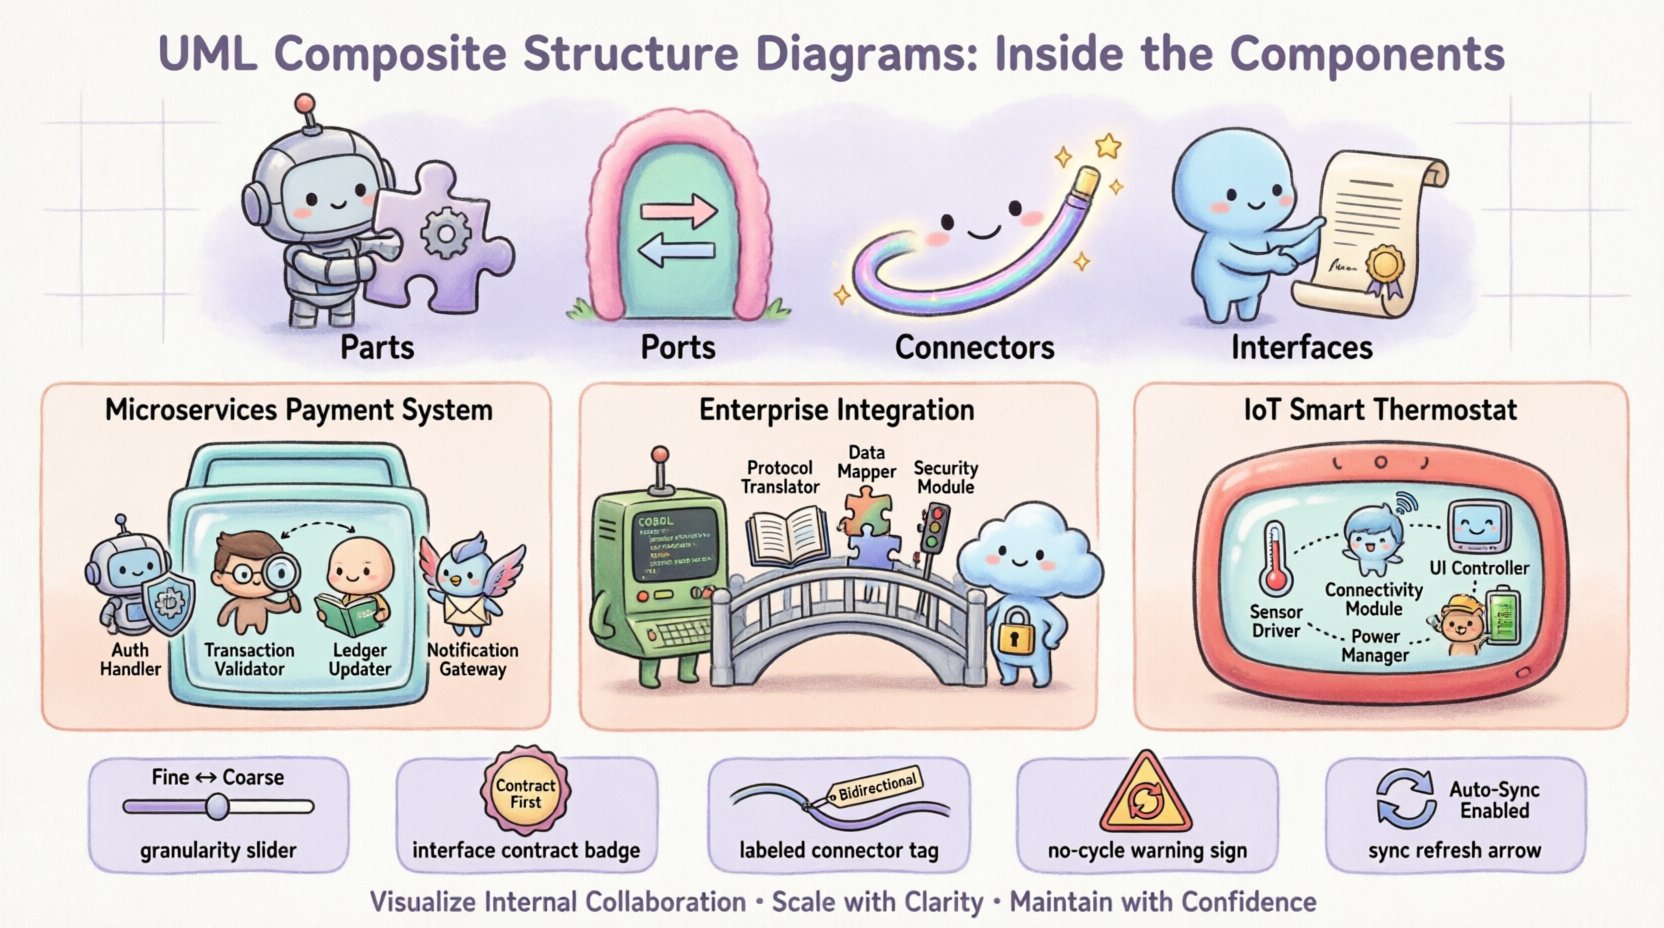
- Parts: The internal instances or components that make up the whole.
- Ports: Designated interaction points where parts communicate with the outside world or other internal parts.
- Connectors: Links that bind ports together, defining the flow of data or control.
- Interfaces: Specifications of behavior provided or required by parts.
This level of detail is crucial when a system component is not a simple monolith but a composite of smaller, collaborating units. It bridges the gap between high-level architecture and low-level implementation details.
📊 Anatomy of a Composite Structure Diagram
To visualize the utility of this diagram, consider the standard elements used within the modeling canvas. The following table outlines the primary symbols and their semantic meaning in a technical context.
| Symbol/Element | Description | Usage Context |
|---|---|---|
| Part | Represents an internal instance of a classifier. | Used to show specific instances within a container. |
| Port | A named interaction point for a part. | Defines where connections enter or leave a part. |
| Connector | Links ports to other ports or external entities. | Establishes communication paths between parts. |
| Interface | A contract of behavior. | Specifies required or provided functionality. |
By utilizing these elements, architects can model complex behaviors without exposing the entire codebase. It allows for abstraction where the internal logic is hidden, but the interaction mechanisms are clear.
🌐 Case Study 1: Distributed Microservices Architecture
One of the most common applications of composite structure modeling is in the domain of distributed systems. In a microservices environment, a single logical service often comprises multiple internal processes, threads, or containers. A Composite Structure Diagram clarifies how these internal processes relate to the external API endpoints.
Scenario Overview
Consider a Payment Processing Service. From the outside, this is a single API endpoint. Internally, it consists of several distinct functional units:
- Authentication Handler: Verifies user credentials.
- Transaction Validator: Checks balance and fraud rules.
- Ledger Updater: Commits changes to the database.
- Notification Gateway: Sends confirmation emails.
Modeling the Interaction
In a Composite Structure Diagram, the Payment Service acts as the composite classifier. Inside, each of the units above is a Part. Each part exposes specific Ports.
For instance, the Transaction Validator might require an Input Port for the transaction details and provide an Output Port for the validation result. The Authentication Handler requires a user token input.
The Connectors within this diagram define the sequence of execution. Data flows from the external API into the Authentication Handler, then to the Validator, and finally to the Ledger Updater. If the Validator rejects the transaction, the flow diverges to a different port leading to an error handler.
Benefits in this Context
- Decoupling: Teams can work on the Notification Gateway independently as long as the port interface remains stable.
- Failure Analysis: Engineers can trace exactly which internal part is failing when a service returns a 500 error.
- Scalability Planning: If the Transaction Validator becomes a bottleneck, the diagram highlights it as a distinct part that can be scaled independently.
🏢 Case Study 2: Enterprise Application Integration
Large organizations often rely on legacy systems that were not designed for modern integration standards. A Composite Structure Diagram is invaluable when modeling an Adapter Layer designed to bridge old mainframe systems with new cloud applications.
Scenario Overview
An enterprise needs to migrate data from a legacy database to a modern data warehouse. The integration platform acts as a mediator. It cannot speak the native protocol of the legacy system, nor can the legacy system speak the modern API protocol.
The integration component is modeled as a composite structure containing:
- Protocol Translator: Converts legacy messages to JSON.
- Data Mapper: Transforms field names and structures.
- Queue Manager: Handles asynchronous buffering.
- Security Module: Encrypts data in transit.
Modeling the Interaction
The diagram focuses on the Data Flow. The Protocol Translator connects to an external Required Port representing the legacy system connection. Its Provided Port connects to the Data Mapper.
This visualizes the transformation chain clearly. If the Security Module is placed between the Data Mapper and the Queue Manager, the diagram shows the encryption point explicitly. This prevents security gaps where data might be exposed in transit between internal parts.
Key Advantages
- Visibility: Stakeholders can see the transformation pipeline without reading the source code.
- Testing Strategy: Testers can verify the contract at each port connection independently.
- Refactoring: If the Queue Manager needs to be replaced with a different technology, the diagram confirms that only the connector and the specific part need changes, not the entire integration logic.
⚙️ Case Study 3: Embedded Systems and IoT
In the Internet of Things (IoT), hardware and software are tightly coupled. A Composite Structure Diagram is essential for modeling the boundary between firmware and hardware resources. This is often referred to as a Deployment Context.
Scenario Overview
Consider a Smart Thermostat Device. It contains a microcontroller, temperature sensors, a Wi-Fi module, and a display screen. The software runs on top of these physical components.
The diagram models the Device Controller as the composite classifier. The internal parts are:
- Sensor Driver: Software abstraction for the temperature sensor.
- Connectivity Module: Handles Wi-Fi protocols.
- User Interface Controller: Manages the display logic.
- Power Management Unit: Optimizes battery usage.
Modeling the Interaction
Here, the Ports represent physical pins or logical interfaces. The Sensor Driver might have a port connected to a physical GPIO pin. The Connectivity Module has a port connected to the radio frequency hardware.
The Connectors show how data moves. For example, the Sensor Driver sends raw voltage readings to the User Interface Controller via a direct connector for local display updates. Simultaneously, it sends aggregated data to the Connectivity Module for cloud upload.
Why This Matters
- Resource Constraints: Engineers can see which parts consume the most power or memory.
- Hardware Dependencies: If the hardware vendor changes the temperature sensor, the diagram shows exactly which driver part needs replacement.
- Real-Time Behavior: It helps visualize latency paths. Data going through the Power Management Unit might be delayed compared to direct connections.
🛠️ Best Practices for Modeling
While these diagrams are powerful, they can become overwhelming if not managed correctly. Over-modeling leads to confusion, while under-modeling misses critical details. The following guidelines ensure clarity and utility.
1. Maintain Appropriate Granularity
Do not model every single variable or method inside a part. Focus on the structural components. A part should represent a logical unit of functionality, such as a class, module, or subsystem.
2. Use Interfaces for Abstraction
Always define interfaces for ports. This decouples the internal implementation from the external contract. If the internal logic of a part changes, the port interface can remain the same, ensuring stability.
3. Label Connectors Clearly
A connector without a label is ambiguous. Specify the data type, protocol, or action on the connector line. For example, label a connector as “JSON Stream” or “TCP Connection”.
4. Avoid Cyclic Dependencies
Ensure that parts do not depend on each other in a circular manner unless explicitly intended. Cycles can indicate design flaws or tight coupling that is hard to maintain.
5. Keep Diagrams Synchronized
Diagrams are living documents. They must be updated whenever the architecture changes. Outdated diagrams are more harmful than no diagrams at all.
🔄 Integration with Other UML Diagrams
The Composite Structure Diagram does not exist in isolation. It complements other modeling techniques to provide a complete picture of the system.
| Diagram Type | Relationship to Composite Structure |
|---|---|
| Class Diagram | Defines the types used for Parts. The Composite Structure Diagram instantiates these types internally. |
| Sequence Diagram | Describes the dynamic interaction between Parts over time. The Composite Structure Diagram defines the static context for this interaction. |
| Deployment Diagram | Shows where Parts are physically located. The Composite Structure Diagram shows how they logically interact. |
| Component Diagram | Operates at a higher level. The Composite Structure Diagram can be used to drill down into a specific Component. |
By combining these views, architects can trace a requirement from the high-level component down to the internal part implementation.
🚧 Common Pitfalls and Solutions
Even experienced modelers encounter challenges. Identifying these early prevents technical debt in the documentation.
- Pitfall: Too Many Parts.
- Solution: Group parts into sub-composites. Create a hierarchy where a main diagram references a nested composite structure.
- Pitfall: Ambiguous Ports.
- Solution: Ensure every port has a clear interface definition. Avoid generic names like “Input” or “Output” without context.
- Pitfall: Ignoring State.
- Solution: If a part has internal state that affects connectivity, document this in the part’s description or use a State Machine Diagram alongside it.
🔧 Implementation and Maintenance
Once the diagrams are created, the focus shifts to maintenance. In agile environments, where code changes frequently, diagrams can quickly become obsolete.
Automation and Tooling
Modern modeling tools often support code generation or reverse engineering. While manual updates are sometimes necessary, tools can help keep the structure aligned with the actual codebase.
Version Control
Treat diagrams as code. Store them in version control systems alongside the source code. This allows teams to review architectural changes and revert if a structural modification introduces instability.
Review Cycles
Include diagram updates in the Definition of Done (DoD) for architectural changes. When a new service is added or a component is refactored, the Composite Structure Diagram should be updated in the same sprint.
📈 Measuring Success and Value
How do you know if using these diagrams adds value? Look for the following indicators:
- Reduced Onboarding Time: New developers understand the internal structure faster.
- Fewer Integration Bugs: Clear port definitions prevent mismatched data formats.
- Better Documentation: The system documentation is more accurate and up-to-date.
- Clearer Communication: Stakeholders understand the complexity of the system without needing deep technical knowledge.
The investment in modeling pays off during the maintenance phase. When a critical bug occurs, having a clear map of internal connections allows for faster diagnosis.
🏁 Final Considerations
UML Composite Structure Diagrams offer a precise way to model the internal composition of software systems. They move beyond the black box view of components to reveal the machinery inside. Through the case studies of distributed microservices, enterprise integration, and embedded systems, we see that this tool is versatile across different domains.
By adhering to best practices and maintaining synchronization with the codebase, teams can leverage these diagrams to build more robust, scalable, and maintainable architectures. The key is balance: enough detail to be useful, but enough abstraction to remain manageable. As systems grow in complexity, the ability to visualize internal collaboration becomes not just a nice-to-have, but a necessity for engineering success.
When approaching your next architectural design, consider the internal structure of your components. A well-drawn composite structure diagram can be the difference between a fragile system and one built to endure.
