Software architecture is more than just connecting boxes on a canvas. It is about understanding how the internal machinery of a system functions, interacts, and holds together. While standard class diagrams provide a high-level view of static structure, they often fall short when describing the internal topology of complex components. This is where the UML Composite Structure Diagram becomes essential.
These diagrams offer a granular perspective, allowing architects to visualize the internal logic, define boundaries, and specify how parts collaborate within a classifier. Whether you are designing a distributed system or refactoring a monolithic application, understanding this notation is critical for clarity.
🔍 Understanding the Composite Structure Diagram
A Composite Structure Diagram is a type of UML behavioral diagram that shows the internal structure of a classifier. It focuses on the parts that make up a class or component and the interactions between those parts. Unlike a standard class diagram which shows attributes and methods, this diagram reveals the composition.
Think of it as a blueprint for the inside of a room. A floor plan shows the walls and doors, but a composite structure diagram shows the furniture arrangement, wiring, and how different zones connect. This distinction is vital for systems where internal behavior dictates external success.
Why Use This Diagram?
- Internal Visibility: It exposes the private structure of a class without cluttering the external interface.
- Component Interaction: It clarifies how internal parts communicate with each other.
- Boundary Definition: It clearly marks the boundary between the component and the outside world.
- Reuse: It helps in identifying reusable sub-components within a larger system.
🧩 Core Components of the Diagram
To construct a valid diagram, one must understand the specific notation used. Each element serves a distinct purpose in defining the system’s topology.
1. Parts (📦)
Parts represent the instances of classifiers that are contained within the composite structure. They are essentially the building blocks. In a class diagram, these would be attributes, but here they are treated as objects with their own lifecycle and behavior.
- Shown as a rectangle with the stereotype <<part>>.
- Named to indicate the role it plays within the whole.
- Can be typed as a specific class or interface.
2. Ports (🔌)
Ports are the entry and exit points for interaction. They define where external communication occurs and how internal parts connect to the outside world. A port is a point of access to a component’s functionality.
- Represented by a small rectangle attached to the boundary.
- Can be provided (offering functionality) or required (needing functionality).
- Helps in decoupling internal implementation from external usage.
3. Connectors (🔗)
Connectors link parts to parts, parts to ports, or ports to ports. They represent the flow of data or control signals between internal elements.
- Drawn as lines connecting the elements.
- Can be typed to indicate the specific protocol or data type being passed.
- May have multiplicity constraints defined at each end.
4. Roles (🎭)
Roles describe the specific behavior a part exhibits when connected via a connector. A single part might play multiple roles depending on how it is connected.
- Text labels placed on the connector lines.
- Clarify the perspective of the connection.
5. Interfaces (🛡️)
Interfaces define the contract of interaction. They are often represented by lollipop symbols (provided interfaces) or socket symbols (required interfaces) attached to ports.
📊 Comparison: Class Diagram vs. Composite Structure Diagram
It is common to confuse these two structural diagrams. The following table highlights the key differences to ensure proper usage.
| Feature | Class Diagram | Composite Structure Diagram |
|---|---|---|
| Primary Focus | Static structure of classes and relationships. | Internal structure of a single classifier. |
| Granularity | High-level (System-wide). | Low-level (Component-specific). |
| Attributes | Shown as data fields. | Shown as Part instances (objects). |
| Interaction | Implicit via methods. | Explicit via Ports and Connectors. |
| Use Case | Database schema design, general modeling. | Component design, internal logic flow. |
🛠️ Constructing a Composite Structure Diagram
Creating an effective diagram requires a methodical approach. You are not just drawing shapes; you are defining a contract for internal logic.
Step 1: Define the Classifier Boundary
Start by drawing the main rectangle representing the classifier (e.g., a specific Class or Component). This box acts as the boundary. Everything inside is internal.
Step 2: Identify Internal Parts
List the objects that make up this classifier. Are there sub-objects? Are there helper services? Place them inside the boundary. Label them clearly as parts.
Step 3: Define Ports for External Access
Identify where this classifier interacts with the rest of the system. Place ports on the boundary of the main rectangle. Specify if they are provided or required.
Step 4: Map Internal Connections
Draw lines between parts to show how they talk to each other. Use connectors to specify the flow of information. Ensure every part that needs to communicate has a path.
Step 5: Assign Roles and Interfaces
Label the connections with the roles they play. Attach interface symbols to ports to define the contract of communication.
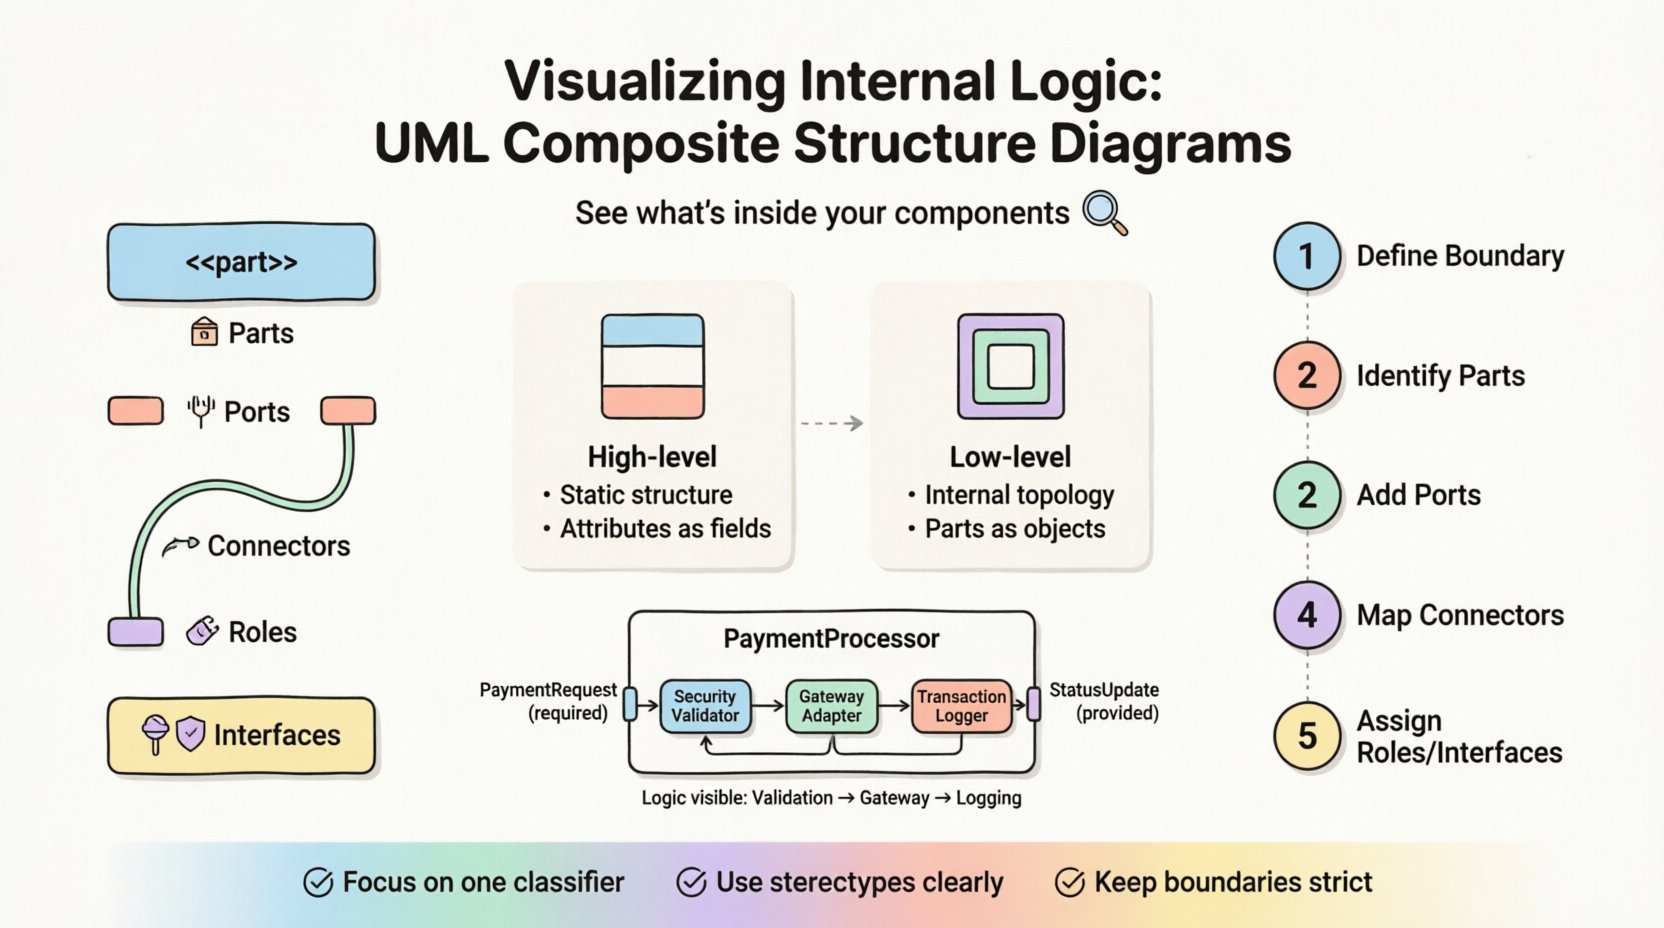
🏢 Real-World Scenario: Payment Processing System
To illustrate this, consider a Payment Processing System. Instead of just showing a “Payment” class, we visualize its internal logic.
- Classifier: PaymentProcessor
- Parts:
- TransactionLogger (Internal Part)
- SecurityValidator (Internal Part)
- GatewayAdapter (Internal Part)
- Ports:
- PaymentRequest (Required Interface)
- StatusUpdate (Provided Interface)
- Connectors:
- PaymentRequest flows to SecurityValidator.
- SecurityValidator flows to GatewayAdapter.
- GatewayAdapter flows to TransactionLogger.
In this scenario, the diagram shows that a payment request cannot go directly to the gateway. It must pass through validation and logging. This logic is hidden in a standard class diagram but visible here.
✅ Best Practices for Clarity
Complex diagrams can become unreadable quickly. Adhere to these principles to maintain quality.
- Limit Scope: Do not try to diagram the entire system in one composite structure diagram. Focus on one classifier at a time.
- Use Stereotypes: Clearly label parts and ports using standard UML stereotypes to reduce ambiguity.
- Avoid Overlapping: Ensure connectors do not cross unnecessarily. Use routing to keep lines clean.
- Document Roles: Never leave a connector unlabeled if the role changes based on direction.
- Consistent Naming: Use consistent naming conventions for ports and parts across the documentation set.
❌ Common Pitfalls to Avoid
Even experienced architects make mistakes when modeling internal logic. Watch out for these common errors.
- Confusing Parts with Attributes: Attributes hold data; parts hold objects. Do not treat a database connection string as a part instance.
- Ignoring Lifecycle: Parts often have their own lifecycle. Ensure the diagram reflects initialization and termination logic where relevant.
- Over-Engineering: Not every class needs a composite structure diagram. Use them only where internal complexity justifies the overhead.
- Mixing Levels: Do not mix internal parts with external dependencies in the same box. Keep the boundary strict.
🔄 Integration with Other Diagrams
The composite structure diagram does not exist in isolation. It complements other UML diagrams to form a complete picture of the system.
Sequence Diagrams
Use sequence diagrams to show the timing of interactions. The composite structure diagram shows the static topology that supports those timed interactions.
Activity Diagrams
Activity diagrams model the flow of control. The composite structure diagram provides the context for where that control flows internally.
Component Diagrams
Component diagrams show the high-level structure. Composite structure diagrams drill down into the internal composition of those components.
📝 Maintaining the Diagram
As software evolves, diagrams must evolve with them. Neglecting updates leads to documentation debt.
- Code Reviews: Treat diagram changes like code changes. Review them for accuracy during pull requests.
- Refactoring: If you refactor the internal structure of a class, update the diagram immediately.
- Version Control: Store diagrams alongside the codebase in version control systems to track history.
🔎 Deep Dive: Aggregation vs. Composition
Understanding the difference between aggregation and composition is crucial when defining parts.
- Composition: Strong ownership. If the whole dies, the parts die. In a diagram, this is often implied by the boundary.
- Aggregation: Weak ownership. Parts can exist independently of the whole.
When modeling, choose the relationship that matches the lifecycle of your objects. This choice affects how you model the ports and connectors as well.
🚀 Final Thoughts
Visualizing internal logic is a discipline that separates good architects from great ones. The UML Composite Structure Diagram is a powerful tool for this discipline. It forces clarity on how systems are built from the inside out.
By mastering the notation, understanding the components, and applying best practices, you can create documentation that serves as a reliable map for development and maintenance. It bridges the gap between high-level architecture and low-level implementation details without needing to read the source code.
Start applying these concepts to your next complex component. The clarity gained will pay dividends in reduced bugs and faster onboarding for new team members.

")