When designing complex software systems, understanding how components interact internally is just as critical as knowing how they connect externally. This is where the UML Composite Structure Diagram becomes an essential tool for system architects and developers. It provides a granular view of the internal structure of a classifier, revealing the parts that make up a class or component and how those parts collaborate to fulfill the system’s requirements.
This guide explores the mechanics, notation, and practical application of composite structure diagrams. We will move beyond high-level overviews to examine the specific relationships, roles, and semantic rules that define this modeling technique.
🧩 What is a Composite Structure Diagram?
A Composite Structure Diagram (CSD) is a structural diagram in the Unified Modeling Language (UML). It describes the internal structure of a classifier. While a standard class diagram shows the attributes and operations of a class, it does not explicitly show the internal composition of that class.
The composite structure diagram fills this gap. It allows you to visualize:
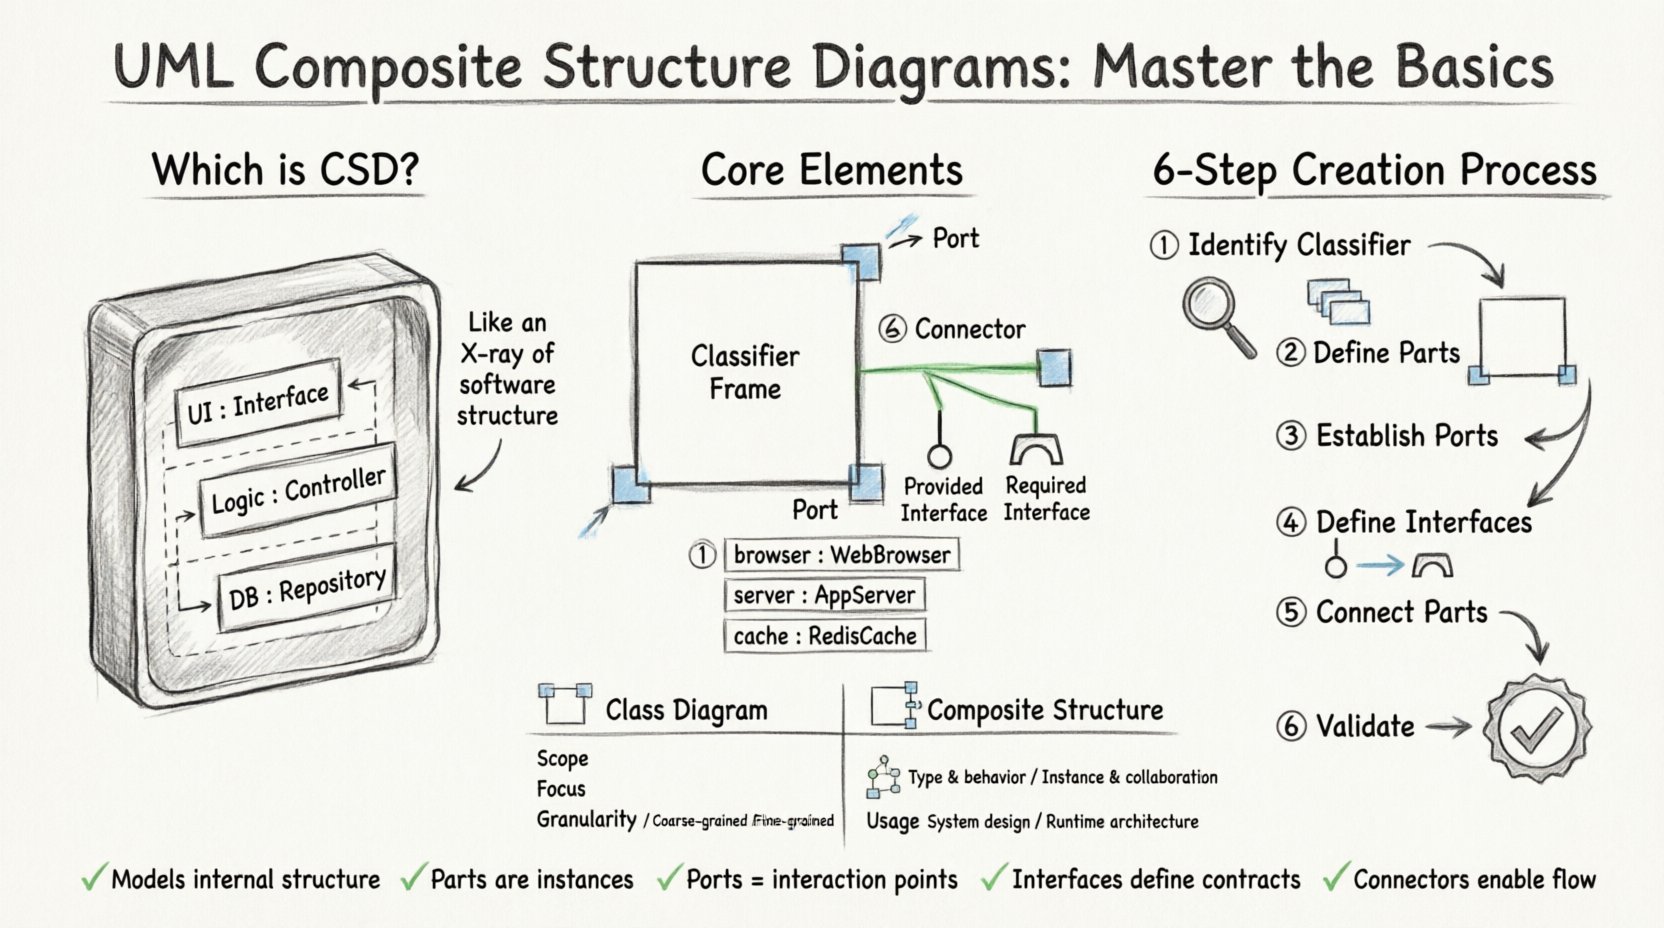
- Parts: The internal components that make up the classifier.
- Ports: The interaction points where parts connect to the outside world or to other parts.
- Connectors: The links that define how data or control flows between ports.
- Interfaces: The services provided or required by the structure.
Think of it as taking a piece of software or hardware and performing a “CT scan” on it. You see the organs (parts), the ports (connections), and the nervous system (connectors) that allow it to function.
🛠️ Core Elements and Notation
To construct an accurate composite structure diagram, one must understand the specific symbols and their meanings. Precision in notation prevents ambiguity during the development lifecycle.
1. The Classifier Frame
The main rectangle represents the composite structure itself. It usually corresponds to a Class, Component, or Node in other UML diagrams. Inside this frame, you define the internal architecture.
2. Parts (Internal Instances)
A Part represents an instance of a class that is owned by the composite structure. It is distinct from the class itself.
- Notation: A small rectangle with the name of the part, often underlined, followed by a colon and the class name.
- Example:
browser : WebBrowser - Visibility: Parts can be private, protected, or public, indicated by
-,#, or+.
3. Ports (Interaction Points)
A Port is a named interaction point on the boundary of a part or the composite structure. It defines where the structure can interact with the external environment or other internal parts.
- Notation: A small box attached to the boundary of a part or the composite.
- Role: It specifies the interface the part uses to communicate.
4. Interfaces (Contracts)
Interfaces define the contract of interaction. They specify what a port requires or provides.
- Required Interface: A “hole” where the part needs a service. Notation: a circle with a line.
- Provided Interface: A “ball” where the part offers a service. Notation: a solid circle.
5. Connectors (Links)
Connectors link ports together. They define the flow of data or control between parts.
- Notation: A solid line connecting two ports.
- Association: Links two ports directly.
- Dependency: Indicates that one part depends on the functionality of another.
📊 Comparison: Composite vs. Class Diagrams
It is common to confuse Composite Structure Diagrams with Class Diagrams. While both deal with structure, their focus differs significantly.
| Feature | Class Diagram | Composite Structure Diagram |
|---|---|---|
| Scope | System-wide or package level | Internal to a single classifier |
| Focus | Attributes and Operations | Internal Parts and Connections |
| Granularity | High-level logic | Low-level architecture |
| Usage | Database schema, API design | Microservices, Hardware integration |
Use a Class Diagram when you need to understand the data model and logic across the entire application. Use a Composite Structure Diagram when you need to understand how a specific component is built from smaller sub-components.
🚀 Step-by-Step Guide to Creating a Composite Structure Diagram
Creating a robust diagram requires a methodical approach. Follow these steps to ensure your model is accurate and useful for stakeholders.
Step 1: Identify the Classifier
Start by defining the main class or component you wish to decompose. This is the “Composite”. For example, consider a PaymentGateway class.
- Draw a large rectangle labeled
PaymentGateway. - Ensure this is the top-level container for your internal structure.
Step 2: Define Internal Parts
Decompose the main classifier into its constituent parts. What sub-components are strictly required for this class to function?
- Identify dependencies. Does it need a secure connection manager?
- Identify data handlers. Does it need a transaction logger?
- Add these as small rectangles inside the main frame.
- Example: Add
securityManager : SecurityModuleandlogger : TransactionLog.
Step 3: Establish Ports
Parts need ways to communicate. Define ports on each part where interaction occurs.
- For the
PaymentGateway, you might need an external port for accepting requests from the frontend. - For the
securityManager, you might need a port to request encryption services. - Draw small boxes on the boundary of the parts.
- Label them clearly, such as
authPortordataPort.
Step 4: Define Interfaces
Specify what services are needed or provided at each port. This ensures that parts know exactly what to expect.
- Attach an interface symbol to the port.
- Use the “Lollipop” notation for provided interfaces.
- Use the “Socket” notation for required interfaces.
- Example: The
securityManagermight require an interface namedEncryptionService.
Step 5: Connect the Parts
Draw lines (connectors) between the ports to define the flow of information.
- Connect the
PaymentGatewayport to thesecurityManagerport. - Ensure the direction of data flow makes sense logically.
- Label the connector if multiple roles are involved (e.g.,
role1,role2).
Step 6: Review and Validate
Before finalizing, check the diagram for logical consistency.
- Are all required interfaces connected?
- Are there any isolated parts that do not communicate?
- Does the internal structure support the external behavior of the main class?
🧪 Real-World Scenario: Microservice Architecture
Composite Structure Diagrams are particularly effective in modern microservice architectures. Let us examine a OrderProcessingService.
Scenario Breakdown
The service receives an order, validates it, calculates shipping, and confirms payment. Internally, this service is composed of several logical modules.
- OrderValidator: Checks data integrity.
- ShippingCalculator: Computes costs based on weight.
- PaymentProcessor: Handles transaction logic.
- Logger: Records audit trails.
Structural Model
In the diagram, the OrderProcessingService is the composite frame. The four modules above are the Parts. The OrderValidator requires an interface ValidationRules. The ShippingCalculator requires LocationData. The PaymentProcessor requires PaymentGatewayAPI. Connectors link the main service ports to these internal requirements.
Why Use This Diagram Here?
- Clarity: It shows that the
OrderProcessingServiceis not a monolith but a composition of distinct concerns. - Decoupling: It highlights that the
PaymentProcessoris interchangeable as long as it provides the required interface. - Deployment: It hints at where these parts might be deployed physically (e.g., in different containers).
🔗 Relationships and Cardinalities
Understanding how parts relate to each other is vital. Cardinalities define how many instances of a part can exist within the composite.
1:1 Relationship
One instance of the part exists for each instance of the composite.
- Example: A
Carhas exactly oneEngine. - Notation: A line with a single bar on the part end.
1:N Relationship
One composite can contain many instances of a part.
- Example: A
ShoppingCartcontains manyCartItems. - Notation: A crow’s foot symbol on the part end.
0:N Relationship
The composite may exist without the part, or contain many.
- Example: A
Documentmay have zero or manyPages. - Notation: A crow’s foot with an optional bar.
Incorrect cardinality can lead to runtime errors or architectural bottlenecks. Always verify the lifecycle of the parts. Does the part die when the composite dies? Or can it outlive it?
🎯 Best Practices for Effective Modeling
To maintain high-quality diagrams, adhere to the following guidelines.
- Keep it Simple: Do not overload the diagram with too many parts. If a composite has more than 10 parts, consider breaking it down further.
- Consistent Naming: Use clear, descriptive names for parts and ports. Avoid generic terms like
Part1. - Grouping: Use nested frames to group related parts. This reduces visual clutter.
- Separation of Concerns: Do not mix behavioral diagrams (like Sequence Diagrams) into the structure. Keep structure and behavior separate.
- Version Control: Treat these diagrams as code. Version them alongside your source code to ensure documentation matches implementation.
⚠️ Common Pitfalls to Avoid
Even experienced architects can make mistakes when modeling internal structures. Watch out for these common issues.
1. Over-Engineering
Do not create a composite structure for every single class. Only model classes where the internal composition is complex enough to warrant visualization. Simple data models do not need this level of detail.
2. Ignoring Lifecycle
Parts often have different lifecycles than the composite. Ensure your model reflects whether parts are created and destroyed with the composite or if they persist independently.
3. Ambiguous Interfaces
Ensure interfaces are clearly defined. If a port requires an interface, specify exactly what methods are needed. Vague interfaces lead to integration errors.
4. Circular Dependencies
Avoid creating loops where Part A requires Part B, and Part B requires Part A. This creates a deadlock in the design logic. Break the cycle by introducing an intermediate interface or abstract class.
🔍 Advanced Concepts: Nested Composites
One of the most powerful features of composite structure diagrams is the ability to nest them. You can treat a part within a composite as a composite itself.
Imagine a Server class. Inside the Server frame, there is a Database part. The Database part can itself be a composite frame containing Table parts and Index parts. This nesting allows for hierarchical modeling.
- Benefit: It allows you to drill down into complexity without losing context.
- Benefit: It supports layering. You can show the high-level architecture on one page and the low-level details on another.
- Caution: Too much nesting can make the diagram unreadable. Limit nesting to two or three levels deep.
🤝 Collaboration with Development Teams
This diagram serves as a bridge between design and implementation.
- For Developers: It clarifies how to instantiate objects. It tells them which dependencies to inject.
- For QA: It helps in creating test cases that cover internal interactions, not just external inputs.
- For DevOps: It informs deployment strategies, showing which parts can be containerized independently.
Regularly walk through these diagrams with the team during sprint planning. This ensures that the architectural intent is understood by everyone involved in the build process.
📝 Summary of Key Takeaways
The UML Composite Structure Diagram is a specialized tool for deep architectural insight. It moves beyond the surface level of classes to reveal the machinery inside. By focusing on parts, ports, and connectors, architects can design systems that are modular, maintainable, and robust.
Key points to remember:
- It models the internal structure of a classifier.
- Parts are instances; Ports are interaction points.
- Interfaces define the contract for communication.
- Connectors link parts together to enable functionality.
- Use nested composites for hierarchical complexity.
By applying these principles, you ensure that your system design is not just a collection of classes, but a well-orchestrated assembly of interacting components. This precision reduces technical debt and facilitates smoother integration as the system grows.
Remember to keep your diagrams up to date. As the code evolves, the structure must evolve with it. A static diagram is a liability; a living model is an asset.

