The Unified Modeling Language (UML) offers various tools to represent software architecture. Among these, the UML Composite Structure Diagram stands out for its ability to depict internal details. It provides a way to show the internal structure of a classifier. This guide explores its purpose, components, and usage without relying on specific tools.
🤔 What is a Composite Structure Diagram?
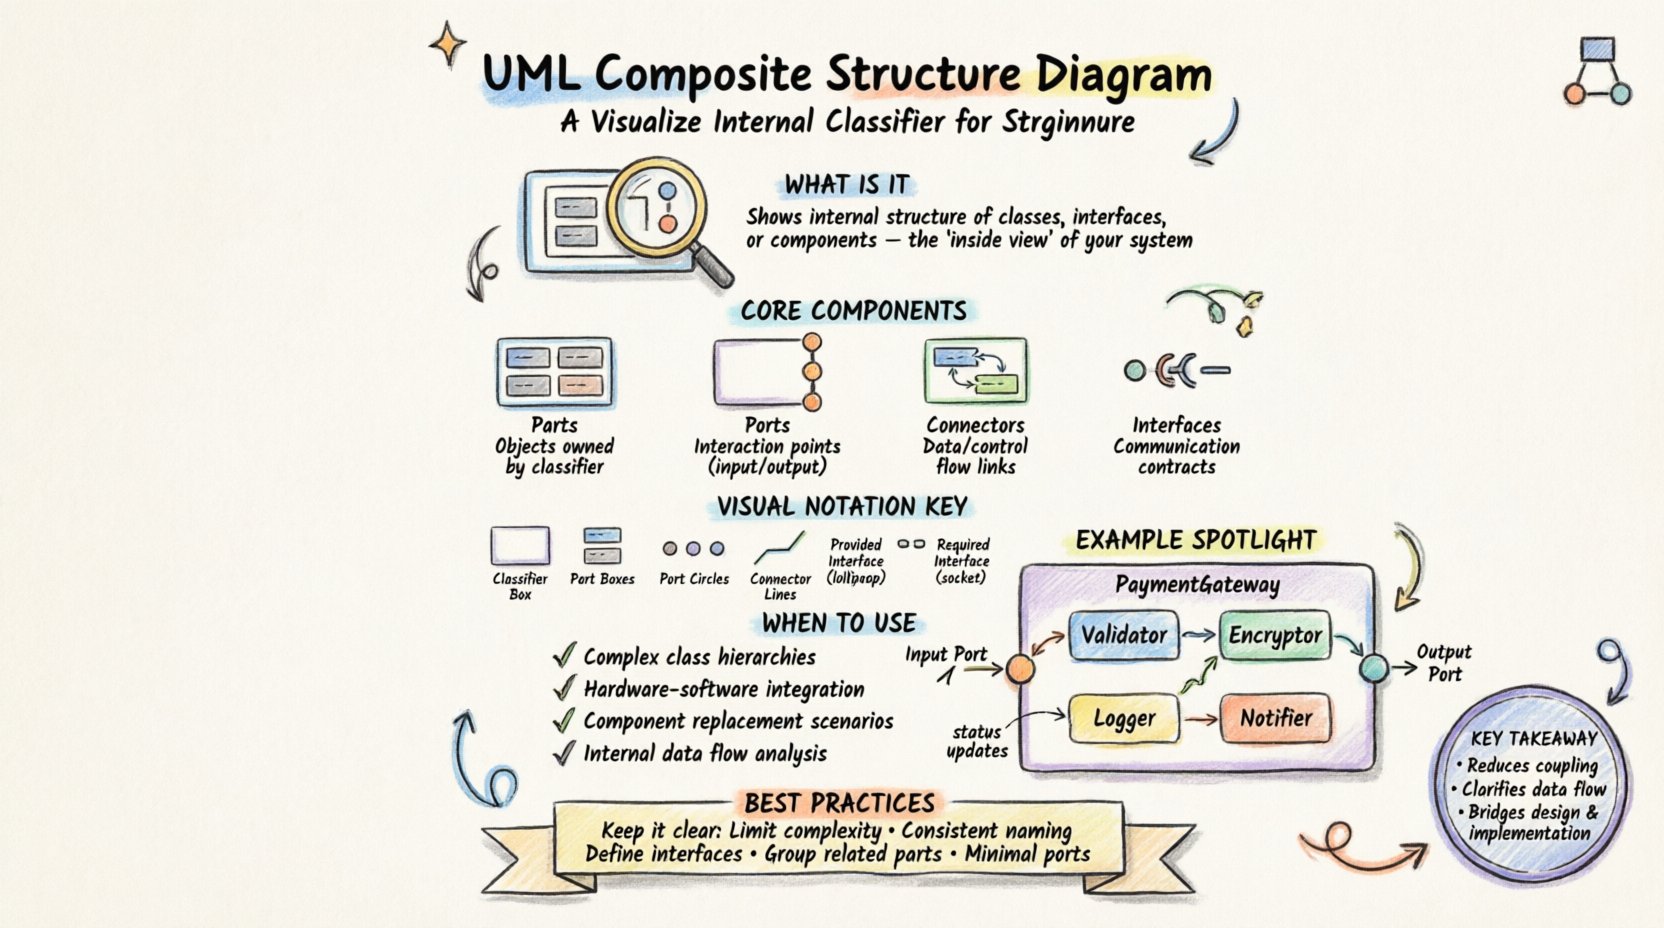
A Composite Structure Diagram is a type of UML diagram. It shows the internal structure of a classifier. A classifier can be a class, interface, or component. The diagram reveals how parts interact within a specific unit. It is essentially an internal view of a class or component.
Standard class diagrams show relationships between classes. However, they do not show what is inside a class. The Composite Structure Diagram fills this gap. It allows architects to visualize:
- Parts: The objects that make up the whole.
- Ports: The points of interaction.
- Connectors: The links between parts.
- Interfaces: The contracts for communication.
This level of detail is crucial for complex systems. It helps in understanding how data flows internally. It also aids in identifying potential bottlenecks before implementation.
🧩 Core Components Explained
To create an effective diagram, one must understand the building blocks. Each element serves a specific function in the architecture.
1. Parts 🧱
A part represents an object that is owned by the classifier. It is similar to an attribute but treated as an instance. Parts can be:
- Simple Objects: Basic instances.
- Composite Objects: Objects that contain other parts.
- Interfaces: Objects that define behavior.
Parts are typically shown inside the main classifier box. They have a name and a type. For example, a PaymentProcessor class might have a part named creditCardHandler of type ICreditCard.
2. Ports 🚪
Ports define interaction points. They represent a context where a part can communicate with the outside world. A port is a specialized type of part. It specifies the interface that the part provides or requires.
Key characteristics of ports include:
- Directionality: They can be required (input) or provided (output).
- Visibility: They control access to internal parts.
- Encapsulation: They hide internal complexity from external entities.
Using ports ensures that internal changes do not break external connections.
3. Connectors 🔗
Connectors link parts to ports or other parts. They represent the flow of information or control. There are two main types of connections:
- Internal Associations: Links between parts within the same classifier.
- External Bindings: Links between a port and an external element.
Connectors ensure that data moves correctly from one component to another. They can represent streams of data, control signals, or events.
4. Interfaces 🎯
Interfaces define a set of operations. In a composite structure diagram, interfaces specify the contract for communication. Ports are often associated with interfaces.
Types of interfaces in this context include:
- Provided Interface: The functionality the classifier offers to others.
- Required Interface: The functionality the classifier needs from others.
Clear interface definitions reduce coupling. They allow parts to be swapped without affecting the overall system.
🎨 Visual Notation and Syntax
Understanding the visual representation is key to reading and creating these diagrams. Standard UML notation applies, with specific extensions for composite structures.
- Classifier Box: A large rectangle representing the main class or component. It contains the internal parts.
- Part Boxes: Smaller rectangles inside the main box. Each represents a specific part.
- Port Circles: Small circles attached to the sides of part boxes or the main box. They indicate interaction points.
- Connector Lines: Lines connecting ports. They show the relationship between parts.
- Interface Lollipop: A circle connected to a line. It represents a provided interface.
- Interface Socket: A U-shape connected to a line. It represents a required interface.
These symbols create a standardized language. Developers and architects can read them regardless of their specific background.
📊 Comparison with Other UML Diagrams
It is easy to confuse the Composite Structure Diagram with other types. A comparison helps clarify its unique role.
| Diagram Type | Primary Focus | Internal Structure Shown? | Best Used For |
|---|---|---|---|
| Class Diagram | Static structure of classes | No | High-level relationships and attributes |
| Component Diagram | Physical components and their dependencies | Partially (as black boxes) | System deployment and module interaction |
| Composite Structure Diagram | Internal structure of a classifier | Yes | Deep dive into class internals and parts |
| Sequence Diagram | Time-based interaction flow | No | Dynamic behavior over time |
The table highlights that the Composite Structure Diagram is unique. It is the only one that exposes the internal composition of a single unit.
🛠️ When to Use This Diagram
Not every situation requires a composite structure diagram. It is best suited for specific scenarios where internal complexity matters.
1. Complex Class Hierarchies
When a class has many dependent parts, a standard class diagram becomes cluttered. A composite structure diagram breaks this down. It shows how the parts fit together logically.
2. Hardware-Software Integration
In embedded systems, software interacts with hardware components. This diagram models how software parts connect to physical ports. It bridges the gap between code and hardware.
3. Component Replacement
If a system allows parts to be swapped, this diagram defines the interface for those parts. It ensures compatibility when a new component is introduced.
4. Internal Data Flow Analysis
For debugging internal bottlenecks, this diagram maps data paths. It helps identify where data might get stuck or lost within a single unit.
✅ Best Practices for Creation
Creating a clear diagram requires adherence to certain guidelines. Following these steps ensures the diagram remains useful.
- Limit Complexity: Do not show every single attribute. Focus on significant parts that impact functionality.
- Use Consistent Naming: Ensure part names and interface names are consistent across all diagrams.
- Define Interfaces Clearly: Specify exactly what operations are provided or required.
- Group Related Parts: Use sub-composites to group related internal parts. This reduces visual noise.
- Keep Ports Minimal: Only expose ports that are necessary for external interaction. Hide internal details.
- Document Assumptions: Add notes for any implicit dependencies or behaviors not shown visually.
These practices maintain clarity. They prevent the diagram from becoming a confusing mess of lines and boxes.
🧪 Example Scenario: An Online Payment System
Let us apply this knowledge to a practical example. Consider a system processing online payments.
The Main Classifier
The PaymentGateway is the main classifier. It handles the entire transaction process.
Internal Parts
Inside the PaymentGateway, there are several parts:
- Validator: Checks card details.
- Encryptor: Secures sensitive data.
- Logger: Records transaction history.
- Notifier: Sends confirmation emails.
Interfaces and Ports
The PaymentGateway has specific ports:
- Input Port: Receives payment requests from the user.
- Output Port: Sends confirmation to the bank.
- Internal Port: Connects the Validator to the Encryptor.
Connectors
Connectors show the flow:
- Data flows from Input Port to Validator.
- Validated data flows to Encryptor.
- Encrypted data flows to Output Port.
- Status updates flow to Logger.
This scenario demonstrates how the diagram maps the logic. It shows that the Validator does not talk directly to the Output Port. It must go through the Encryptor. This dependency is clear in the composite structure view.
⚠️ Common Pitfalls to Avoid
Even experienced architects make mistakes. Being aware of common errors helps improve diagram quality.
- Over-Engineering: Showing too many parts makes the diagram unreadable. Focus on the core logic.
- Ignoring Ports: Failing to define ports leads to ambiguous connections. Always specify interaction points.
- Mixing Concerns: Do not mix structural details with behavioral details. Keep this diagram structural.
- Redundancy: Do not repeat information found in other diagrams unless it adds internal context.
- Unclear Interfaces: Vague interface definitions cause confusion during implementation.
Avoiding these issues ensures the diagram serves its purpose effectively.
🔄 Integration with Other Models
This diagram does not exist in isolation. It works well alongside other UML models.
- Class Diagram: Use the Class Diagram for high-level relationships. Use the Composite Structure Diagram for internal details.
- Sequence Diagram: Use Sequence Diagrams to show how the ports interact over time.
- State Machine Diagram: Use State Machines to define the lifecycle of the parts.
Combining these models provides a 360-degree view of the system. The Composite Structure Diagram anchors the internal structure, while others define behavior and relationships.
📝 Summary of Key Takeaways
- Purpose: Visualize the internal composition of a classifier.
- Key Elements: Parts, Ports, Connectors, Interfaces.
- Benefit: Reduces coupling and clarifies internal data flow.
- Usage: Best for complex classes and hardware-software interfaces.
- Constraint: Do not mix behavioral logic into structural diagrams.
Mastering this diagram type enhances system design skills. It provides the precision needed for robust architecture.
🚀 Final Thoughts on Architecture
Designing systems requires clear communication. The UML Composite Structure Diagram is a powerful tool for this. It bridges the gap between abstract concepts and concrete implementation.
By focusing on internal parts and their interactions, architects can build more maintainable systems. They can anticipate issues before they arise. This proactive approach saves time and resources.
Remember that diagrams are living documents. They should evolve as the system changes. Regular updates ensure they remain accurate. This practice supports long-term project success.
Use this guide as a reference. Apply these principles to your next project. Start simple and add complexity as needed. The goal is clarity, not decoration.

