Software architecture documentation often serves as the bridge between complex code and human understanding. The C4 model provides a structured way to visualize this complexity, moving from high-level context down to specific code components. However, creating these diagrams is not a one-time event. Over time, diagrams drift from reality, leading to confusion, miscommunication, and technical debt within the documentation itself. 📉
When diagrams stop reflecting the system, they become liabilities rather than assets. This guide addresses the common pitfalls encountered when maintaining C4 diagrams. We will explore specific issues at each level, how to identify them, and practical steps to resolve them. The goal is to restore clarity and ensure your architectural documentation remains a reliable source of truth. 🔍
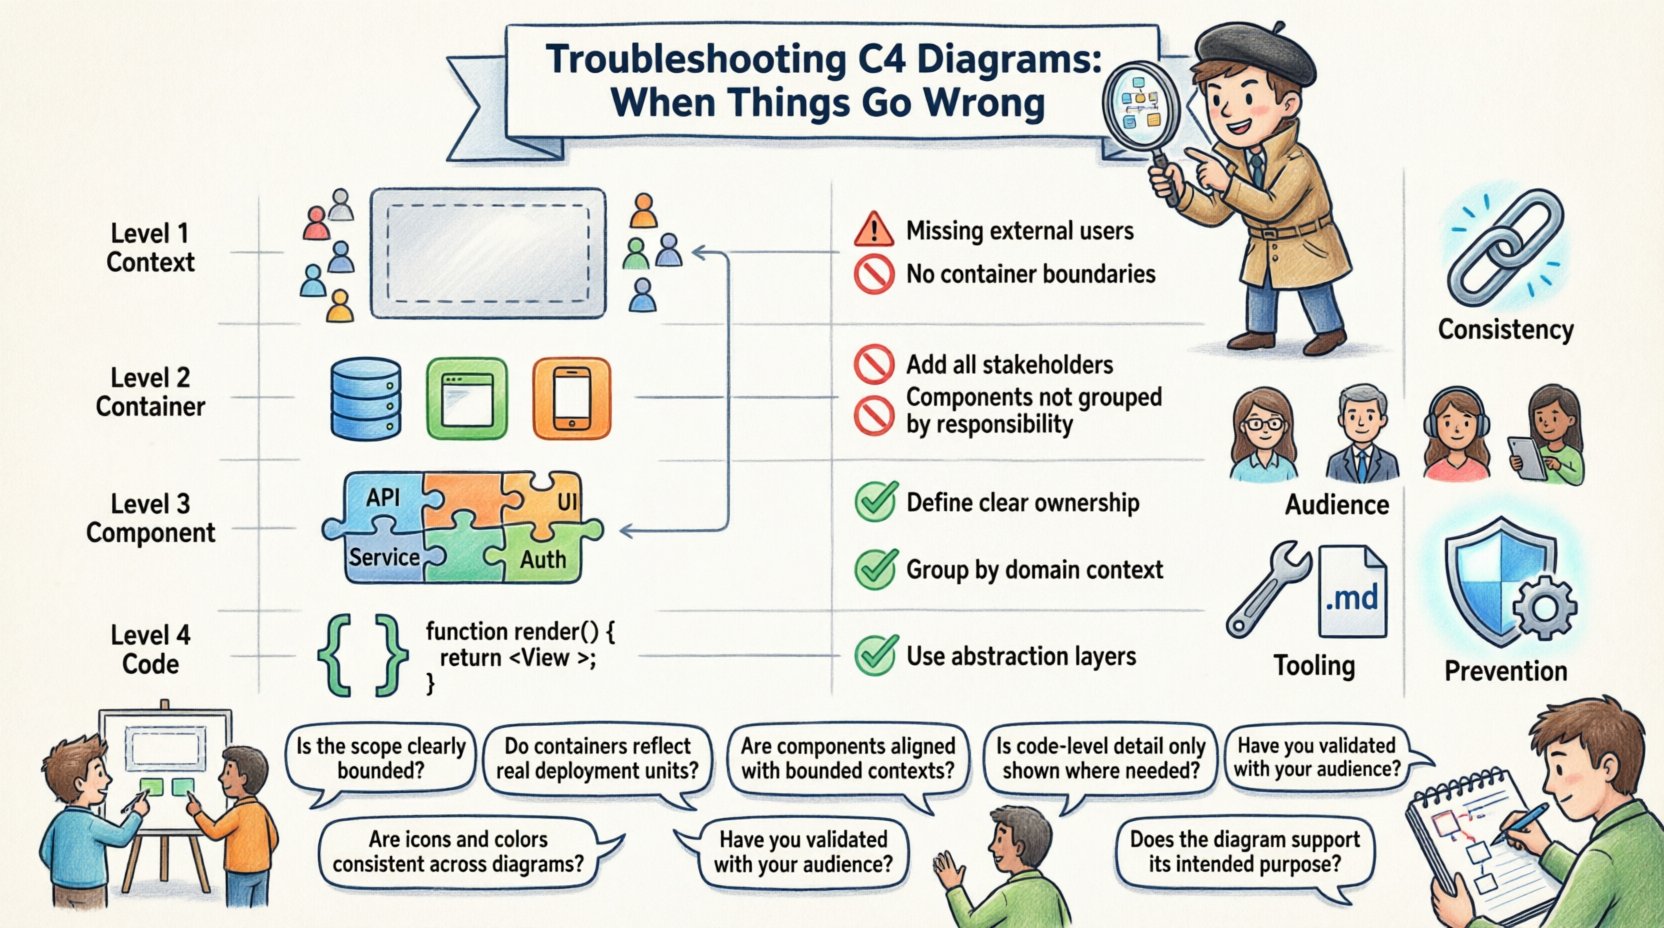
🧩 Level 1: Context Diagram Struggles
The Context Diagram is the entry point for anyone new to the system. It defines the boundaries and the external relationships. When this level is flawed, the entire documentation hierarchy suffers from a shaky foundation.
🚫 Common Issues
- Missing Actors: Failing to include critical human roles or external systems that interact with the software.
- Overcrowding: Adding too many external systems, making the diagram look like a spaghetti network.
- Unclear Boundaries: Not defining where the system ends and the outside world begins.
- Outdated Systems: Keeping references to legacy systems that no longer exist.
✅ Resolution Steps
To fix a broken Context Diagram, start by auditing the interactions. Review recent release notes and stakeholder meetings to identify new integrations. Then, perform the following cleanup:
- Remove any external system that has been decommissioned or integrated internally.
- Ensure every actor has a clear purpose. If a box exists but no data flows, remove it.
- Use standard shapes for people (stick figures) and standard shapes for systems (rectangles).
- Keep the diagram to a single page. If it spills over, the scope is likely too wide.
📦 Level 2: Container Diagram Challenges
The Container Diagram breaks down the system into deployable units. These are the servers, databases, and client applications. This level is often where the most confusion arises because it bridges the gap between business context and technical implementation.
🚫 Common Issues
| Issue | Impact | Root Cause |
|---|---|---|
| Protocol Ambiguity | Developers don’t know how to connect | Missing labels on relationship lines |
| Mixing Concerns | Unclear ownership of services | Monolithic containers listed as microservices |
| Missing Dependencies | Build failures due to unknowns | Third-party libraries not modeled |
| Visual Clutter | Diagram is unreadable | Too many lines crossing each other |
✅ Resolution Steps
Refining the Container Diagram requires a focus on the data flow and the technology stack. Follow these guidelines to improve clarity:
- Label Relationships: Every line connecting containers must have a label indicating the protocol (e.g., HTTP, gRPC, SQL, AMQP).
- Group by Domain: If possible, visually group containers that belong to the same business domain using color or proximity.
- Define Boundaries: Ensure that a container represents a deployable unit. Do not split a single service into two containers unless there are distinct deployment requirements.
- Limit Interactions: If a container connects to ten others, consider if the system is too coupled. A healthy architecture limits direct dependencies.
⚙️ Level 3 & 4: Component and Code Diagrams
As you drill down into Components and Code, the risk of the diagram becoming too detailed increases significantly. These levels are often the first to be abandoned during maintenance because they change frequently with every code commit.
🚫 Common Issues
- Implementation Leakage: Showing internal class structures that change weekly instead of stable interfaces.
- Static Snapshots: Diagrams that reflect a specific point in time but ignore the dynamic nature of the software.
- Ignored Exceptions: Failing to show error handling paths, making the diagram look like it only works in ideal conditions.
- Abstraction Leaks: Mixing high-level business logic with low-level database queries in the same view.
✅ Resolution Steps
To keep these lower levels useful, you must enforce strict abstraction rules:
- Focus on Interfaces: Show the public API of a component, not every private method.
- Use Grouping: Organize components into packages or namespaces to reduce visual noise.
- Limit Depth: If you need a fifth level to explain a feature, the feature is likely too complex. Simplify the system or create a separate deep-dive document.
- Review Regularly: Set a schedule to review these diagrams. If they have not been updated in three months, they are likely stale.
🔄 Consistency and Maintenance Issues
Even if individual diagrams are accurate, the collection as a whole can fail if consistency is not maintained. Inconsistencies lead to cognitive load, forcing readers to constantly re-orient themselves.
🚫 Common Issues
- Naming Conflicts: Using “User Service” in one diagram and “Auth Module” in another for the same component.
- Visual Inconsistency: Changing color schemes or icon styles between different diagrams.
- Version Drift: Diagram version 1.0 is linked, but the system is at version 2.5.
- Broken Links: Hyperlinks within the documentation that lead to 404 pages.
✅ Resolution Steps
Establishing a governance model helps maintain consistency without stifling creativity:
- Adopt a Naming Convention: Create a glossary of terms. Ensure that every component has a canonical name used across all levels.
- Standardize Visuals: Define a palette of colors. For example, always use blue for databases and green for web frontends.
- Version Control: Store diagrams in the same repository as the code. Use version control tags to link specific diagram versions to code releases.
- Automate Checks: If possible, use tools that validate the existence of links and the consistency of labels.
🧠 Audience and Communication Gaps
Often, the problem is not the diagram itself, but who is looking at it. A diagram designed for developers will confuse a product manager, and vice versa.
🚫 Common Issues
- Wrong Abstraction Level: Showing code classes to a business stakeholder.
- Jargon Overload: Using technical acronyms without definitions.
- Missing Business Context: Showing technical flows without explaining the business value.
✅ Resolution Steps
Segment your audience and tailor the documentation accordingly:
- Create Audience Profiles: Identify who needs to read the documentation. Are they architects, developers, or operations engineers?
- Provide Summaries: Add a high-level overview at the top of every document that explains the “why” before the “how”.
- Glossary Section: Include a dedicated section defining technical terms used in the diagrams.
- Feedback Loops: Allow readers to comment on the diagrams. If a diagram is confusing, ask the reader to explain where the confusion lies.
🛠️ Tooling and Format Problems
While we avoid specific product names, the choice of tooling impacts the longevity and usability of your diagrams. Certain formats are better suited for maintenance than others.
🚫 Common Issues
- Binary Formats: Saving diagrams as proprietary binary files that are hard to diff or version control.
- Image Only: Exporting diagrams as static images that cannot be edited without opening the original source.
- Rendering Errors: Diagrams that do not render correctly in different browsers or screen sizes.
- Manual Updates: Manually drawing lines and boxes instead of using a model-driven approach.
✅ Resolution Steps
Choose a workflow that prioritizes editability and automation:
- Use Text-Based Definitions: Where possible, define diagrams using text. This allows for version control diffs and easier collaboration.
- Separate Data from View: Keep the model (the data) separate from the rendering (the visual). This allows you to change how it looks without changing what it is.
- Ensure Export Options: Make sure your diagrams can be exported to PDF, PNG, and SVG for different use cases.
- Validate Rendering: Test your diagrams on mobile devices and different browsers to ensure they remain readable.
🛡️ Prevention Strategies
Once you have fixed the current issues, you need to prevent them from recurring. Documentation decay is natural; without active management, diagrams will become outdated.
- Integrate with CI/CD: Make diagram generation part of the build pipeline. If the code changes, the diagram should ideally update or flag a warning.
- Assign Ownership: Designate a specific role or team responsible for the architecture documentation. Do not leave it as an afterthought.
- Set Deadlines: Treat documentation updates like code reviews. Do not merge a feature without updating the relevant diagrams.
- Regular Audits: Schedule quarterly reviews of the documentation set. Check for broken links, stale actors, and inconsistent naming.
- Encourage Feedback: Create a culture where pointing out outdated documentation is rewarded, not punished.
🔍 Summary of Troubleshooting Actions
When you encounter issues with your C4 diagrams, follow this checklist to diagnose the root cause:
- Is the diagram still accurate to the current system state?
- Is the audience appropriate for the level of detail shown?
- Are the names and labels consistent across all diagrams?
- Is the tool used for editing allowing for easy versioning?
- Are the relationships and protocols clearly labeled?
- Is the visual design clean and free of clutter?
- Is there a clear process for updating the diagrams?
Addressing these points systematically will improve the reliability of your architectural documentation. It transforms the diagrams from static images into living documents that support the development lifecycle. By focusing on consistency, accuracy, and maintenance, you ensure that your architecture remains understandable as the system evolves. 🚀
🏁 Moving Forward
Documentation is a journey, not a destination. The C4 model provides the structure, but the discipline comes from the team. Regularly revisiting your diagrams, applying the troubleshooting steps outlined here, and maintaining a culture of clarity will keep your architecture documentation valuable. Remember that a diagram that is slightly outdated is better than no diagram at all, but the goal is to keep it fresh and accurate. Keep iterating, keep refining, and keep the communication clear. ✅
