Visualizing system interactions requires more than just showing that components talk to one another. It demands a clear representation of when they talk and how they wait for responses. Sequence diagrams are the standard tool for capturing this temporal flow. Without precise timing and synchronization rules, a diagram becomes a static map that fails to convey the dynamic nature of software execution. This guide explores the mechanics of time, order, and state changes within interaction modeling.
🕰️ Understanding the Timeline in Interaction Modeling
The fundamental axis of a sequence diagram is time. Unlike flowcharts that focus on decision logic, sequence diagrams prioritize chronological order. Every element on the page, from left to right, represents a progression of events. However, the vertical axis is where the magic happens. It defines the lifespan of each participant and the specific moments when actions occur.
To accurately model timing, one must understand the following core elements:
- Lifelines: These vertical dashed lines represent the existence of an object or participant over time. They are the backbone of the diagram.
- Messages: Arrows connecting lifelines denote communication. The direction and style of the arrow indicate the type of interaction.
- Activation Bars: Rectangular boxes on lifelines showing when an object is performing an action or waiting for a result.
- Focus of Control: This indicates the period during which an object is actively executing code.
When these elements are aligned correctly, the diagram tells a story of execution. If they are misaligned, the logic of the system becomes ambiguous. For instance, if a return message originates before the request message is fully processed, the model implies a logical impossibility.
🔄 Message Types and Synchronization
Synchronization is the mechanism by which participants coordinate their actions. In the context of sequence diagrams, this usually refers to how one participant waits for another to finish a task before proceeding. The type of arrow used determines the synchronization behavior.
1. Synchronous Calls
A synchronous call is the most common interaction pattern. When Participant A sends a message to Participant B, A waits for B to complete the task and return a response. This creates a blocking behavior where A cannot proceed until the work is done.
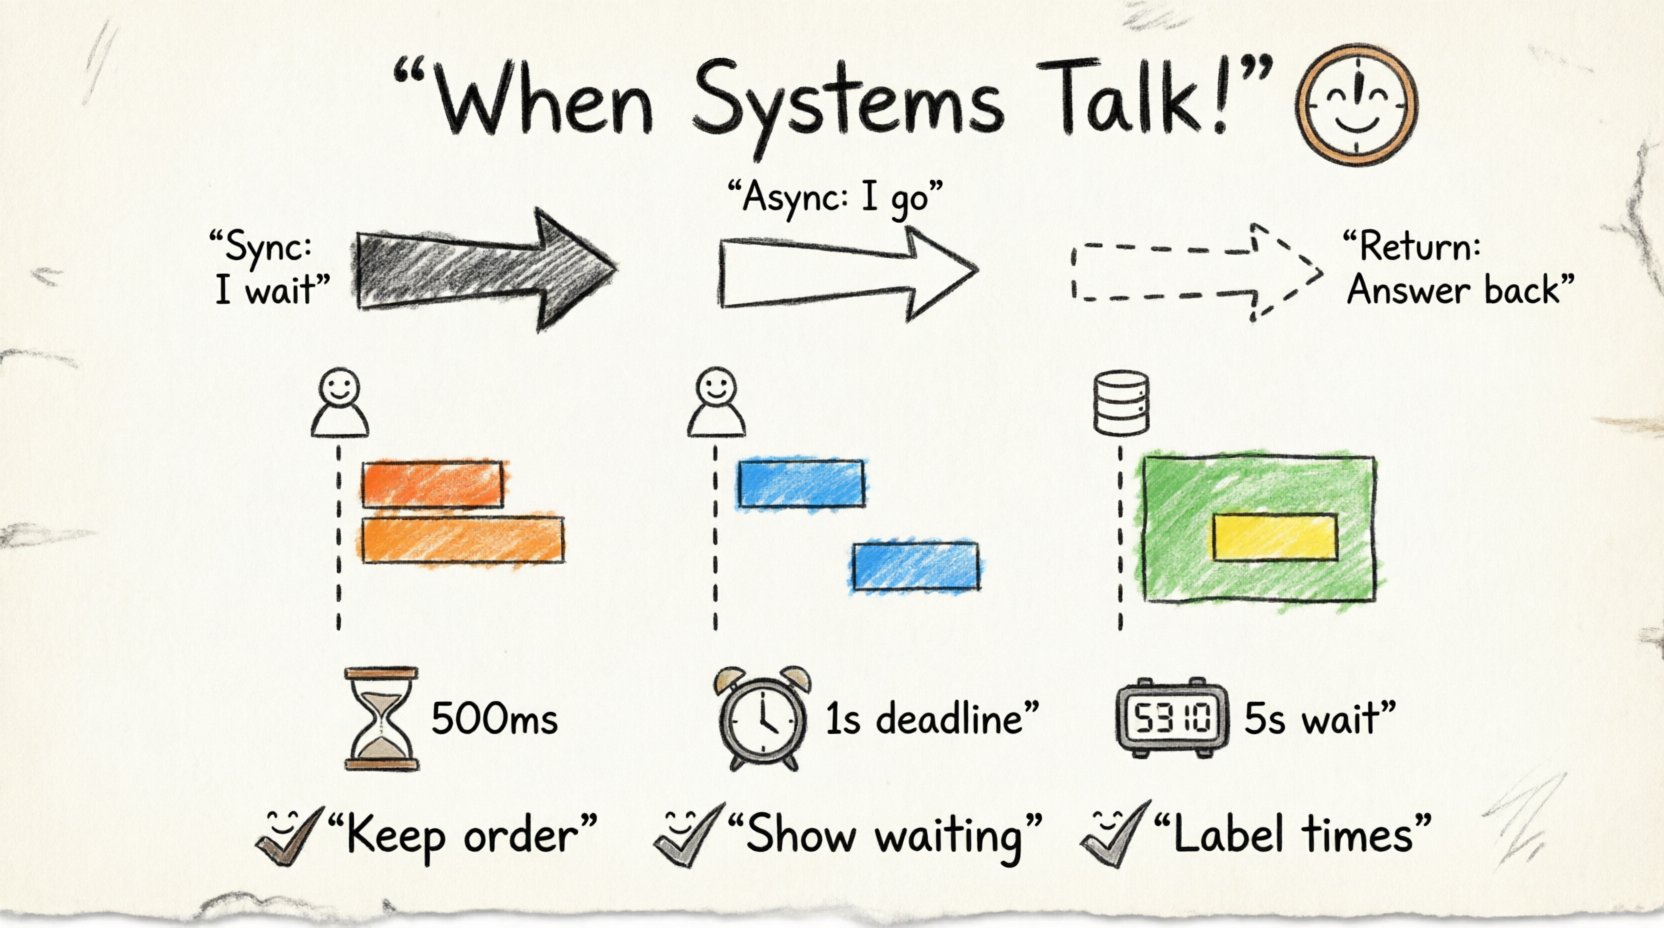
- Visual Indicator: A solid line with a filled arrowhead.
- Behavior: The sender pauses execution.
- Use Case: Retrieving data, processing a transaction, validating input.
In a synchronous scenario, the activation bar of the sender extends downwards, overlapping with the activation bar of the receiver. This overlap visually confirms that the sender is active (waiting) while the receiver is processing.
2. Asynchronous Calls
Asynchronous interactions allow the sender to continue its work immediately after sending a message. This is crucial for performance-heavy systems or background tasks. The sender does not block; it fires the event and moves on.
- Visual Indicator: A solid line with an open arrowhead.
- Behavior: The sender continues execution without waiting.
- Use Case: Logging events, sending notifications, background processing.
Because the sender does not wait, the activation bar of the sender often ends before the receiver’s activation bar begins or continues past the point where the receiver is still working. This visual separation is key to distinguishing asynchronous flows.
3. Return Messages
Return messages represent the response flowing back to the caller. These are typically depicted as dashed lines with open arrowheads. They close the loop of the interaction.
- Timing: Must appear after the processing time of the receiver.
- Content: Often carries a value or status code.
| Message Type | Arrow Style | Blocking? | Typical Use |
|---|---|---|---|
| Synchronous Call | Solid line, filled head | Yes | Data retrieval, Command execution |
| Asynchronous Call | Solid line, open head | No | Event firing, Notifications |
| Return Message | Dashed line, open head | N/A | Response data, Status confirmation |
| Self-Call | Curved arrow on same line | Yes (Internal) | Recursive logic, Internal processing |
📊 Activation Bars and Focus of Control
Activation bars are the visual representation of the Focus of Control. They show exactly when an object is busy. Proper placement of these bars is essential for understanding synchronization points.
Overlapping Activation
When a synchronous call occurs, the sender’s activation bar continues downward while the receiver’s bar begins. This overlap signifies that the sender is in a waiting state. If the sender’s bar ends before the receiver’s bar begins, it implies the sender has already moved on, which contradicts the definition of a synchronous call.
Nested Activation
Complex systems often involve deeper levels of processing. If the receiver calls another component, a new activation bar appears nested within the first one. This creates a visual hierarchy that mirrors the call stack.
- Level 1: User Interface sends request.
- Level 2: Controller processes logic.
- Level 3: Database retrieves data.
Each level must be clearly nested to show the dependency chain. If these bars are drawn side-by-side instead of nested, it suggests parallel execution rather than a sequential dependency.
⏳ Handling Time Constraints and Dependencies
Standard sequence diagrams show logical order, but real-world systems often have strict time requirements. Modeling these constraints ensures that the design meets performance and reliability goals.
Time Intervals
It is possible to specify that a message must be sent within a certain time frame after another event. This is often represented with a note or a specific label near the message arrow.
- Example: “Response must arrive within 500ms”.
- Visual: A dashed line or note attached to the return message.
Deadlines and Exceptions
What happens if a timeout occurs? A robust diagram accounts for failure scenarios. If a message is not received within the defined time, an exception flow should be triggered.
| Constraint Type | Notation | Meaning |
|---|---|---|
| Time Interval | [0..100ms] | Action must happen between 0 and 100 milliseconds. |
| Deadline | [deadline: 1s] | Action must complete before 1 second passes. |
| Wait Time | [wait: 5s] | System waits for 5 seconds before retrying. |
These constraints are not just for documentation; they inform the testing strategy. If the diagram specifies a 1-second deadline, automated tests must verify that the system responds within that window.
📡 Asynchronous vs Synchronous Interactions
Distinguishing between these two modes is critical for system architecture. Confusing them can lead to performance bottlenecks or race conditions.
When to Use Synchronous
Use synchronous interactions when the result of the operation is immediately required for the next step.
- The current process cannot continue without the data.
- Consistency is required immediately across components.
- The caller needs to know success or failure before proceeding.
When to Use Asynchronous
Use asynchronous interactions when the operation can be decoupled from the main flow.
- High-frequency events that should not slow down the user.
- Background tasks like sending emails or generating reports.
- Systems that need to scale independently.
In a diagram, the distinction is clear. A synchronous call creates a dependency chain where the next step cannot happen. An asynchronous call creates a parallel path where the next step can proceed independently.
❌ Common Errors in Timing Representation
Even experienced designers make mistakes when modeling time. Recognizing these pitfalls helps maintain the integrity of the documentation.
- Missing Return Messages: Forgetting to draw the return arrow implies the operation is fire-and-forget, which may be incorrect for a synchronous call.
- Incorrect Activation Overlap: If the sender’s activation bar stops too early during a synchronous call, it suggests the sender finished its work before the receiver started, which is logically impossible.
- Mixing Message Types: Using a solid arrow for a background task and a dashed arrow for a critical response can confuse readers about the urgency and blocking nature of the flow.
- Ignoring Timeouts: Failing to show what happens when a network call fails leaves the system design incomplete. Error paths are part of the timing flow.
- Parallelism Ambiguity: Drawing messages at the same vertical level implies parallel execution. If they are meant to be sequential, they must be staggered vertically.
✨ Best Practices for Clarity
Clarity in sequence diagrams is achieved through consistency and adherence to standards. Following these guidelines ensures that stakeholders can interpret the timing and synchronization without confusion.
1. Maintain Vertical Alignment
Keep related messages aligned vertically where possible. If Message A leads to Message B, B should appear directly below A. This reduces the cognitive load required to trace the flow.
2. Limit Complexity
One diagram should not try to show every possible interaction. Break complex flows into multiple diagrams.
- Primary Flow: The happy path.
- Alternative Flow: Handling errors or exceptions.
- Extension Flow: Optional features or side effects.
3. Use Combined Fragments
For complex logic like loops or conditional timing, use combined fragments (frames). These boxes allow you to group related interactions without cluttering the main flow.
- alt: Alternative paths (if/else).
- loop: Iterative processes.
- opt: Optional interactions.
4. Annotate Timing Explicitly
Do not assume the reader knows the latency expectations. Add notes to the diagram to specify time constraints, especially for external systems.
🛠️ Modeling Real-World Scenarios
Applying these concepts to real scenarios helps solidify understanding. Below are examples of how timing and synchronization manifest in different contexts.
Scenario 1: User Login
When a user enters credentials, the system must synchronize the request with the database.
- Client sends login request (Synchronous).
- Server validates credentials (Processing).
- Server queries Database (Synchronous).
- Database returns result (Return Message).
- Server sends authentication token (Return Message).
Each step blocks the previous one. If the database is slow, the user waits. The diagram must reflect this waiting period via the activation bars.
Scenario 2: Order Processing
Order processing often involves multiple independent steps.
- Client submits order.
- System sends payment request (Synchronous).
- System sends inventory check (Asynchronous).
- System sends confirmation email (Asynchronous).
Here, the inventory and email do not block the payment confirmation. The diagram should show the payment return message ending the active wait, while the inventory and email bars continue or start independently.
🧩 Advanced Timing Concepts
For highly complex systems, basic arrows may not suffice. Advanced notations help convey nuanced timing behaviors.
Message Ordering
Not all messages arrive in the order they are sent, especially in distributed systems. You can use notes to indicate that message delivery is not guaranteed or that reordering might occur.
Timeout Handling
Explicitly modeling timeouts prevents the assumption that a system will wait forever. Show a dashed line indicating a timeout event, leading to an error handler or retry mechanism.
Reentrancy
In some systems, a component may receive a new request while it is still processing an old one. This requires nested activation bars on the same lifeline, showing the second request entering before the first one exits.
🔍 Reviewing Your Diagrams
Before finalizing a sequence diagram, run through a checklist to ensure timing and synchronization are accurate.
- Are all synchronous calls showing overlapping activation bars?
- Do asynchronous calls show the sender continuing before the receiver finishes?
- Are all return messages clearly distinguished from calls?
- Is the vertical order of messages consistent with the logical flow?
- Are time constraints labeled where necessary?
- Do error paths have corresponding timing representations?
Regular review ensures the documentation remains a reliable source of truth for the development team. As systems evolve, the diagrams must evolve with them to maintain accuracy.
🏁 Final Considerations
Timing and synchronization are the invisible threads that hold the logic of a sequence diagram together. They transform a static list of interactions into a dynamic representation of system behavior. By carefully managing activation bars, message types, and time constraints, you create a blueprint that guides development and testing effectively.
Focus on clarity over complexity. If a diagram is too crowded, split it. If a timing constraint is critical, label it. The goal is to communicate the flow of control and data with precision. This precision reduces ambiguity, minimizes errors during implementation, and ensures that all stakeholders share a common understanding of how the system operates under time pressure.
Invest time in getting the timing right. It is the difference between a diagram that merely looks correct and one that actually models the system accurately.

