


The landscape of software development has shifted dramatically over the past decade. As systems grow in complexity, the need for clear communication between architects, developers, and stakeholders becomes critical. Sequence diagrams have long served as a cornerstone for visualizing interactions, yet their role is evolving. We are moving away from static representations toward dynamic, automated, and integrated workflows. This guide explores how sequence diagrams are adapting to meet the demands of contemporary engineering practices.
At their core, sequence diagrams describe the flow of messages between objects or components over time. While the UML standard remains the foundation, the application of these diagrams is changing. Engineers no longer view them merely as documentation artifacts created once and filed away. Instead, they are becoming living documents that drive testing, validation, and deployment pipelines.
Why Sequence Diagrams Matter Today 📊
In an era dominated by distributed systems and cloud-native architectures, understanding data flow is paramount. A sequence diagram provides a temporal view of system interactions that other diagrams, like class or component diagrams, cannot offer. It answers the question: “What happens when this event occurs?”
Consider a modern e-commerce platform. When a user places an order, dozens of services interact. The inventory service checks stock, the payment gateway processes funds, and the notification service sends an email. Without a clear map of these interactions, debugging becomes a guessing game. Sequence diagrams clarify the order of operations, the participants involved, and the timing constraints.
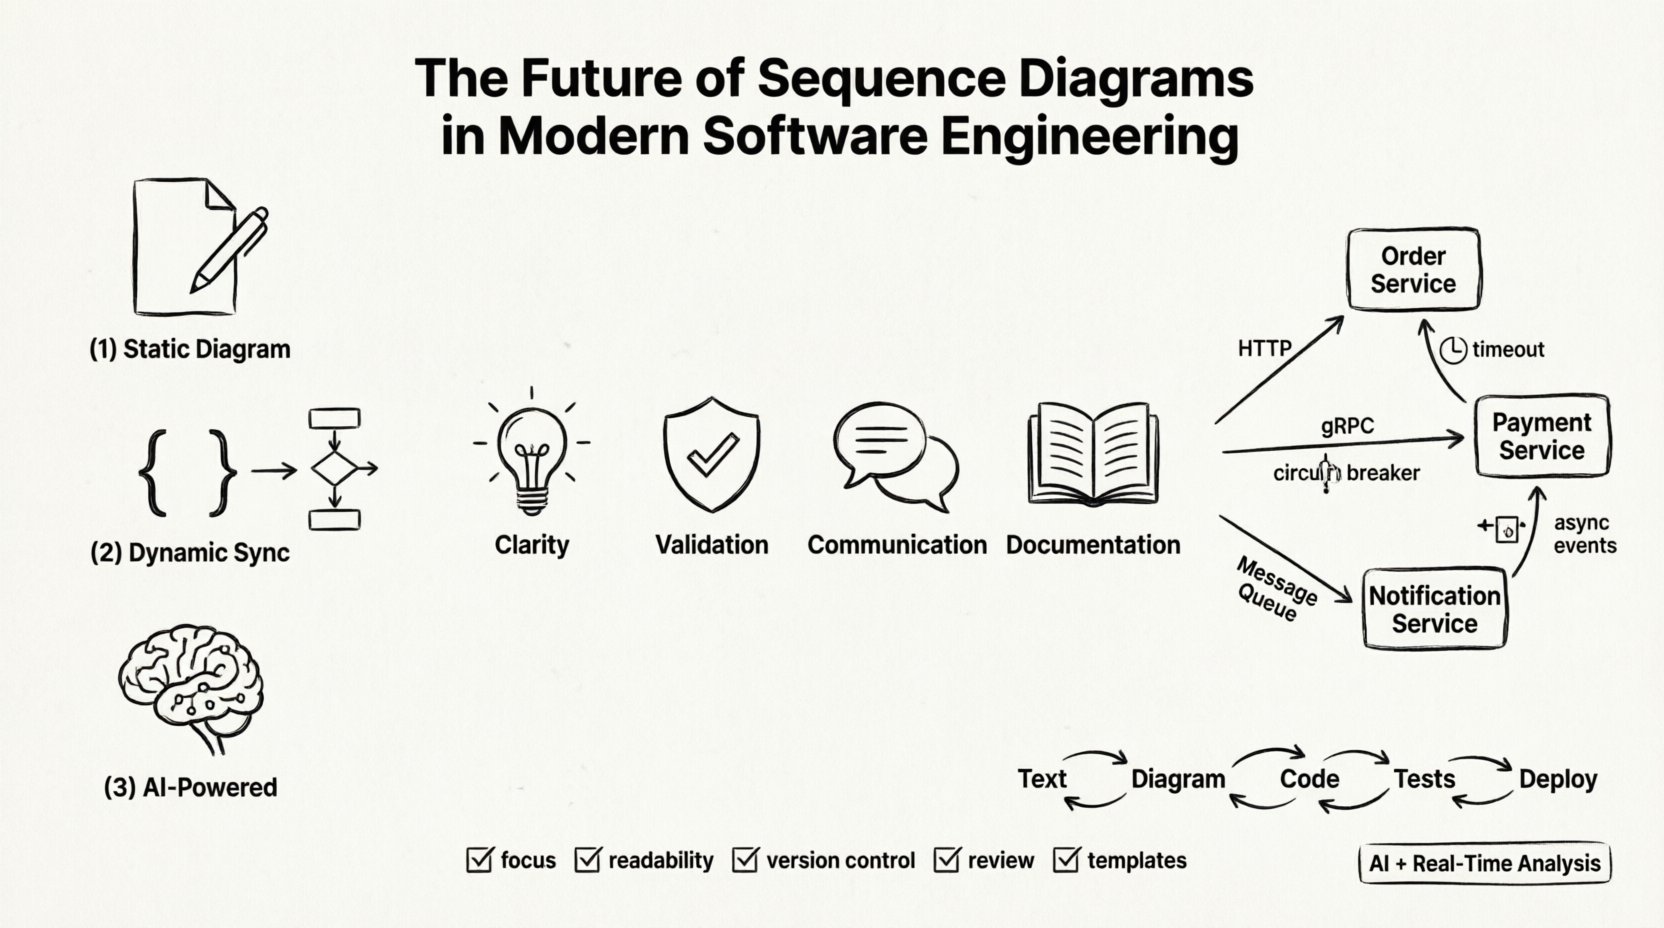
Clarity: They reduce ambiguity in complex logical flows.
Validation: They allow teams to verify requirements before coding begins.
Communication: They bridge the gap between technical and non-technical stakeholders.
Documentation: They serve as a reference for onboarding new team members.
However, the traditional approach of drawing diagrams in isolation is becoming obsolete. The future lies in integration with the codebase and the CI/CD pipeline.
Shift from Static to Dynamic 📈
Historically, sequence diagrams were created manually using drawing tools. Once the code changed, the diagram often became outdated. This disconnect led to documentation rot, where the visual representation no longer matched the reality of the software. Modern engineering demands a shift from static documentation to dynamic synchronization.
One significant development is the move towards model-driven engineering. In this approach, the diagram is not just a picture; it is a source of truth. Tools can parse the diagram to generate code skeletons or stubs. This ensures that the implementation aligns with the design intent.
Another trend is the use of runtime analysis. Instead of drawing a diagram based on a design specification, engineers can capture actual runtime traces. These traces are then rendered into sequence diagrams automatically. This provides a high-fidelity view of how the system behaves in production.
This shift offers several advantages:
Accuracy: The diagram reflects actual behavior, not theoretical design.
Maintenance: Updates happen automatically when the code or trace data changes.
Debugging: Engineers can compare expected behavior (design) against actual behavior (traces).
Integration with Microservices Architecture 🏗️
The rise of microservices has complicated the traditional monolithic view. In a monolith, components reside in the same process. In a microservices environment, services communicate over a network, introducing latency, failure points, and asynchronous messaging.
Sequence diagrams are essential for visualizing these distributed interactions. They help identify bottlenecks and understand the impact of network failures. For example, a diagram can show a timeout occurring between Service A and Service B, prompting the need for a circuit breaker pattern.
Asynchronous communication is common in these systems. Traditional sequence diagrams often struggle with asynchronous events, but modern notations have evolved to handle message queues and event streams. Engineers now include events like “Message Published” and “Message Consumed” to accurately represent event-driven architectures.
The following table highlights the differences between traditional and microservice-aware sequence diagrams:
Feature | Traditional Monolith | Modern Microservices |
|---|---|---|
Communication | Method Calls | HTTP, gRPC, Message Queues |
Timing | Immediate | Asynchronous, Delayed, Batched |
Failure Handling | Exceptions | Retries, Circuit Breakers, Dead Letter Queues |
Scope | In-process | Network-bound, Distributed |
Understanding these distinctions is vital for designing resilient systems. The diagram becomes a blueprint for resilience, not just functionality.
Automation and Code Generation 🤖
Automation is a key driver in the future of sequence diagrams. The goal is to reduce the manual overhead of creating and maintaining visualizations. Several approaches are emerging to achieve this.
Text-to-Diagram: Engineers can write descriptions in a simple text format, and the tool renders the diagram. This allows diagrams to be stored in version control alongside the code. Changes to the text trigger updates to the visual output.
Code-to-Diagram: Advanced tools can analyze the codebase and generate sequence diagrams for specific function calls. This is particularly useful for legacy code refactoring. It provides an instant map of dependencies and call hierarchies without manual tracing.
Test-to-Diagram: Automated tests often contain the logic of interactions. By instrumenting tests, the execution path can be captured and rendered as a sequence diagram. This links the diagram directly to the quality assurance process.
Automation ensures that diagrams remain relevant. If a developer changes a function signature, the diagram updates. This keeps the documentation in sync with the codebase, eliminating the common issue of stale documentation.
Challenges in Complex Systems ⚠️
Despite the benefits, there are challenges in applying sequence diagrams to modern systems. The complexity of distributed systems can lead to diagrams that are difficult to read. A single request might traverse dozens of services, resulting in a visual that spans multiple pages.
Scalability: Large diagrams can overwhelm the reader. Engineers must use abstractions, such as grouping services into subsystems or using frames to show nested interactions.
State Management: Sequence diagrams focus on messages, but state changes are critical in many systems. Capturing state transitions within a sequence diagram requires careful notation. Often, separate state diagrams are needed to complement the interaction flow.
Concurrency: Modern systems handle multiple requests simultaneously. A standard sequence diagram shows one flow at a time. Representing concurrent threads or parallel processing requires specific notations that can be easily misunderstood.
Addressing these challenges requires discipline. Teams must agree on standards for notation, levels of abstraction, and when to use a diagram versus a log trace. Consistency is key to maintaining utility.
Best Practices for Implementation ✅
To ensure sequence diagrams remain effective, teams should adopt specific practices. These guidelines help maintain clarity and utility over the long term.
Focus on the Flow: Do not include every single method call. Focus on the critical path and the interactions that matter for the specific use case.
Keep it Readable: Use labels that are meaningful. Avoid technical jargon that only the original author understands.
Version Control: Store diagrams in the same repository as the code. This ensures they are updated when the code changes.
Review Regularly: Treat diagrams as code. Include them in code reviews to ensure the design matches the implementation.
Use Templates: Create standard templates for common patterns, such as authentication or payment processing. This reduces the cognitive load on the designer.
By following these practices, teams can maintain a high level of documentation quality without incurring excessive maintenance costs.
Future Trends: AI and Real-Time Analysis 🚀
Looking ahead, artificial intelligence will play a significant role in how sequence diagrams are created and maintained. AI models can analyze large codebases to suggest diagrams for complex modules. They can identify patterns that humans might miss, such as potential race conditions or inefficient call chains.
Real-time analysis is another frontier. Instead of generating a diagram after the fact, tools could visualize the system state as it happens. This would allow engineers to see the flow of requests in a production environment without stopping the service.
Furthermore, the integration of sequence diagrams into low-code platforms is increasing. These platforms allow designers to build applications using visual flows, where the underlying logic is automatically generated. In this context, the sequence diagram becomes the primary interface for development.
These trends suggest a future where the boundary between design and implementation blurs. The diagram is no longer just a representation; it is an active part of the development lifecycle.
Conclusion on Evolution and Adaptation 🛠️
The evolution of sequence diagrams reflects the broader evolution of software engineering. As systems become more distributed, complex, and dynamic, the tools used to understand them must adapt. Sequence diagrams are not disappearing; they are transforming.
From static drawings to dynamic, automated visualizations, the focus has shifted towards accuracy and integration. Teams that embrace these changes will find themselves better equipped to manage complexity and deliver reliable software.
The future is not about choosing between diagrams and code. It is about making them work together seamlessly. By leveraging automation, embracing microservice patterns, and maintaining rigorous standards, engineers can ensure that sequence diagrams remain a vital tool in the modern software engineering toolkit.

