Designing complex software systems requires more than just writing code. It demands a clear visualization of how different parts of an application communicate with one another. Sequence diagrams serve this purpose by mapping out interactions over time. This comprehensive guide focuses on the two foundational pillars of sequence diagrams: lifelines and messages. By mastering the structure and semantics of these elements, you can create diagrams that communicate system behavior effectively without ambiguity.
Understanding the Core Components 🧱
Before drawing a single line, it is essential to understand what a sequence diagram represents. It is an interaction diagram that details how operations are carried out. It captures the dynamic behavior of a system by showing object interactions arranged in time sequence. The diagram is read from top to bottom, where the top represents the start of the interaction and the bottom represents the end.
Lifelines: The Actors and Objects 📏
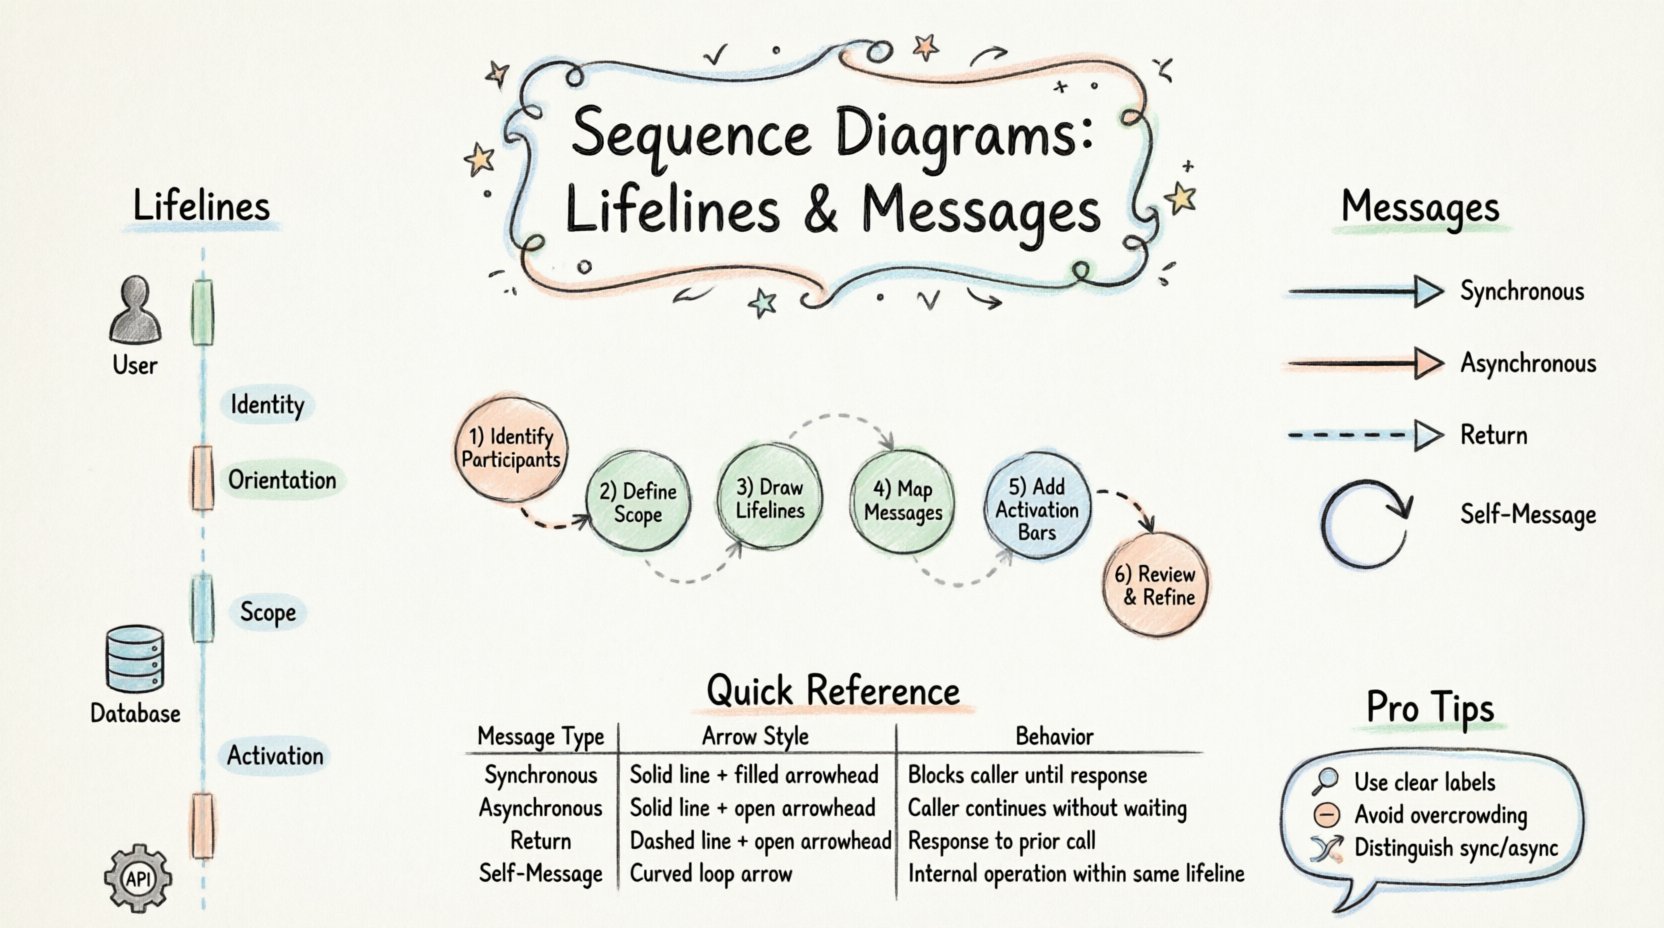
Lifelines represent the participants in an interaction. They can be a human actor, a class, a subsystem, or an external service. In the diagram, a lifeline appears as a vertical dashed line extending from the top to the bottom of the diagram. This line represents the existence of the participant throughout the interaction.
When constructing a lifeline, consider the following aspects:
- Identity: Each lifeline must have a unique name. This name typically corresponds to the class or component being modeled.
- Orientation: Lifelines are always vertical. This orientation signifies the passage of time.
- Scope: A lifeline starts at the top of the diagram and ends where the participant is no longer relevant to the current interaction.
- Activation: During the interaction, the participant may become active. This is visually represented by a thin rectangle drawn on the lifeline.
The activation bar indicates the period during which the object is performing an action or is waiting for a response. It is crucial to distinguish between the existence of the object and the time it is actively processing. An object can exist (lifeline) without being active (no activation bar).
Messages: The Flow of Communication 💬
Messages represent the communication between lifelines. They are depicted as horizontal arrows connecting one lifeline to another. The arrow points from the sender to the receiver. Messages can take various forms depending on the nature of the interaction.
Key characteristics of messages include:
- Direction: Arrows point from the sender to the receiver.
- Type: Different arrow styles indicate different message behaviors (synchronous, asynchronous, return).
- Label: A label identifies the operation or data being passed.
- Timing: The vertical position of the message implies when it occurs relative to other events.
By carefully arranging messages, you create a narrative of the system’s operation. The sequence of arrows tells the story of data flow and control flow.
Constructing the Diagram: A Process 🛠️
Creating a sequence diagram is not a random act of drawing lines. It follows a logical progression that ensures clarity and accuracy. Follow this structured approach to build your diagrams.
Step 1: Identify the Participants 🎯
Begin by listing all the entities involved in the scenario. These could be:
- External users (Actors)
- Frontend components (Controllers, Views)
- Backend services (APIs, Databases)
- Third-party integrations (Payment Gateways, Email Services)
Place these participants across the top of the diagram. Arrange them in a logical order. Often, the initiator of the action is placed on the far left or far right, depending on the reading preference of your team.
Step 2: Define the Scenario Scope 📝
What specific flow are you documenting? Is it a login process? A data retrieval operation? A payment transaction? Define the start and end points of the interaction. This scope determines which lifelines are necessary. Do not include participants that are not directly involved in this specific flow.
Step 3: Draw the Lifelines 📏
Draw vertical dashed lines downward from each participant. Ensure the spacing is even. Uneven spacing can make the diagram look cluttered and difficult to read. If a participant is not needed for the entire duration of the interaction, you may stop the line early, though standard practice often extends the line to the bottom for consistency.
Step 4: Map the Messages ➡️
Draw horizontal arrows between the lifelines. Start with the initial trigger message. Then, follow the logical flow of the system. If A sends a message to B, B may send a message to C. Ensure the arrows do not cross unnecessarily. If they must cross, maintain clear labels to avoid confusion.
Step 5: Add Activation Bars 🟢
Identify where the objects are actively processing. Place thin rectangles on the lifelines where the object is busy. For example, if B receives a message and immediately processes it, draw an activation bar on B’s lifeline starting at the point of receipt.
Step 6: Review and Refine 🔍
Once the diagram is drafted, review it against the requirements. Does it accurately reflect the system logic? Are all messages necessary? Is the flow logical? Remove any redundant steps. Clarity is the primary goal.
Types of Messages Explained 🚦
Not all messages are created equal. The visual representation of the arrow conveys specific information about how the sender expects the receiver to respond. Understanding these distinctions is vital for accurate modeling.
| Message Type | Arrow Style | Behavior |
|---|---|---|
| Synchronous Call | Solid line, filled arrowhead | Sender waits for a response before continuing. |
| Asynchronous Call | Solid line, open arrowhead | Sender sends data and continues without waiting. |
| Return Message | Dashed line, open arrowhead | Receiver sends a response back to the sender. |
| Self-Message | Solid line, looped arrow | Object calls a method on itself. |
Synchronous Messages
This is the most common type of interaction. The sender blocks execution until the receiver completes the operation and returns control. In a sequence diagram, this is shown as a solid line with a filled arrowhead. This implies a blocking call. If the receiver takes time to process, the sender waits.
Asynchronous Messages
In modern distributed systems, non-blocking calls are frequent. The sender transmits the message and moves on to other tasks immediately. It does not wait for the receiver to finish. This is depicted with a solid line and an open arrowhead. This is useful for logging, notifications, or fire-and-forget scenarios.
Return Messages
Every synchronous message usually expects a return. This is shown as a dashed line with an open arrowhead pointing back to the original sender. It indicates the completion of the operation and the return of data or status.
Self-Messages
Sometimes an object needs to call a method on itself. This is common when an object delegates work to an internal helper method. The arrow starts and ends on the same lifeline, curving back to itself.
Managing Lifeline States 🟢
The visual state of a lifeline provides context about the object’s status. The activation bar is the primary indicator of this state. However, there are nuances to consider.
| State | Visual Indicator | Meaning |
|---|---|---|
| Idle | Dashed line only | Object exists but is not processing. |
| Active | Rectangular box on line | Object is executing an operation. |
| Destroyed | X mark at bottom | Object is removed from memory. |
When an object is destroyed, it is marked with an X at the bottom of the lifeline. This indicates that the object’s lifecycle has ended within the context of the interaction. This is common in scenarios where temporary objects are created and discarded after a specific task.
Handling Complex Interactions 🔄
Real-world systems rarely involve a simple linear path. They include loops, conditional logic, and optional steps. Sequence diagrams handle these through Combined Fragments.
Alt (Alternative)
Use the alt fragment to represent conditional logic. It divides the interaction into different frames based on conditions. For example, if a user is logged in, one path is taken; if not, another is taken. This is drawn as a rectangle with a border labeled alt containing different conditions.
Loop
The loop fragment represents repeated interactions. If a system iterates through a list of items to process each one, use a loop frame. You can specify the iteration count or condition within the frame header.
Opt (Optional)
The opt fragment indicates a single path that may or may not occur. It is similar to alt but implies that the alternative path is simply doing nothing. For example, sending an email notification only if the user has opted in.
Break
The break fragment represents an exceptional path. It is used when an error occurs or a specific condition interrupts the normal flow. This is useful for modeling error handling scenarios.
Common Pitfalls to Avoid ⚠️
Even experienced designers make mistakes when creating sequence diagrams. Being aware of common errors can save time during reviews.
- Overcrowding: Putting too many messages on a single diagram makes it unreadable. Split complex flows into multiple diagrams.
- Ambiguous Labels: Use clear operation names. Avoid generic labels like Process or Do. Use specific names like ValidateInput or CalculateTax.
- Incorrect Arrow Types: Mixing up synchronous and asynchronous arrows can mislead developers about performance expectations.
- Ignoring Return Messages: Forgetting to draw return arrows for synchronous calls can confuse the flow of control.
- Ignoring Time: Sequence diagrams are time-dependent. Ensure the vertical order of messages makes sense chronologically.
Best Practices for Clarity ✨
To ensure your diagrams are effective communication tools, adhere to these guidelines.
- Consistent Naming: Use the same naming convention for classes and methods throughout the diagram.
- Logical Grouping: Group related messages together. If a series of messages constitutes a single logical step, keep them close vertically.
- White Space: Use vertical space to separate distinct phases of the interaction. Do not cram everything together.
- Context Labels: If the diagram covers a specific scenario, label the frame with the scenario name (e.g., Checkout Flow).
- Documentation: Add notes to the diagram to explain complex logic or constraints that cannot be easily shown with lines and arrows.
Reviewing Your Work 🔎
After drafting the diagram, perform a walkthrough. Imagine yourself as the system. Start at the top and follow the arrows. Does the logic hold up? Are there any dead ends? Is there a path where the system waits indefinitely? This mental simulation is a powerful way to validate the design.
Share the diagram with peers. Different perspectives often catch errors that the creator misses. Ask specific questions like, What happens if this message fails? or Is this message necessary for this step? This feedback loop improves the accuracy of the design.
Summary of Key Takeaways 🎓
Sequence diagrams are powerful tools for visualizing system interactions. Lifelines represent the participants, and messages represent the communication between them. By following a structured process, you can create diagrams that clarify complex logic.
Remember these core principles:
- Use vertical lifelines to show time and participants.
- Use arrows to show messages and their direction.
- Use activation bars to show when objects are busy.
- Distinguish between synchronous and asynchronous calls.
- Use fragments for loops and conditions.
By paying attention to these details, you create documentation that serves as a reliable blueprint for development. Clear diagrams reduce misunderstandings between stakeholders and developers, leading to more efficient implementation. Focus on accuracy and readability above all else.
As you continue to practice, you will develop an intuitive sense for how to represent complex flows. The goal is not just to draw lines, but to tell a clear story of how the system works. With patience and attention to detail, your sequence diagrams will become an invaluable asset in your software design toolkit.

