Understanding how components within a system interact is a fundamental skill for Information Systems students. While high-level planning involves use cases and architecture, the actual flow of data and control requires precision. This is where sequence diagrams become essential. They provide a visual representation of interactions between objects over time. For IS students, mastering this notation is not just about drawing lines; it is about communicating logic, identifying bottlenecks, and ensuring system reliability.
This guide walks through the mechanics, best practices, and practical applications of sequence diagrams. It focuses on the core principles of UML modeling without relying on specific commercial tools. Whether you are designing a database transaction or a user authentication flow, these diagrams serve as the blueprint for development.
🔍 What is a Sequence Diagram?
A sequence diagram is a type of interaction diagram. It shows how objects operate with one another and in what order. Unlike a class diagram, which focuses on static structure, a sequence diagram captures dynamic behavior. It is a time-based representation.
Time flows downwards: The top of the diagram represents the start of the interaction, while the bottom represents the end.
Focus on interactions: It highlights messages passed between participants.
Lifecycle awareness: It shows when objects are created and destroyed during the process.
For IS students, this tool bridges the gap between abstract requirements and concrete code. It allows you to simulate a scenario before writing a single line of logic.
🛠️ Core Elements of the Diagram
To construct a valid diagram, you must understand the building blocks. Each element serves a specific purpose in defining the system’s behavior.
1. Participants (Lifelines)
Participants represent the active entities in the system. They are drawn as vertical lines extending downwards from a box at the top.
Actors: External users or systems that initiate actions (e.g., Customer, Administrator).
Objects: Instances of classes within the system (e.g., ShoppingCart, UserSession).
Boundaries: Interfaces that handle input/output (e.g., LoginScreen, API Gateway).
Each lifeline represents the existence of an object over time. If a lifeline stops, the object may no longer be active in that context.
2. Messages
Messages are the arrows connecting lifelines. They indicate a call, a signal, or a return.
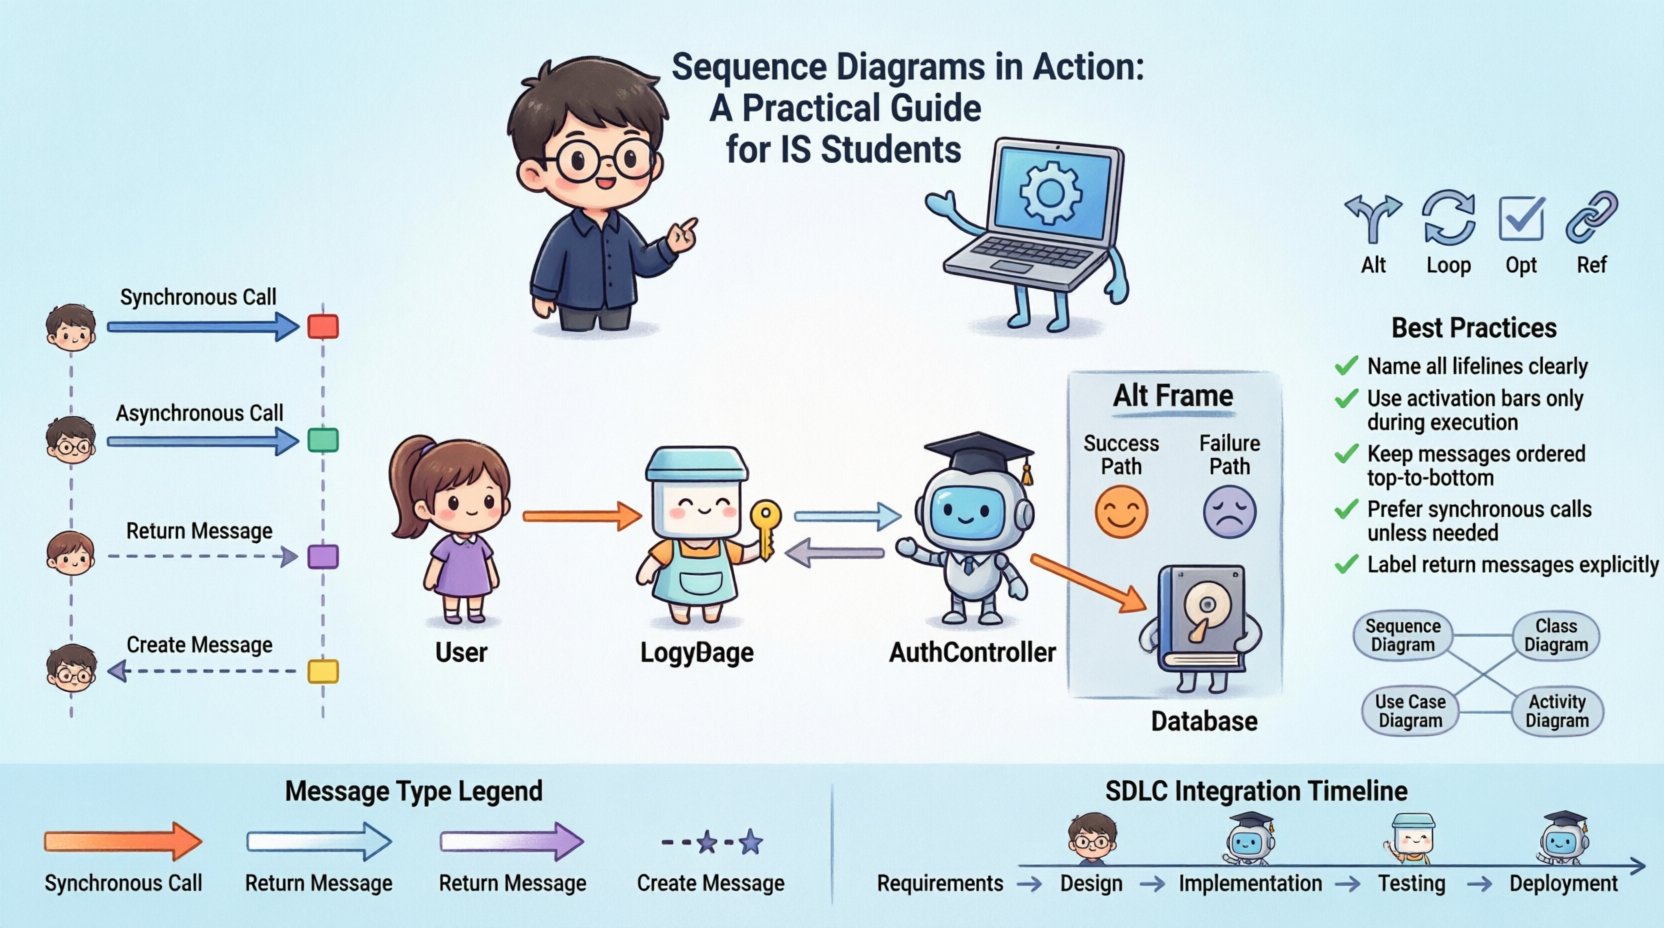
Synchronous Messages: The sender waits for a response before continuing. Represented by a solid line with a filled arrowhead.
Asynchronous Messages: The sender continues immediately without waiting. Represented by a solid line with an open arrowhead.
Return Messages: The response sent back to the caller. Represented by a dashed line with an open arrowhead.
3. Activation Bars
Also known as execution occurrences, these are thin rectangles placed on a lifeline. They indicate the period during which an object is performing an action or is active.
Starts when a message is received or created.
Ends when the action completes and a return message is sent.
📊 Comparing Message Types
Distinguishing between message types is crucial for accurate modeling. Here is a breakdown of how they function in a real system context.
Message Type | Visual Representation | Behavior | Use Case |
|---|---|---|---|
Synchronous | ──► | Caller waits for callee | Database Query |
Asynchronous | ──► (Open) | Caller proceeds immediately | Logging Event |
Return | ──◄ (Dashed) | Response to caller | Data Retrieval Result |
Create | ──► (Dashed) | New object instantiation | Session Start |
🧩 Advanced Interaction Fragments
Real-world systems rarely follow a single linear path. Sequence diagrams must handle branching, loops, and optional logic. These are managed using interaction fragments.
1. Alt (Alternative)
Used to represent conditional logic, similar to if-else statements in programming. The diagram splits into frames labeled with conditions.
Frame Label: [condition: true] or [condition: false]
Usage: Handling login failures vs. successes.
2. Opt (Optional)
Indicates that a specific interaction may or may not occur based on a condition.
Usage: Sending a confirmation email only if the user opts in.
3. Loop
Represents a repeated sequence of messages. Commonly used for processing lists or iterating through data.
Usage: Processing each item in a shopping cart.
4. Ref (Reference)
Used to include a sequence diagram within another diagram. This keeps complex diagrams clean and manageable.
Usage: Referencing a detailed “Checkout Process” from a high-level “Order Flow”.
📝 Best Practices for Design
Creating a diagram is easy; creating a good diagram requires discipline. Follow these guidelines to ensure clarity and utility.
Keep it focused: Do not try to capture the entire system in one diagram. Break it down into specific scenarios (e.g., “User Login”, “Password Reset”, “Payment Processing”).
Use meaningful names: Label participants and messages clearly. Avoid generic names like “Object1” or “Process”. Use domain language like “InventoryService” or “ValidateStock”.
Limit vertical space: If a diagram becomes too tall, it loses readability. Consider using the
Reffragment to break it down.Align message timing: Ensure that return messages align logically with the activation bars. A return should not appear before the action completes.
Standardize notation: Stick to standard UML conventions so other developers or students can read the diagram without confusion.
⚠️ Common Pitfalls to Avoid
Even experienced students make mistakes when modeling interactions. Being aware of these errors helps in producing higher quality artifacts.
Overcomplicating the flow: Including every possible error state in the main diagram makes it messy. Use
Altframes for exceptions or create separate diagrams for error handling.Mixing concerns: Do not mix UI logic with database logic in the same sequence unless they are directly interacting. Keep layers distinct.
Ignoring object creation: Often, objects must be instantiated before they can receive messages. Ensure lifelines are created at the appropriate point in the timeline.
Missing return messages: Every synchronous call should have a corresponding return path, even if it is just a null response.
Vague message names: “Do something” is not a valid message. Be specific: “FetchUserDetails”.
🔄 Integration into the Development Lifecycle
Sequence diagrams are not isolated artifacts. They play a role in the broader Software Development Life Cycle (SDLC).
1. Requirements Analysis
During this phase, diagrams help clarify user stories. They turn text-based requirements into visual flows. This reduces ambiguity early in the project.
2. Design Phase
Developers use these diagrams to understand the interface contracts. They define what data is passed and what is expected back. This guides API definition and method signatures.
3. Testing
QA engineers use the diagrams to create test cases. If a path in the diagram shows a failure condition, a corresponding test case should verify that behavior.
4. Documentation
New team members can study these diagrams to understand system flow without reading the entire codebase. They serve as living documentation.
🏗️ Practical Example: User Authentication Flow
Let us apply these concepts to a concrete scenario. Imagine a system where a user attempts to log in. We will trace the interaction between the User, the Login Interface, the Authentication Service, and the Database.
Scenario Steps
User Input: The user enters credentials into the interface.
Validation: The interface checks if the fields are not empty.
Request: The interface sends credentials to the Authentication Service.
Lookup: The Service queries the Database for the user record.
Verification: The Service compares the input hash with the stored hash.
Response: The Service returns a success token or an error message.
Feedback: The Interface displays the result to the User.
Diagram Structure
Here is how this flow translates into diagram elements.
Lifelines:
User,LoginPage,AuthController,UserDatabase.Messages:
User → LoginPage:
submitCredentialsLoginPage → AuthController:
authenticate(Synchronous)AuthController → UserDatabase:
findUser(Synchronous)UserDatabase → AuthController:
userRecord(Return)AuthController → UserDatabase:
verifyHash(Synchronous)UserDatabase → AuthController:
isValid(Return)AuthController → LoginPage:
loginSuccess(Return)LoginPage → User:
showDashboard(Asynchronous)
Activation Bars: Active on
AuthControllerfrom the momentauthenticateis received untilloginSuccessis returned.
Handling Failure
What happens if the password is wrong? Use an Alt frame.
Condition: [!isValid]
Interaction: AuthController → LoginPage:
loginFailureResult: LoginPage → User:
showError
This structure ensures that the diagram covers both the happy path and the exception path without cluttering the main flow.
🔗 Relationship with Other UML Diagrams
Sequence diagrams do not exist in isolation. They work in tandem with other diagrams to provide a complete picture of the system.
Diagram Type | Relation to Sequence Diagram |
|---|---|
Use Case Diagram | Provides the high-level scenarios that sequence diagrams detail. |
Class Diagram | Defines the objects (participants) and their attributes used in the sequence. |
State Machine Diagram | Can be combined to show state changes triggered during the sequence. |
When designing an IS solution, start with Use Cases to identify goals. Move to Class Diagrams to define structure. Finally, use Sequence Diagrams to define the interaction logic.
🎓 Tips for IS Students
Applying this knowledge in an academic or professional setting requires specific habits.
Start with the Actor: Always identify who initiates the interaction. The diagram should begin with the external trigger.
Keep it readable: If a diagram spans more than two pages, it is likely too complex. Refactor it.
Collaborate: Review your diagrams with peers. Misunderstandings in logic are often caught during discussion.
Iterate: Your first draft will not be perfect. Refine the message names and flow as you understand the requirements better.
Focus on data: Ensure that the data being passed is realistic. Don’t pass an entire database object if you only need an ID.
🚀 Moving Forward
Sequence diagrams are a powerful tool for clarity. They transform abstract requirements into concrete interaction models. For Information Systems students, proficiency in this area demonstrates a strong grasp of system dynamics.
By focusing on precise notation, logical flow, and clear communication, you create artifacts that are valuable to developers, stakeholders, and future maintainers. Remember that the goal is not just to draw a diagram, but to validate the system design. As you progress in your studies, continue to practice these patterns. Apply them to your projects and case studies. The more you model, the more intuitive the process becomes.
Effective design leads to robust systems. Start modeling today.

