Understanding how different parts of a software system talk to each other is a fundamental skill for any developer or architect. While code tells machines what to do, diagrams tell humans how the system works. Among the various tools available in the toolbox of system design, the sequence diagram stands out as a primary method for visualizing interactions over time. This guide is designed to help you navigate the world of interaction modeling with clarity and confidence.
A sequence diagram is a type of interaction diagram. It shows how objects or processes interact with one another in a specific order. Instead of focusing on the static structure of a system, like class diagrams do, sequence diagrams focus on the dynamic flow. They answer the question: “What happens when this event occurs, and in what order?”.
Why Use Sequence Diagrams? 🤔
Before diving into the syntax, it is essential to understand the value proposition. These diagrams serve as a bridge between abstract requirements and concrete implementation. They help teams align on logic before writing a single line of code.
- Clarification of Logic: They make complex flows visible. A story told in text can be misinterpreted; a visual flow reduces ambiguity.
- Identifying Bottlenecks: By mapping out calls and responses, you can spot where latency might occur or where a component is doing too much work.
- Communication: They are language-agnostic. A business analyst, a frontend developer, and a backend engineer can all look at the same diagram and understand the contract between services.
- Documentation: They provide a living record of system behavior that persists beyond the initial development phase.
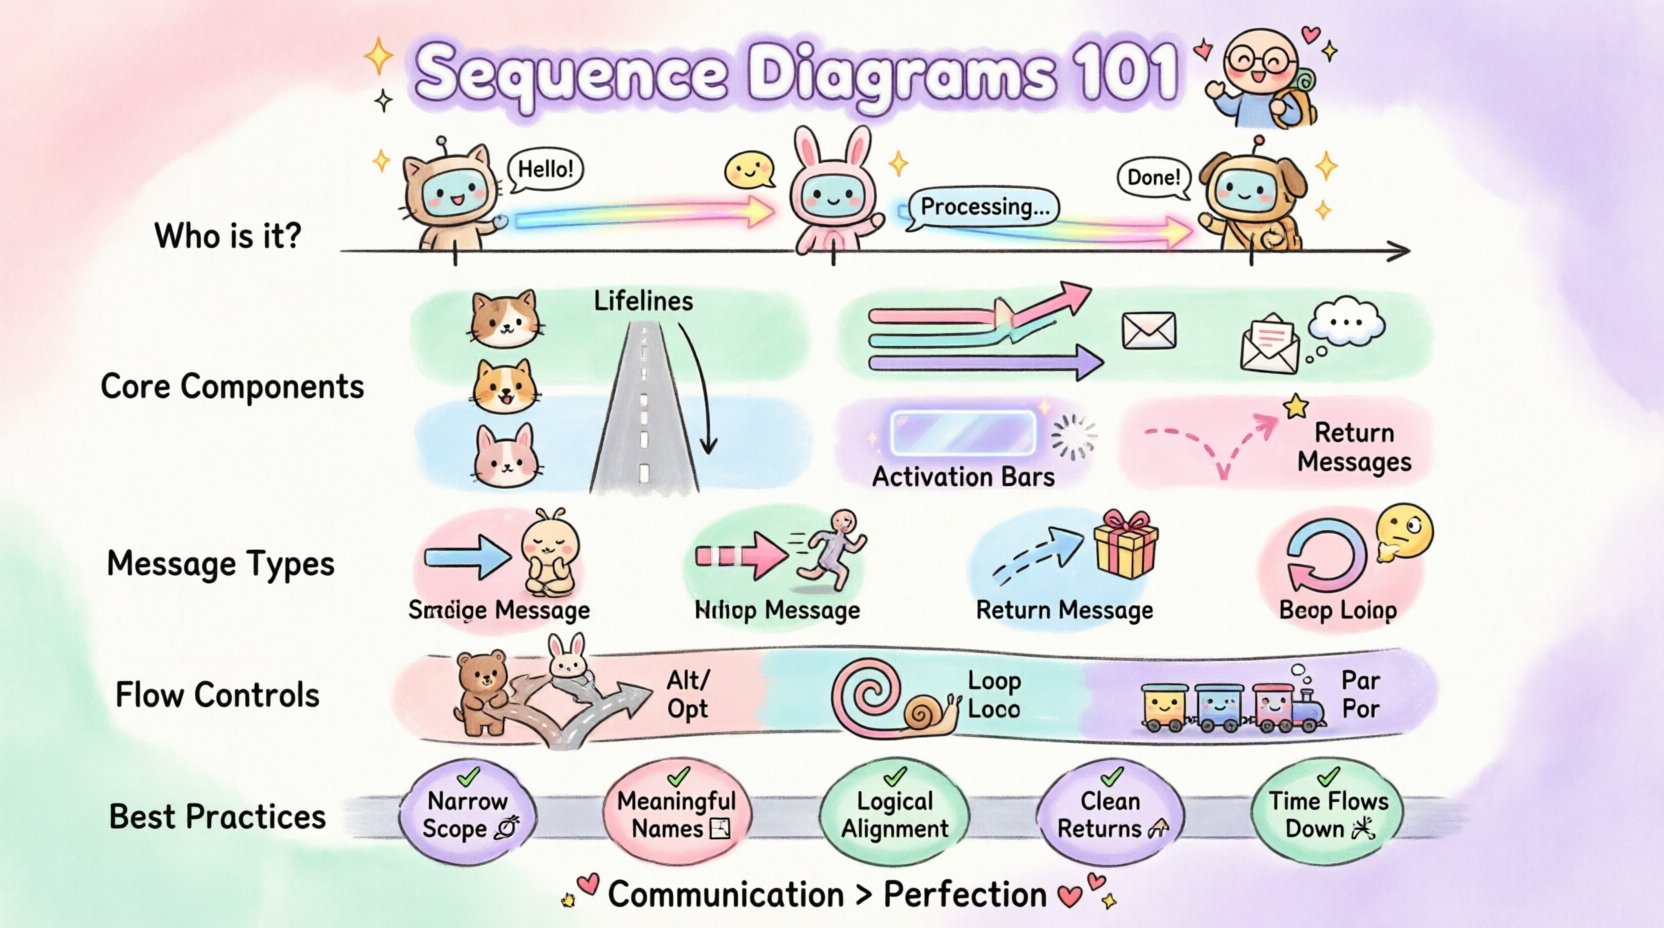
Core Components of the Diagram 🏗️
Every sequence diagram is built upon a few standard elements. Once you recognize these building blocks, reading and creating them becomes a straightforward exercise. Think of these as the vocabulary of the diagram language.
1. Lifelines (The Actors) 🏃♂️
A lifeline represents a participant in the interaction. This could be a user, a server, a database, or a specific class instance. It is drawn as a vertical dashed line extending downwards from a box at the top. The box at the top usually contains the name of the object or system. The vertical line represents the passage of time. The lower the point on the line, the later the event occurs in the sequence.
2. Messages (The Communication) 💬
Messages are the arrows that connect lifelines. They represent calls, signals, or data transfers. The direction of the arrow indicates who is sending the information and who is receiving it. Messages are typically placed horizontally across the diagram, moving from left to right.
3. Activation Bars (The Focus of Control) ⏱️
When an object is performing an action or waiting for a response, its lifeline is covered by a thin rectangle. This is called an activation bar or control focus. It visually indicates that the object is busy. When the bar ends, the object returns to an idle state, waiting for the next event.
4. Return Messages (The Response) 🔄
Not all arrows are solid. A return message is typically a dashed line with an open arrowhead. It shows the data or acknowledgment flowing back from the receiver to the sender. This distinguishes the request from the response.
Types of Messages Explained 📩
Not all interactions are created equal. The style of the arrow tells you about the nature of the communication. Understanding these distinctions is crucial for accurate modeling.
| Message Type | Visual Style | Behavior Description |
|---|---|---|
| Synchronous | Solid line, filled arrowhead | The sender waits for the receiver to finish the task before continuing. It blocks execution until a return message is received. |
| Asynchronous | Open arrowhead, solid line | The sender does not wait. It fires the message and moves on to the next task immediately. Common in event-driven architectures. |
| Return | Dashed line, open arrowhead | Represents the return of control or data to the caller. It completes the interaction cycle. |
| Self-Call | Arrow pointing to the same lifeline | An object calls one of its own methods. This is often used to show internal processing steps. |
Interaction Fragments: Controlling Flow 🔄
Real-world systems rarely follow a single straight path. They have conditions, loops, and optional steps. Sequence diagrams use frames or combined fragments to handle these scenarios. These are usually enclosed in a box with a label in the top-left corner.
- Alt (Alternative): This represents a choice. It divides the diagram into different paths based on a condition (guard). Only one path is taken. For example, if a password is correct, show the dashboard; otherwise, show an error.
- Opt (Optional): This indicates that a specific interaction might happen or might not. It is similar to an if-statement with a true condition. If the condition is false, the interaction within the frame is skipped.
- Loop: This indicates repetition. It is used when an action is performed multiple times, such as iterating through a list of items. It can include a condition specifying the number of iterations.
- Break: This is the opposite of a loop. It represents an exception or a condition that terminates the loop early.
- Par (Parallel): This indicates that multiple interactions happen at the same time. The order of execution between these parallel streams is not defined.
Best Practices for Clear Diagrams ✍️
Creating a diagram is one thing; creating a useful one is another. A cluttered diagram confuses more than it clarifies. Follow these guidelines to ensure your diagrams serve their purpose effectively.
1. Keep the Scope Narrow 🎯
Do not try to diagram the entire system in one image. A diagram should focus on a single use case or a specific critical path. If a diagram becomes too tall or complex, it loses its readability. Break large flows into multiple diagrams.
2. Use Meaningful Names 🏷️
Generic names like “Object 1” or “Service A” are frustrating to read. Use domain-specific terminology. If the system handles user authentication, name the lifeline “AuthenticationService” or “UserRepository”. This adds semantic value to the visual.
3. Align Objects Logically 📐
Place objects that interact frequently near each other. While the diagram is read top-to-bottom, the horizontal arrangement helps the eye trace the flow. Group related services together to reduce the visual distance between arrows.
4. Minimize the Return Arrows 📉
While return messages are accurate, drawing them for every single call can clutter the diagram. If the return value is not critical to the logic being explained, you may omit the return arrow or summarize it. Focus on the critical path.
5. Consistent Time Direction ⏳
Time always flows downwards. Never draw a message upwards that implies time travel. If a response comes back, the arrow points up, but the vertical position on the lifeline must be lower than the original call to maintain the timeline.
Reading a Sequence Diagram 👀
As you become more experienced, you will spend more time reading diagrams than creating them. Here is a systematic approach to deconstructing an existing diagram.
- Identify the Start: Look for the initial message. This is usually the trigger, often coming from an actor or an external system.
- Trace the Path: Follow the first message to the receiver. Check the activation bar. See what happens inside that activation.
- Look for Branches: If you see an “Alt” or “Opt” frame, check the guard conditions. Understand what data determines which path is taken.
- Check for Loops: If you see a “Loop” frame, consider how many times it runs. Does it depend on a list size? Does it depend on a user input?
- Verify End States: Ensure the diagram ends with a clear return or a termination point. Every interaction should have a conclusion.
Common Pitfalls to Avoid ⚠️
Even experienced modelers can fall into traps that reduce the utility of their diagrams. Being aware of these common mistakes helps you maintain high standards.
- Too Much Detail: Including every method call can make the diagram unreadable. Focus on the high-level interaction between services, not the internal logic of a single method.
- Ignoring Error Handling: Many diagrams only show the “Happy Path”. A robust diagram should account for error states, such as network timeouts or invalid data inputs.
- Mixing Levels of Abstraction: Do not mix high-level API calls with low-level database queries in the same diagram unless necessary. Keep the granularity consistent.
- Static Information: A sequence diagram is for dynamic behavior. Do not use it to explain static class relationships or data structures.
When to Use vs. When Not to Use 📅
Not every design problem requires a sequence diagram. Knowing when to reach for this tool is as important as knowing how to use it.
When to Use
- Designing new features and defining API contracts.
- Onboarding new team members to understand system flow.
- Debugging complex integration issues between microservices.
- Documenting the logic for critical business processes.
When Not to Use
- Describing the overall structure of a system (use Class Diagrams).
- Mapping out data storage relationships (use ER Diagrams).
- Showing general state changes of a single object (use State Machine Diagrams).
- Planning high-level business workflows (use Activity Diagrams).
Collaboration and Iteration 🤝
Sequence diagrams are not static artifacts; they are living documents of a project’s understanding. They should be reviewed alongside code. If the implementation deviates from the diagram, the diagram should be updated, or the implementation should be corrected. This ensures the documentation remains a source of truth.
In a collaborative environment, these diagrams serve as a contract. When a frontend team and a backend team agree on a sequence diagram, they agree on the interface. This reduces integration friction later in the development cycle. It allows teams to work in parallel, trusting the agreed-upon interaction flow.
Conclusion on Flow and Structure 🏁
Mastering the art of sequence diagrams takes practice, but the payoff is significant. They transform abstract conversations into concrete blueprints. By focusing on the order of events, the actors involved, and the messages exchanged, you gain a clearer view of the system’s behavior. Whether you are planning a new feature or debugging an existing service, these diagrams provide the clarity needed to move forward with confidence.
Remember that the goal is communication, not perfection. A diagram that is slightly rough but clearly understood is far more valuable than a perfect one that no one reads. Start small, focus on the critical paths, and let the diagrams evolve as your system grows.