In the landscape of software architecture, few artifacts spark as much debate as the sequence diagram. They sit at the intersection of logic, timing, and interaction, serving as a blueprint for how systems communicate over time. Yet, despite their ubiquity in object-oriented design, there exists a fog of misunderstanding surrounding their actual utility and limitations. This guide cuts through the noise to clarify what a sequence diagram truly represents and what it does not.
Whether you are designing a microservice architecture or refining a legacy monolith, understanding the precise scope of this visual tool is critical. Misinterpreting a sequence diagram can lead to flawed implementations, broken contracts, and wasted development cycles. Let us explore the mechanics, the myths, and the best practices without the fluff.
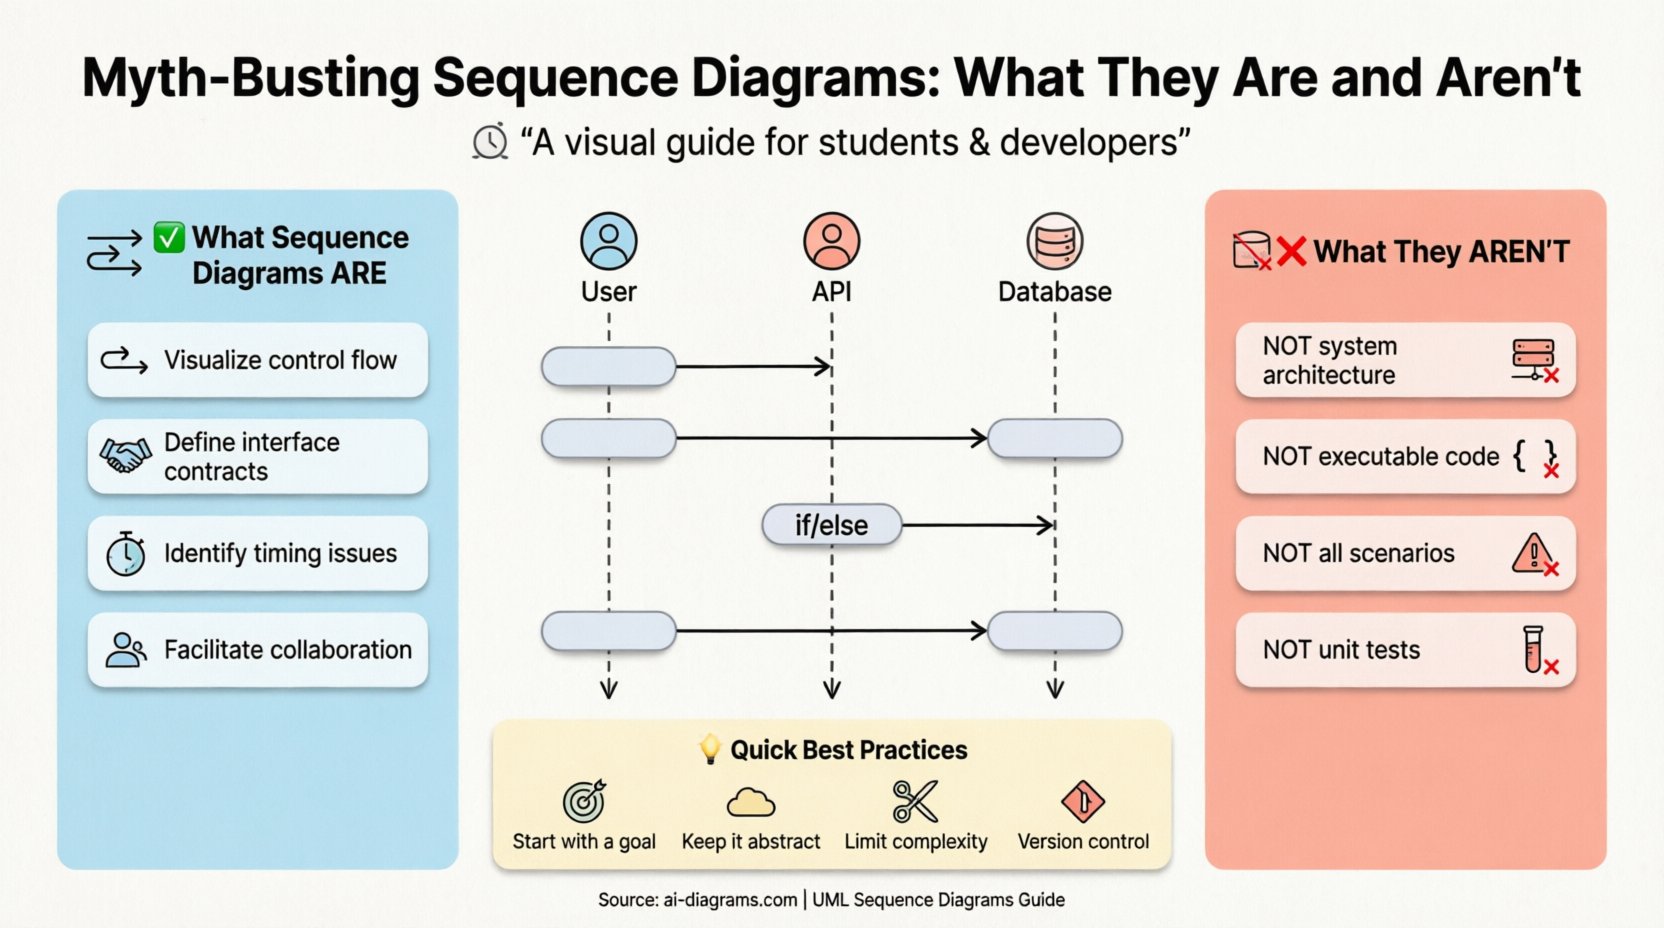
What Is a Sequence Diagram? ⏱️
A sequence diagram is a type of interaction diagram in Unified Modeling Language (UML). It describes the interactions between objects or systems in a sequence over time. The primary focus is not on the structure of the objects, but on the flow of messages between them.
Think of it as a script for a play where the actors are objects or services, and the dialogue represents method calls or data packets. The vertical axis represents time, moving from top to bottom. The horizontal axis represents the participants, arranged to show relationships.
Core Components
To read or create a sequence diagram effectively, you must recognize its fundamental building blocks:
- Participants (Lifelines): These represent objects, classes, users, or external systems. They appear as vertical dashed lines extending downward.
- Activation Bars: Rectangles on the lifeline indicating the period during which an object is performing an action or is active.
- Messages: Arrows connecting lifelines. These denote communication, whether synchronous, asynchronous, or return signals.
- Combined Fragments: Boxes that group messages together to indicate specific logic like loops, conditionals, or parallel processes.
- Time Constraints: Annotations that specify timing requirements for messages or activations.
What Sequence Diagrams Are: The Reality 🧱
When utilized correctly, sequence diagrams serve specific, high-value purposes in the software development lifecycle. They are not decorative; they are functional tools for verification and communication.
1. Visualizing Control Flow
The primary strength of this diagram is showing the order of operations. It answers the question: “What happens first, and what happens next?”. By mapping out the sequence, developers can spot logical errors before writing a single line of code.
- It clarifies the entry and exit points of a function or process.
- It highlights dependencies between components.
- It reveals potential bottlenecks where a system waits for a response.
2. Defining Interface Contracts
When teams work in parallel, the interface between services must be agreed upon. A sequence diagram acts as a contract. It specifies the arguments passed, the return values, and the error conditions expected.
- It defines the API signature visually.
- It documents the state required before a message can be sent.
- It serves as a reference for integration testing.
3. Identifying Timing Issues
In real-time systems or distributed architectures, timing is everything. Sequence diagrams allow you to annotate when a message must be received or when a timeout occurs.
- They help identify race conditions in concurrent processes.
- They visualize the latency between system components.
- They highlight synchronous blocking calls that might stall the UI.
4. Facilitating Collaboration
These diagrams bridge the gap between technical and non-technical stakeholders. A business analyst can look at the flow of data to understand the user journey, while a developer sees the technical implementation details.
- They provide a common language for design discussions.
- They reduce ambiguity in requirements gathering.
- They serve as documentation for onboarding new team members.
What Sequence Diagrams Are Not: The Myths 🚫
Despite their utility, there are persistent misconceptions. Treating a sequence diagram as a solution for everything leads to cluttered diagrams and confused teams. Here is what you should not expect from this tool.
Myth 1: It Shows System Architecture
A sequence diagram does not show the physical layout of your system. It does not indicate which server hosts which service, nor does it show network topology. That is the job of a deployment diagram or an architecture overview.
- Reality: Sequence diagrams focus on logical interaction, not physical infrastructure.
- Reality: You cannot derive a deployment plan solely from a sequence diagram.
Myth 2: It Is Code
Some believe that a detailed sequence diagram can be directly translated into executable code automatically. While code generation tools exist, the diagram itself is a specification, not an implementation.
- Reality: It lacks implementation details like error handling logic, variable types, or database queries.
- Reality: It does not specify how a calculation is performed, only that it is performed.
Myth 3: It Covers All Scenarios
Attempting to capture every edge case in a single diagram results in an unreadable mess. A sequence diagram is meant to show the happy path or a specific critical path, not every possible error state.
- Reality: Complex branching logic should be simplified or moved to use case descriptions.
- Reality: Use combined fragments for specific conditions, but do not overcomplicate the base flow.
Myth 4: It Replaces Unit Tests
A diagram shows the intended behavior. It does not verify that the behavior actually works. Relying on a diagram as proof of correctness is a dangerous fallacy.
- Reality: Automated testing is required to validate the logic depicted in the diagram.
- Reality: The diagram is a hypothesis; tests are the verification.
Common Misconceptions vs. Reality Table 📊
| Myth | Reality |
|---|---|
| It shows physical server locations. | It shows logical message flow between components. |
| It is executable code. | It is a design specification and documentation. |
| It covers every error case. | It focuses on the primary flow and key interactions. |
| It replaces database schemas. | It shows data passing, not data storage structure. |
| It is only for software developers. | It is a communication tool for all stakeholders. |
| It shows the internal logic of a method. | It shows the method call, not the code inside it. |
Deep Dive: Advanced Interaction Patterns 🔍
To truly master the utility of sequence diagrams, one must understand the specific notations used to represent complex behaviors. These patterns allow the diagram to express logic beyond simple linear flow.
1. Synchronous vs. Asynchronous Messages
The style of the arrow indicates the nature of the communication.
- Synchronous (Solid Arrowhead): The sender waits for the receiver to complete the task before continuing. This creates a blocking point in the flow.
- Asynchronous (Open Arrowhead): The sender sends the message and continues immediately. The receiver processes the request independently.
- Return Message (Dashed Line): Indicates the response from the receiver back to the sender.
2. Combined Fragments
Fragments allow you to group messages under specific conditions. These are enclosed in a box with a label in the top-left corner.
- alt (Alternative): Represents an
if-elselogic. Only one of the enclosed sections executes. - opt (Optional): Represents an optional step. The block executes only if a condition is met.
- loop: Represents a
fororwhileloop. The enclosed messages repeat. - par (Parallel): Represents concurrent processes. Multiple messages happen at the same time.
- break: Represents an exception or early exit from a loop or sequence.
3. Self-Messages
Objects often call methods on themselves. This is depicted as a loop arrow originating and terminating on the same activation bar. This is common for internal calculations or state changes that do not require external communication.
Best Practices for Creation ✍️
Creating a sequence diagram is an art form that requires discipline. Follow these guidelines to ensure your diagrams remain useful assets rather than archival clutter.
1. Start with the Goal
Before drawing, define the scope. What specific interaction are you documenting? A login flow? A payment transaction? A data retrieval process? Do not try to document the entire system in one diagram.
2. Keep Participants Abstract
Use generic names for participants unless the specific class name is essential for understanding the interaction. “User” is often better than “CustomerController”. “Database” is better than “MySQL_Instance_01”.
3. Limit the Depth
If a sequence diagram requires more than 20-30 participants or extends beyond the height of a standard page, it is likely too complex. Break it down into smaller, focused diagrams.
4. Use Time Consistency
Ensure that the vertical alignment of messages makes sense. If two messages are at the same vertical level, they should occur at the same time. Do not draw arrows that cross each other unnecessarily; it reduces readability.
5. Document Assumptions
If a diagram assumes a service is always available, state that. If it assumes a database is ACID compliant, note it. Assumptions hidden in diagrams lead to implementation errors.
6. Version Control
Just like code, sequence diagrams change. Treat them as versioned artifacts. A diagram for version 1.0 of an API should not be overwritten by version 1.1 without archiving the old one.
When to Use and When to Avoid 🛑
Not every design problem requires a sequence diagram. Applying the right tool to the right problem is the mark of an experienced architect.
When to Use
- Designing APIs: When defining request/response structures.
- Debugging Complex Flows: When tracing a bug through multiple services.
- Onboarding: When explaining a new feature to a new hire.
- Refactoring: When ensuring a refactor preserves existing interaction contracts.
- Security Audits: When analyzing where sensitive data is passed.
When to Avoid
- Simple Scripts: If a process is linear and contained in one file, a diagram is overkill.
- High-Level Strategy: For executive summaries, use a context diagram or system overview instead.
- Static State: If you need to show data storage relationships, use a Class Diagram or Entity Relationship Diagram.
- State Changes: If the focus is on the state of a single object over time, use a State Machine Diagram.
Common Pitfalls to Watch Out For ⚠️
Even experienced practitioners make mistakes. Being aware of common pitfalls can save hours of rework.
1. The “Spaghetti” Diagram
This occurs when too many lifelines are drawn, causing arrows to crisscross wildly. It becomes impossible to trace a single path.
- Solution: Group related participants together. Use sub-sequences to hide detail.
2. Ignoring the Return Path
Many diagrams only show the request, ignoring the response. This hides potential performance bottlenecks and error handling logic.
- Solution: Always include the return message, even if it is just an acknowledgment.
3. Overusing “alt” Blocks
Using alt for every single condition makes the diagram look like a decision tree rather than a flow. It obscures the main path.
- Solution: Keep the main path clear. Move complex branching logic to separate diagrams.
4. Mixing Levels of Abstraction
Combining high-level business steps with low-level database queries in the same diagram confuses the reader.
- Solution: Create a high-level diagram for the business flow and a low-level diagram for the technical implementation.
Integration into the Development Workflow 🔄
Sequence diagrams should not exist in a vacuum. They must be integrated into the daily rhythm of the development team.
Pre-Development
Before coding begins, stakeholders should review the diagrams. This is the point where logic gaps are found. If the diagram does not make sense to the business analyst, the code will likely fail requirements.
During Development
Developers should reference the diagram while writing code. If the code deviates from the diagram without a corresponding update to the diagram, the documentation is now lying.
Post-Development
After testing, the diagram should be updated to reflect the actual behavior, especially if changes were made during implementation. This ensures the documentation remains accurate for future maintenance.
The Future of Sequence Diagrams 🚀
As systems become more distributed and event-driven, the role of sequence diagrams evolves. Modern tools now support real-time collaboration, allowing multiple architects to edit a diagram simultaneously. Some platforms even link diagrams directly to code repositories, highlighting when the implementation diverges from the design.
The core principles remain the same, however. Time flows downward. Messages flow horizontally. Clarity is king. Whether you are using pen and paper or a digital modeling platform, the discipline required to create a useful sequence diagram is the same.
Final Thoughts on Design Clarity 🎯
Sequence diagrams are a powerful lens through which to view system behavior. They force you to think about timing, interaction, and order. However, they are not a silver bullet. They require maintenance, discipline, and a clear understanding of their limitations.
By distinguishing between what they are and what they are not, you can leverage them to improve communication, reduce errors, and build more robust systems. Avoid the traps of over-documentation and under-communication. Strive for diagrams that are concise, accurate, and actionable.
Remember, the goal is not to create a pretty picture. The goal is to create a tool that helps you build better software. Use sequence diagrams to illuminate the path, not to obscure it.

