Building a viable organization requires more than just a solid idea. It demands a clear understanding of how every strategic decision translates into monetary value. The Business Model Canvas (BMC) provides a visual blueprint for strategy, but without financial projections, it remains a theoretical exercise. To create a sustainable enterprise, you must bridge the gap between strategic design and numerical reality.
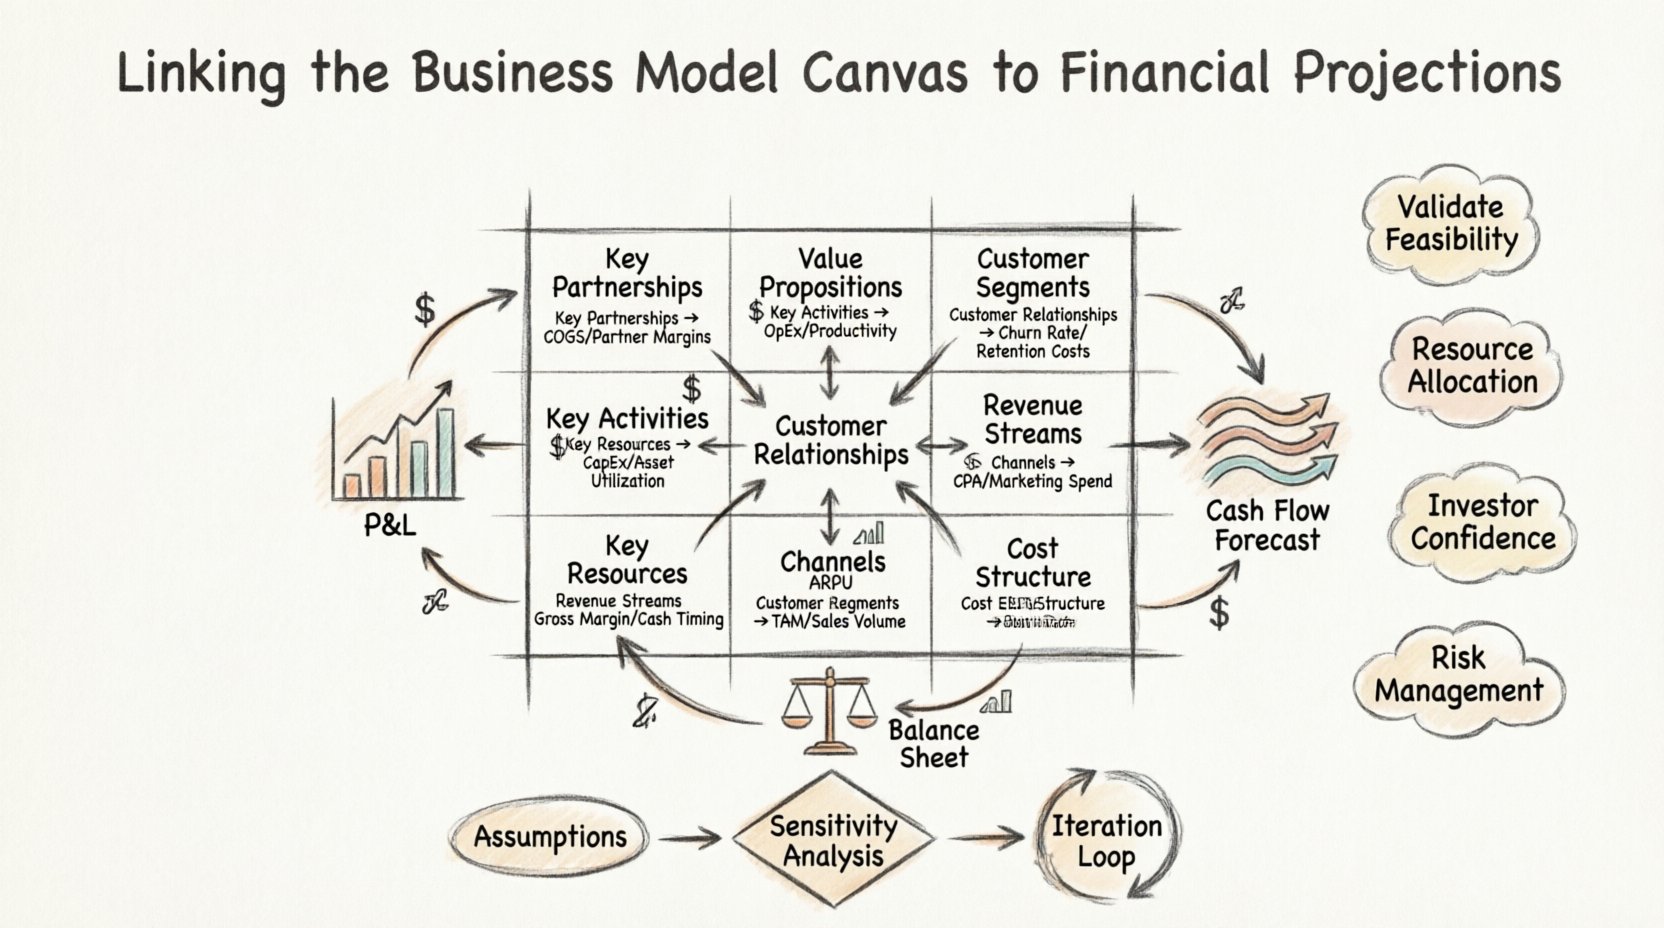
Linking the Business Model Canvas to Financial Projections ensures that your value proposition is not only desirable but also economically feasible. This process involves mapping the nine building blocks of the canvas directly to line items in a Profit and Loss statement, a Cash Flow forecast, and a Balance Sheet. This alignment allows founders and stakeholders to validate assumptions before capital is deployed.
When these two frameworks operate in silos, risk increases significantly. A canvas might look innovative, but if the cost structure does not support the revenue model, the venture will fail. Conversely, financial projections without a clear strategic context are often arbitrary guesses. By integrating them, you create a coherent narrative that investors and partners can trust.
Why Strategy Needs Numerical Backing 🔢
Strategy defines direction, while finance measures the fuel required to reach the destination. The Business Model Canvas outlines what you do and who you serve. Financial projections quantify how much it costs and how much you earn.
Here are the core reasons why this integration is non-negotiable:
- Validation of Feasibility: A strong value proposition might sound great, but does the cost of delivery exceed the price customers are willing to pay? Financials answer this.
- Resource Allocation: The canvas identifies key resources. The budget dictates how those resources are prioritized and acquired.
- Investor Confidence: Stakeholders need to see the path to profitability. Numbers grounded in strategic blocks provide that path.
- Risk Management: Understanding the break-even point helps manage cash burn and runway.
- Operational Alignment: Departments understand how their activities contribute to the bottom line when linked to specific canvas blocks.
Without this link, teams often chase vanity metrics. For instance, acquiring users might be a key activity, but if the Customer Acquisition Cost (CAC) exceeds the Lifetime Value (LTV), the activity destroys value. Financial projections grounded in the BMC prevent this outcome.
The 9 Building Blocks and Their Financial Counterparts 🧩
To effectively link the canvas to finance, one must understand the specific financial implications of each building block. Below is a detailed breakdown of how each element translates into the financial landscape.
| Business Model Canvas Block | Primary Financial Impact | Key Metric |
|---|---|---|
| Value Propositions | Pricing Strategy, Revenue Potential | Average Revenue Per User (ARPU) |
| Customer Segments | Market Size, Sales Volume | Total Addressable Market (TAM) |
| Channels | Distribution Costs, Marketing Spend | Cost Per Acquisition (CPA) |
| Customer Relationships | Retention Costs, Support Expenses | Churn Rate |
| Revenue Streams | Income Recognition, Cash Flow Timing | Gross Margin |
| Key Resources | Capital Expenditure (CapEx), Depreciation | Asset Utilization |
| Key Activities | Operating Expenses (OpEx), Labor Costs | Productivity Ratios |
| Key Partnerships | COGS, Outsourcing Costs | Partner Margin Share |
| Cost Structure | Total Expenses, Burn Rate | EBITDA |
Each row in this table represents a critical node where strategy meets accounting. Let us explore these connections in greater depth.
Revenue Streams: Pricing Power and Volume 💰
The Revenue Streams block is the most direct link to the top line of your financial statements. However, it is not merely about setting a price. It involves understanding the mechanics of how value is captured.
Pricing Models and Financial Implications
Different revenue models require different financial assumptions:
- Subscription Models: Require a focus on Monthly Recurring Revenue (MRR) and Churn. Projections must account for the lag between sign-up and cash receipt.
- Transaction Fees: Rely heavily on volume. Financial models must be elastic to handle fluctuations in transaction frequency.
- Licensing: Often involves high upfront revenue with lower recurring costs, affecting cash flow timing significantly.
- Freemium: Requires a detailed conversion funnel analysis. You must project the ratio of free users to paying users to understand profitability.
Assumptions Validation
When projecting revenue, do not rely on a single number. Use a range based on the assumptions in your Value Proposition. If your value proposition claims a 50% time savings, your pricing must reflect that premium. If the market perceives the value as low, your revenue projections must adjust downward.
Consider the elasticity of demand. If you raise prices by 10%, will volume drop by 5% or 20%? This relationship is a direct translation of your Value Proposition’s strength into financial reality.
Cost Structure: Fixed vs. Variable Dynamics 💸
The Cost Structure block dictates the bottom line and the break-even point. It is essential to distinguish between fixed costs (costs that remain constant regardless of output) and variable costs (costs that scale with sales).
Mapping Activities to Expenses
Key Activities directly influence Operating Expenses (OpEx). For example:
- Software Development: Often treated as R&D expense. Costs are primarily labor-based (fixed) but can scale with cloud infrastructure (variable).
- Marketing: Often treated as a variable cost relative to revenue, but frequently budgeted as a fixed spend to achieve specific goals.
- Sales: Can be fixed (salaries) or variable (commissions).
Understanding Economies of Scale
A strong Business Model Canvas often aims for economies of scale. As volume increases, the fixed cost per unit decreases. Your financial projections must model this transition.
If your Key Resources involve heavy machinery or proprietary technology, your fixed costs will be high initially. As revenue grows, these costs become a smaller percentage of total revenue, improving margins. Conversely, if your model relies heavily on human labor for every unit sold, variable costs remain high, limiting margin expansion.
Key Partnerships and Supply Chain Costs 🤝
Key Partnerships are often overlooked in financial planning, yet they significantly impact the Cost of Goods Sold (COGS) and cash flow. Outsourcing manufacturing, using third-party logistics, or licensing technology changes the financial structure of the business.
Impact on COGS
When you partner with a supplier, you often trade margin for flexibility. A supplier might charge a higher unit price, increasing your COGS, but they reduce your fixed capital expenditure by removing the need to build a factory. This shifts the financial model from CapEx heavy to OpEx heavy.
Payment Terms and Cash Flow
Partnership agreements dictate payment terms. If your partners require upfront payment but you collect from customers on net-30 terms, you create a cash flow gap. This gap must be funded by working capital.
Financial projections must include a scenario analysis for partnership risks. What happens if a key partner raises prices by 10%? What happens if they delay delivery? These risks must be quantified in the cash flow model.
Customer Relationships and Retention Costs 🤑
Acquiring a customer is only half the battle. The Customer Relationships block defines how you retain them. Financially, this translates to retention costs versus acquisition costs.
Support and Service Costs
High-touch relationship models (like concierge services) require significant human resources. This appears as a high fixed cost in the salary line item. Low-touch models (self-service) shift costs to technology infrastructure.
Your financial model should separate support costs into:
- Fixed support salaries.
- Variable support costs (tiered support based on volume).
Lifetime Value (LTV)
The strength of your relationship model directly impacts LTV. A loyal customer spends more over time. If your Value Proposition builds strong loyalty, your LTV increases.
To calculate LTV accurately, you need:
- Average Order Value.
- Purchase Frequency.
- Retention Rate.
If your Customer Relationships block is weak, churn will be high. This makes your revenue projections volatile and reduces the present value of future cash flows.
Cash Flow Timing and Working Capital ⏳
Profitability is not the same as solvency. A company can be profitable on paper but go bankrupt due to cash flow mismanagement. The Business Model Canvas helps visualize the timing of cash inflows and outflows.
The Cash Conversion Cycle
Link the Channels and Revenue Streams blocks to the Cash Conversion Cycle. How long does it take to turn inventory into cash? If your model involves selling products online but shipping them globally, the lag time affects working capital requirements.
Working Capital Needs
Before launching, you must calculate the cash needed to cover the gap between paying suppliers and receiving customer payments. This is often underestimated in early-stage planning.
Key questions to answer:
- Do you need to buy inventory before selling?
- Do you need to pay staff before receiving revenue?
- Do you have credit terms with partners that are stricter than your terms with customers?
Financial projections must include a detailed monthly cash flow statement for at least the first 18 months to identify potential cash crunches.
Validating Assumptions Through Sensitivity Analysis 📉
Once the BMC is linked to financial projections, the next step is stress testing. Assumptions about market size, conversion rates, and costs are rarely 100% accurate. Sensitivity analysis helps determine how robust the business model is.
Scenario Planning
Develop three distinct scenarios based on your BMC assumptions:
- Base Case: Assumes average performance for all blocks.
- Bear Case: Assumes higher costs, lower conversion, and slower growth. This tests your runway.
- Bull Case: Assumes viral growth and lower-than-expected costs. This tests your capacity to scale.
Key Drivers
Identify the top three drivers that impact your cash flow the most. Usually, these are:
- Customer Acquisition Cost.
- Churn Rate.
- COGS Margin.
Focus your operational efforts on optimizing these specific areas. If your BMC indicates that partnerships drive your COGS, then negotiation power becomes a critical success factor.
Common Mistakes When Bridging the Gap 🚫
Many organizations fail to integrate their strategy and finance effectively. Recognizing these pitfalls early can save significant resources.
1. Disconnecting Activities from Costs
Assigning costs to activities without mapping them to the Value Proposition. For example, spending heavily on marketing (Activity) for a value proposition that does not resonate (Value Proposition) leads to wasted capital.
2. Ignoring Indirect Costs
Focusing only on direct COGS and ignoring overhead. The Cost Structure block should account for administrative salaries, legal fees, and office space. These often eat into margins.
3. Overestimating Revenue Velocity
Assuming revenue will ramp up linearly. In reality, adoption curves are often S-shaped. Early stages may see little revenue despite high activity costs.
4. Static Models
Creating a financial model once and never updating it. The Business Model Canvas is a living document. If you pivot your strategy, your financial projections must pivot immediately.
Iterating the Model Based on Financial Reality 🔄
The ultimate goal of linking the Business Model Canvas to financial projections is iteration. As you gather real-world data, you will discover discrepancies between your assumptions and reality.
Data-Driven Pivots
If financial data shows that Customer Acquisition Cost is too high, revisit the Channels block. Can you shift to organic growth? If so, update the canvas and adjust the budget accordingly.
If the Cost Structure is too heavy, revisit Key Resources. Can you outsource this function to a partner? Update the Key Partnerships block and recalculate the financials.
Continuous Feedback Loop
Establish a monthly review process where the team compares actual financial results against the projections derived from the canvas.
- Review: Did we hit the revenue targets?
- Analyze: Which block caused the variance?
- Adjust: Update the canvas or the financial assumptions.
This loop ensures that the organization remains agile. It prevents the sunk cost fallacy where teams continue investing in a strategy that the numbers prove is unviable.
Final Thoughts on Strategic Finance 🎯
Linking the Business Model Canvas to Financial Projections is not a one-time task. It is a continuous discipline that aligns vision with viability. When done correctly, it transforms a collection of ideas into a predictable, manageable business.
The canvas provides the story of the business, while the financials provide the evidence. Together, they form a complete picture for decision-makers. By understanding how each block impacts the P&L, Cash Flow, and Balance Sheet, you build a foundation that can withstand market volatility.
Start by mapping your current canvas to a simple spreadsheet. Identify the gaps. Test your assumptions. Iterate based on the data. This rigorous approach separates sustainable ventures from short-lived experiments.
Remember, the numbers do not lie, but they do require context. The Business Model Canvas provides that context. Use them together to navigate the complexities of building a successful enterprise.

