Modern software development relies heavily on clear communication. Yet, textual specifications often fail to convey the dynamic nature of system behavior. 🧠 System documentation is frequently treated as a static artifact, disconnected from the evolving reality of the codebase. This disconnection creates friction during development, maintenance, and scaling phases. Sequence diagrams offer a structured way to visualize interactions. They map the flow of messages between objects or components over time. By introducing temporal context, these diagrams transform abstract requirements into concrete execution paths. This guide explores the tangible impact of sequence diagrams on system documentation quality.
Understanding Sequence Diagrams 🧩
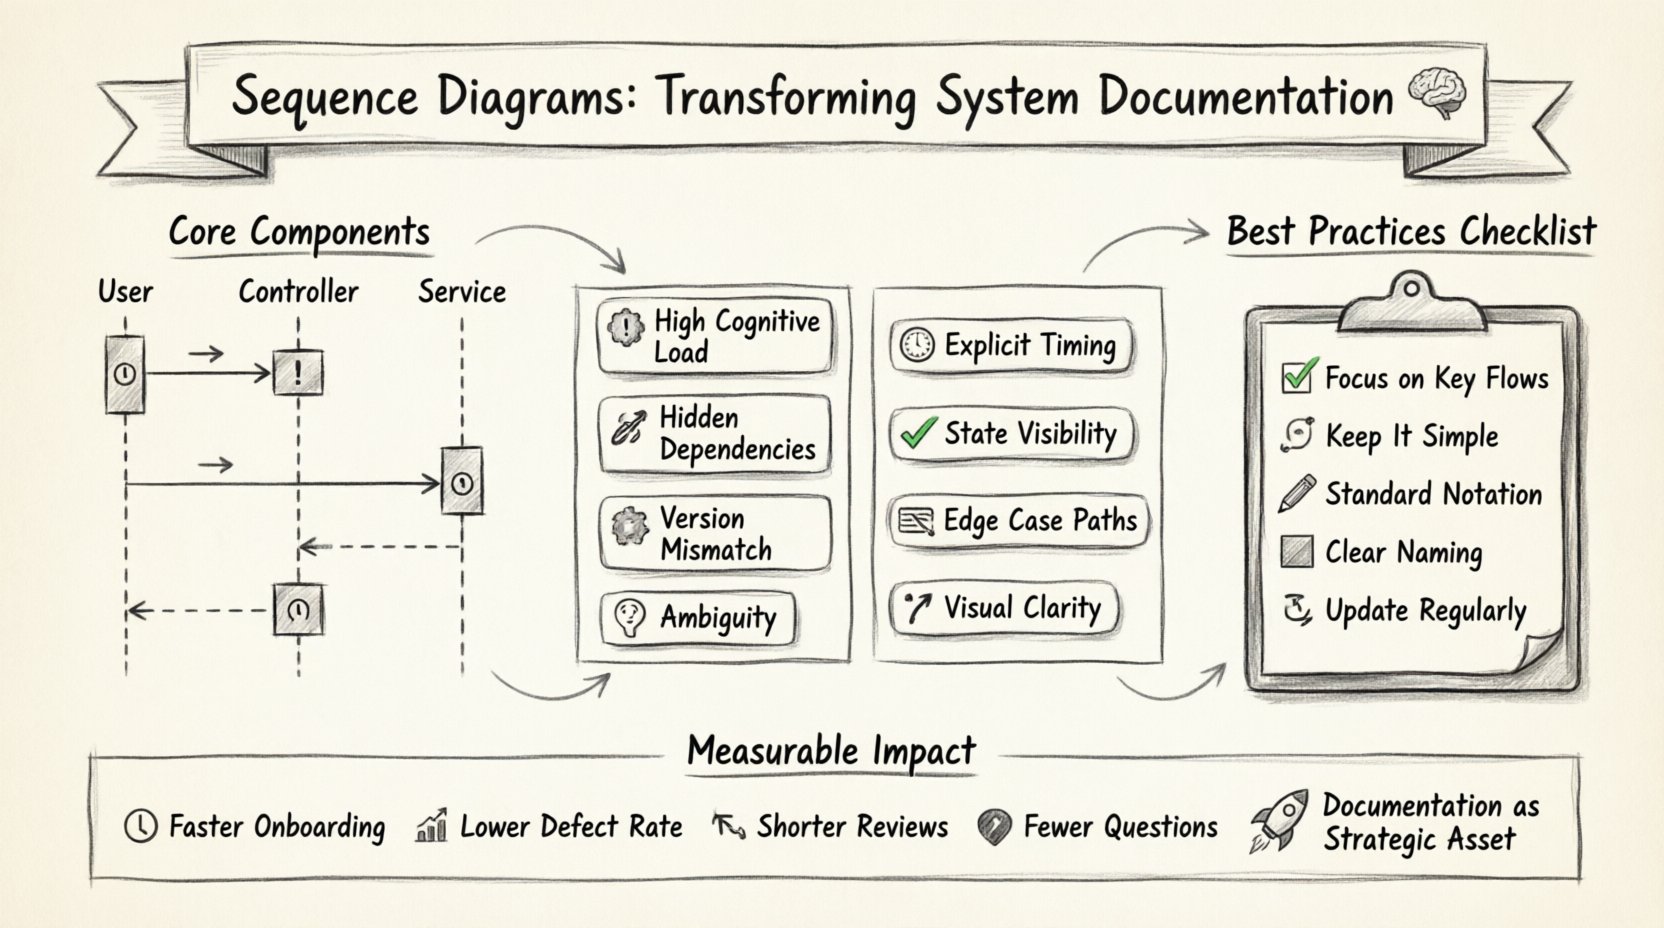
A sequence diagram is a specific type of interaction diagram used in system modeling. It focuses on the ordering of interactions. Unlike static class diagrams, which show structure, sequence diagrams show behavior. This distinction is critical for documenting how a system functions under load or during specific user actions.
The core components include:
- Lifelines: Represent participants in the interaction, such as users, controllers, or external services. 🏃
- Messages: Indicate data transfer or method calls between lifelines. ➡️
- Activation Bars: Show the period during which an object is performing an action. ⏳
- Return Messages: Indicate the response from the receiver back to the sender. ⬅️
When used correctly, these elements create a timeline. This timeline helps stakeholders understand the sequence of events. It clarifies which component initiates a process and which component resolves it. This clarity is the foundation of robust technical documentation.
Why System Documentation Struggles 📉
Documentation projects often fail to maintain relevance. Several factors contribute to this issue. First, text-based requirements are linear. They describe steps sequentially but often miss parallel processes. 🔄 Second, updates to the codebase are rarely reflected in documents immediately. This leads to “spec drift,” where the document no longer matches the system.
Common challenges include:
- High Cognitive Load: Readers must mentally construct the flow from text descriptions. 🧩
- Hidden Dependencies: Text often implies relationships that are not explicit. 🔗
- Version Mismatch: Code evolves faster than written specs. 📅
- Ambiguity: Natural language allows for multiple interpretations. 🤷
Without a visual representation of time and state, teams rely on memory or oral communication. This creates a fragile knowledge base. Sequence diagrams mitigate these risks by externalizing the logic.
The Specific Impact on Clarity and Precision 🎯
Visualizing interactions reduces the mental effort required to understand a system. Humans process visual patterns faster than text blocks. When a developer reviews a sequence diagram, they see the path of data immediately. There is no need to trace through paragraphs of prose.
Key benefits include:
- Explicit Timing: Synchronous calls block execution, while asynchronous calls do not. This distinction is often lost in text. ⏱️
- State Visibility: Activation bars show when resources are held. This helps identify potential bottlenecks. 🚦
- Edge Case Handling: Fragments like “Alt” or “Opt” clearly show alternative paths. 🛣️
Consider a scenario where an order is placed. Text might say: “The system checks inventory. If available, it charges the card.” A sequence diagram shows the exact order. It shows the failure path explicitly. It shows the timeout handling. This level of precision is difficult to achieve with words alone.
Facilitating Cross-Functional Communication 🤝
Software projects involve diverse roles. Architects, developers, product managers, and QA engineers all need to understand the system. Each role has a different focus. Sequence diagrams serve as a universal language. They bridge the gap between technical implementation and business requirements.
| Feature | Text Specification | Sequence Diagram |
|---|---|---|
| Logic Flow | Hard to trace in paragraphs | Visual path is obvious |
| Timing | Often implicit or vague | Explicit ordering of events |
| Errors | Described abstractly | Visible failure paths |
| Onboarding | Slow and confusing | Fast and intuitive |
Product managers can validate business logic without knowing code syntax. Developers can validate technical constraints without reading business requirements. This shared understanding reduces rework. It ensures everyone builds the same system.
Best Practices for Effective Modeling 🛠️
Creating a diagram is not enough. The diagram must be useful. Poorly constructed diagrams add noise rather than signal. Adhering to standard conventions ensures consistency. Here are guidelines for maintaining high-quality documentation.
- Focus on Scope: Do not diagram every single method. Focus on key flows. 🎯
- Keep it Simple: Avoid nesting too many fragments. Keep the path linear where possible. 📏
- Use Standard Notation: Follow established modeling standards. This ensures readability across teams. 📐
- Name Clearly: Label lifelines and messages descriptively. Avoid generic names like “Object1”. 🏷️
- Update Regularly: Treat diagrams as code. They must change when the system changes. 🔄
Over-documentation is a risk. A diagram that is too detailed becomes unreadable. Aim for the “Goldilocks” zone. It should be simple enough to understand at a glance but detailed enough to be accurate. Balance is key to effective documentation.
Maintenance and Version Control 🔄
The most common failure point for documentation is obsolescence. A diagram created during design may be outdated by the time deployment occurs. To prevent this, diagrams must be integrated into the development lifecycle.
Strategies for maintenance include:
- Version Control: Store diagram files in the same repository as the code. 🔧
- Review Process: Include diagram updates in pull request reviews. 📝
- Automated Generation: Where possible, generate diagrams from code to ensure accuracy. 🤖
- Documentation as Code: Use text-based formats that are easy to edit and diff. 📄
When a feature is added, the diagram should be updated. If it is not, the documentation becomes a liability. Teams must prioritize this work. It is part of the definition of done. This discipline ensures the documentation remains a reliable reference.
Measuring the Value of Visual Specs 📈
How do you know if sequence diagrams are helping? Qualitative feedback is useful, but quantitative data is better. Track metrics that relate to clarity and efficiency.
- Onboarding Time: Measure how long it takes new hires to understand the system. ⏱️
- Defect Rate: Track bugs related to logic errors or integration issues. 🐛
- Review Cycle Time: See if design reviews take less time with diagrams. 🕒
- Communication Overhead: Monitor the frequency of clarification questions. ❓
If these metrics improve after implementing sequence diagrams, the investment is justified. Even if metrics do not change immediately, the reduction in ambiguity is a long-term benefit. It builds a culture of precision.
Final Thoughts on Documentation Quality 🏁
System documentation is not just a record of what was built. It is a tool for how the system is understood. Sequence diagrams play a pivotal role in this understanding. They convert complex interactions into a readable format. They reduce the risk of misinterpretation.
While text will always be necessary for context, visuals provide the skeleton. Teams that prioritize these diagrams often find themselves more agile. They can refactor code with confidence. They can onboard new members faster. They can communicate complex ideas without confusion. This is the true impact of sequence diagrams. They transform documentation from a chore into a strategic asset. 🚀

